| Param | Original file | Final file |
|---|---|---|
| Filename | modeM0/AS1A07_007T04_9000003276_22108cztM0_level2.evt | modeM0/AS1A07_007T04_9000003276_22108cztM0_level2_quad_clean.evt |
| Size (bytes) | 588,798,720 | 107,755,200 |
| Size | 561.5 MB | 102.8 MB |
| Events in quadrant A | 3,801,702 | 708,137 |
| Events in quadrant B | 3,696,334 | 714,112 |
| Events in quadrant C | 3,619,694 | 687,764 |
| Events in quadrant D | 6,201,463 | 627,176 |
| Mode M9 | |||
|---|---|---|---|
| Quadrant | BADHDUFLAG | Total packets | Discarded packets |
| A | 0 | 3 | 0 |
| B | 0 | 3 | 0 |
| C | 0 | 3 | 0 |
| D | 0 | 3 | 0 |
| Mode M0 | |||
|---|---|---|---|
| Quadrant | BADHDUFLAG | Total packets | Discarded packets |
| A | 0 | 16266 | 2 |
| B | 0 | 15947 | 2 |
| C | 0 | 15673 | 2 |
| D | 0 | 23750 | 3 |
| Mode SS | |||
|---|---|---|---|
| Quadrant | BADHDUFLAG | Total packets | Discarded packets |
| A | 0 | 154 | 0 |
| B | 0 | 154 | 0 |
| C | 0 | 154 | 0 |
| D | 0 | 154 | 0 |
| Quadrant | Total seconds | Saturated seconds | Saturation percentage |
|---|---|---|---|
| A | 7555 | 90 | 1.191264% |
| B | 7556 | 92 | 1.217575% |
| C | 7556 | 124 | 1.641080% |
| D | 7555 | 764 | 10.112508% |
Noise dominated data is calculated using 1-second bins in cleaned event files. If a bin has >2000 counts, and if more than 50% of those come from <1% of pixels, then it is considered to be noise-dominated and hence unusable.
| Quadrant | # 1 sec bins | Bins with >0 counts | Bins with >2000 counts | High rate bins dominated by noise | Noise dominated (total time) | Noise dominated (detector-on time) | Marked lightcurve |
|---|---|---|---|---|---|---|---|
| A | 7870 | 7557 | 7 | 7 | 0.09% | 0.09% | 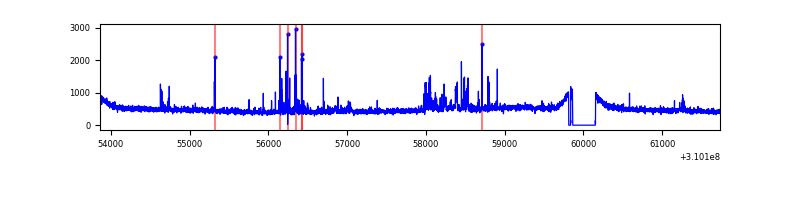 |
| B | 7871 | 7558 | 8 | 8 | 0.10% | 0.11% | 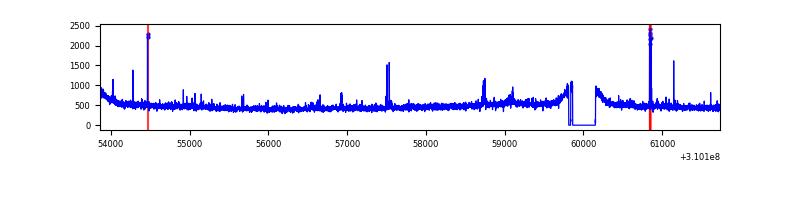 |
| C | 7871 | 7558 | 0 | 0 | 0.00% | 0.00% | 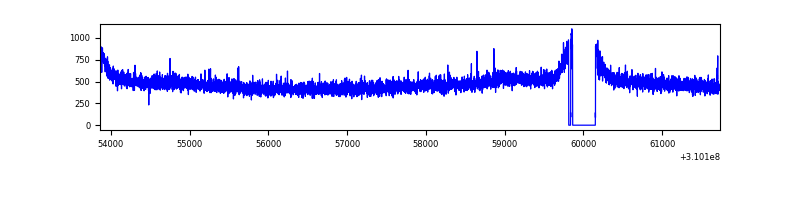 |
| D | 7870 | 7557 | 515 | 515 | 6.54% | 6.81% | 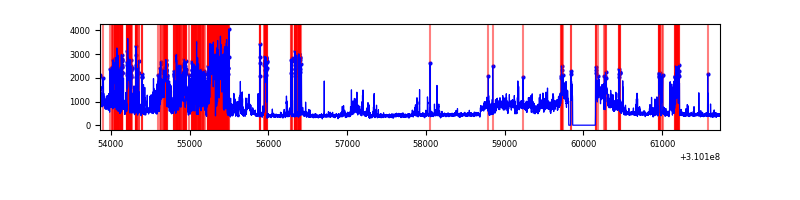 |
Top three noisy pixels from each quadrant. If the there are fewer than three noisy pixels in the level2.evt file, extra rows are filled as -1
| Pixel properties | Quadrant properties | ||||||
|---|---|---|---|---|---|---|---|
| Quadrant | DetID | PixID | Counts | Sigma | Mean | Median | Sigma |
| A | 5 | 16 | 200275 | 1064.09 | 926 | 905 | 187.4 |
| A | 4 | 2 | 13460 | 67.01 | 926 | 905 | 187.4 |
| A | 13 | 254 | 12982 | 64.46 | 926 | 905 | 187.4 |
| B | 0 | 230 | 41858 | 232.92 | 920 | 898 | 175.9 |
| B | 12 | 111 | 21937 | 119.64 | 920 | 898 | 175.9 |
| B | 15 | 36 | 19676 | 106.78 | 920 | 898 | 175.9 |
| C | 14 | 238 | 140845 | 666.52 | 891 | 896 | 210.0 |
| C | 10 | 22 | 7259 | 30.3 | 891 | 896 | 210.0 |
| C | 13 | 61 | 6245 | 25.48 | 891 | 896 | 210.0 |
| D | 11 | 176 | 1449372 | 6815.09 | 866 | 841 | 212.5 |
| D | 1 | 52 | 428306 | 2011.15 | 866 | 841 | 212.5 |
| D | 12 | 33 | 270570 | 1269.03 | 866 | 841 | 212.5 |
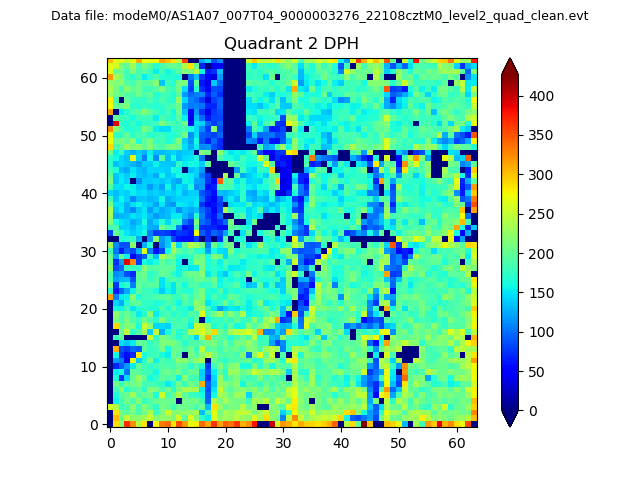
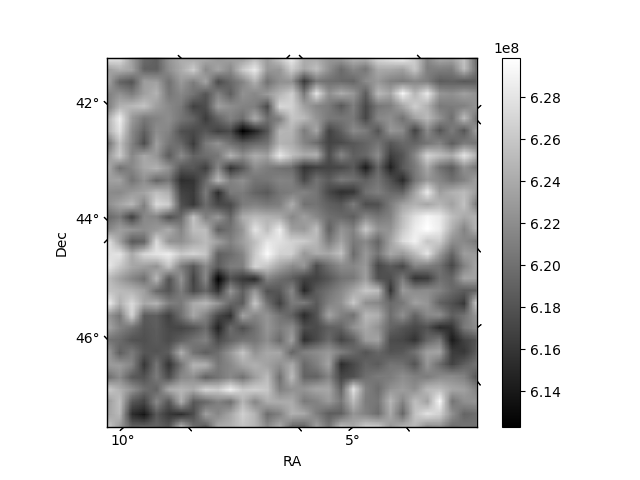
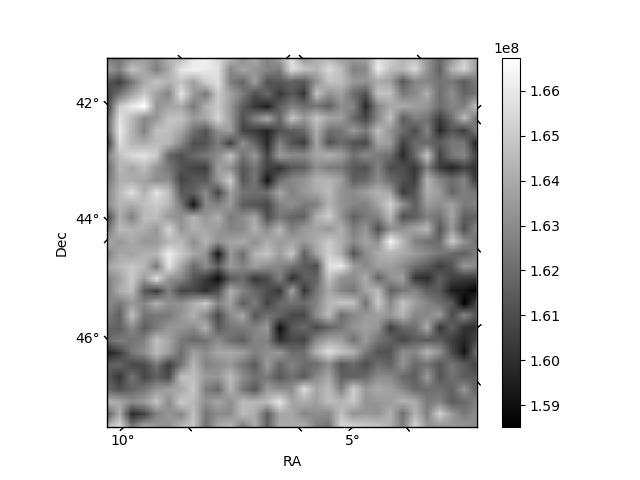
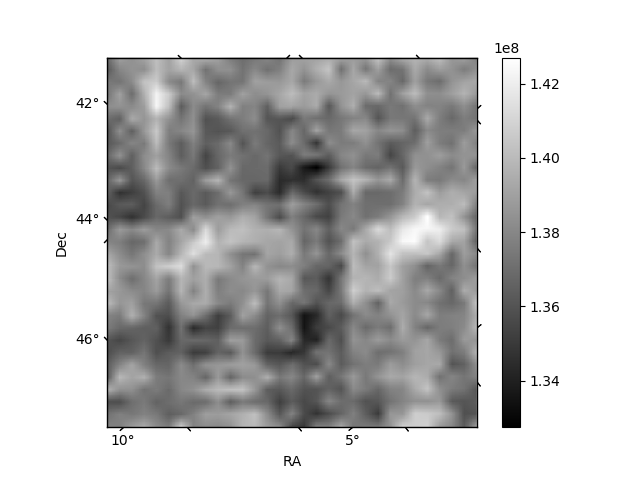
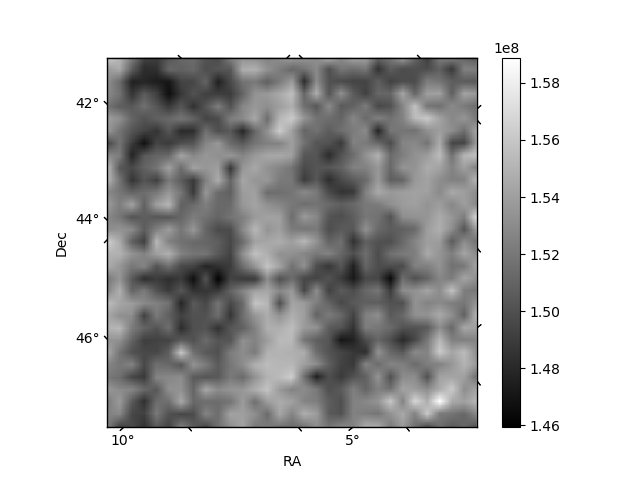
Histogram calculated using DETX and DETY for each event in the final _common_clean file
| Quadrant A | 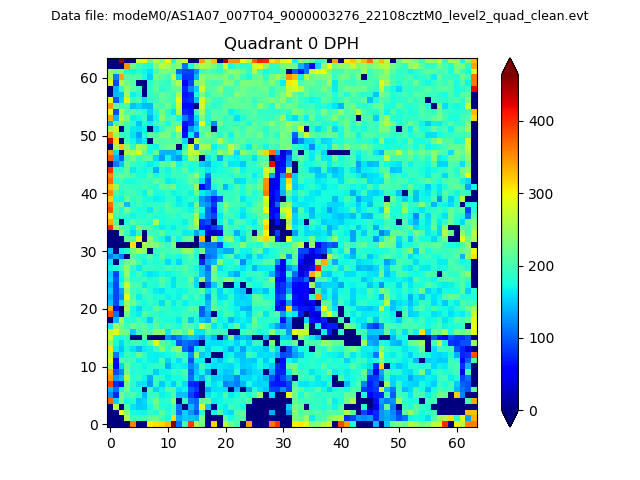 |
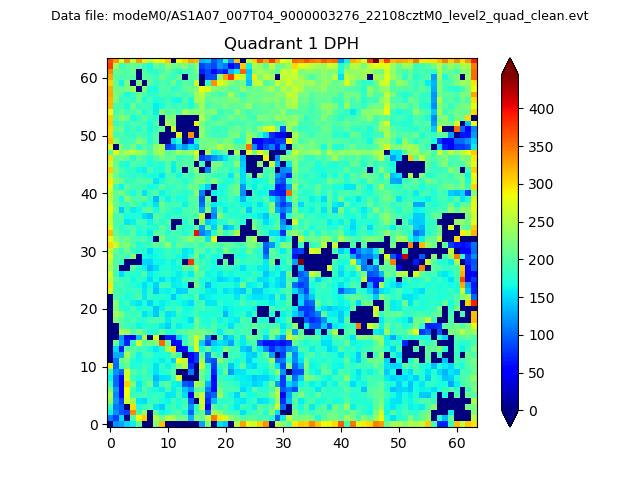 |
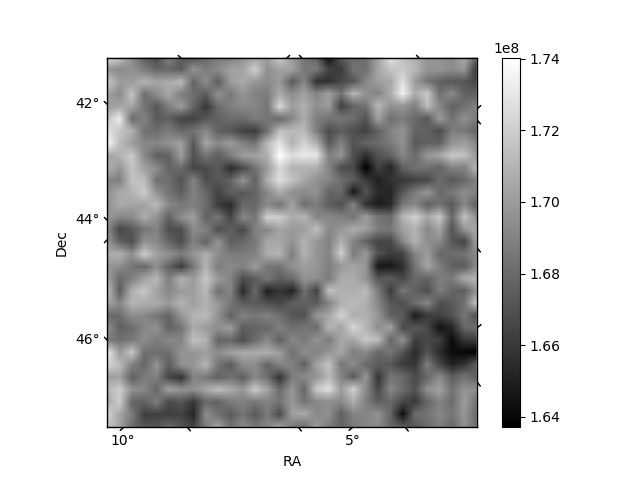
Quadrant B |
|---|---|---|---|
| Quadrant D | 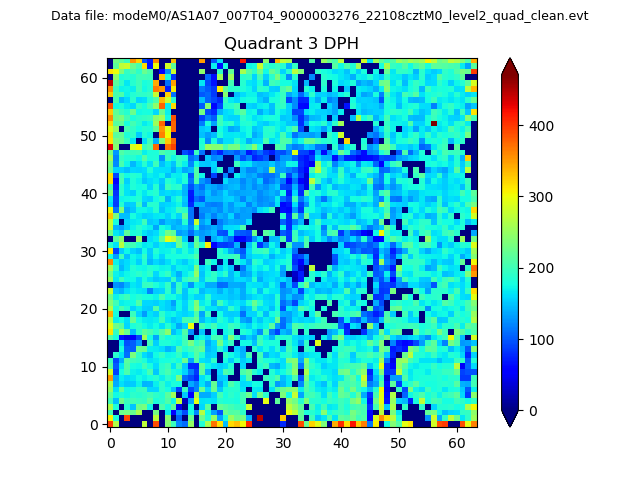 |
 |
Quadrant C |
| Plot type | Count rate plots | Images |
|---|---|---|
| Comparison with Poisson distribution Blue bars denote a histogram of data divided into 1 sec bins. Red curve is a Poisson curve with rate = median count rate of data. |
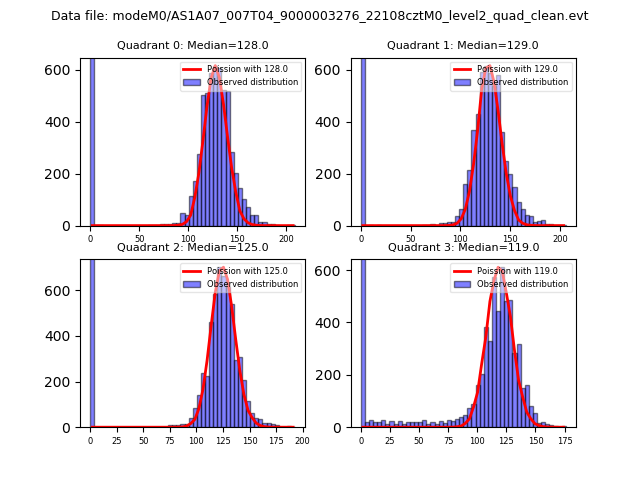 |
 |
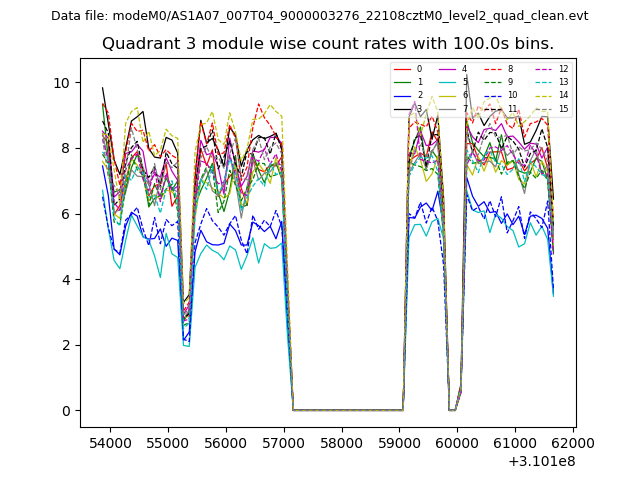
| Quadrant-wise count rates Data is divided into 100 sec bins |
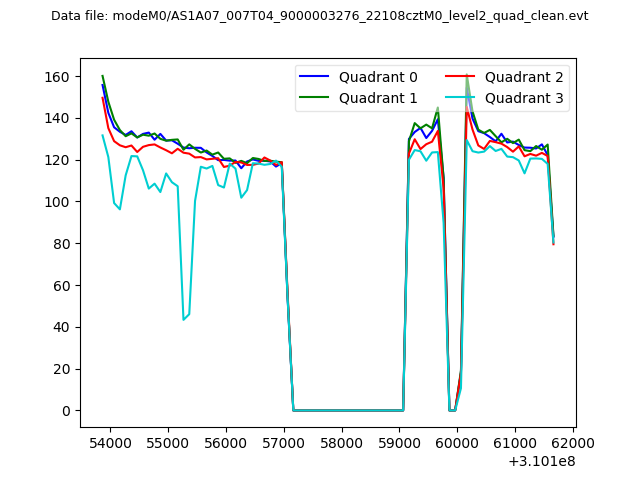 |
|
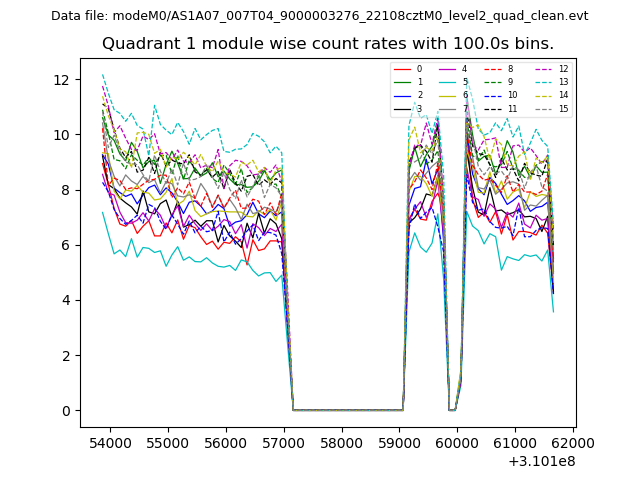
| Module-wise count rates for Quadrant A Data is divided into 100 sec bins |
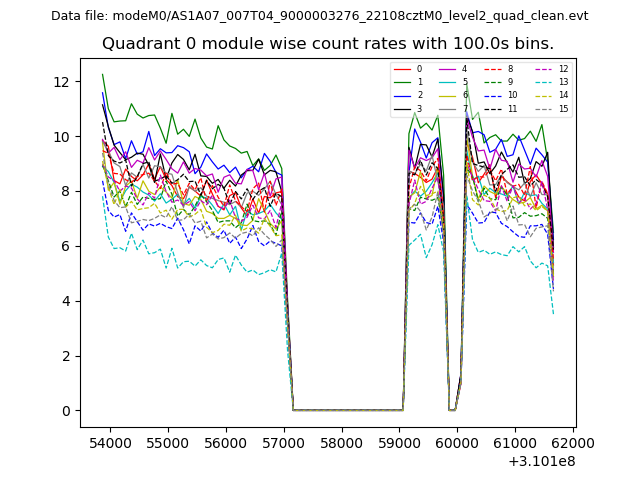 |
 |
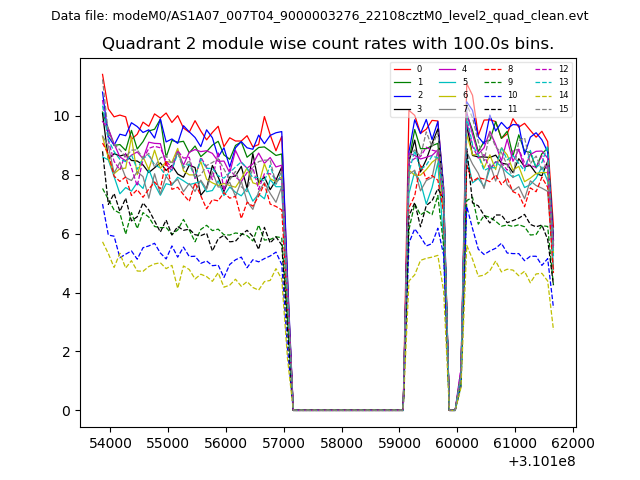
| Module-wise count rates for Quadrant B Data is divided into 100 sec bins |
 |
 |
| Module-wise count rates for Quadrant C Data is divided into 100 sec bins |
 |
 |
| Module-wise count rates for Quadrant D Data is divided into 100 sec bins |
 |
 |
| Parameter | Plot |
|---|---|
| CZT HV Monitor | 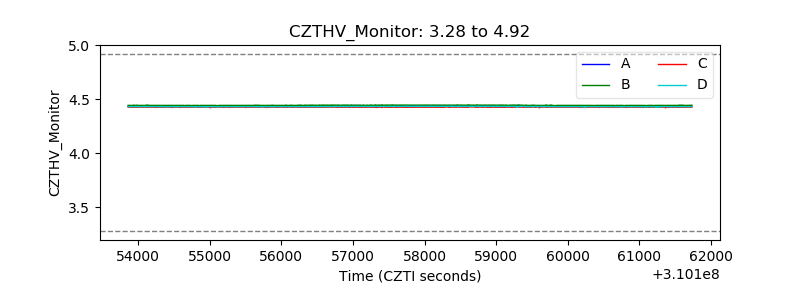 |
| D_VDD | 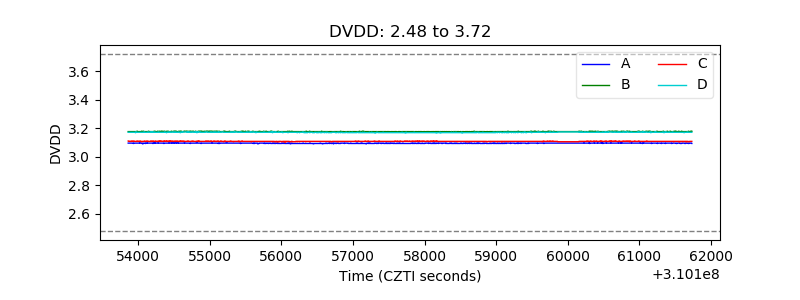 |
| Temperature 1 | 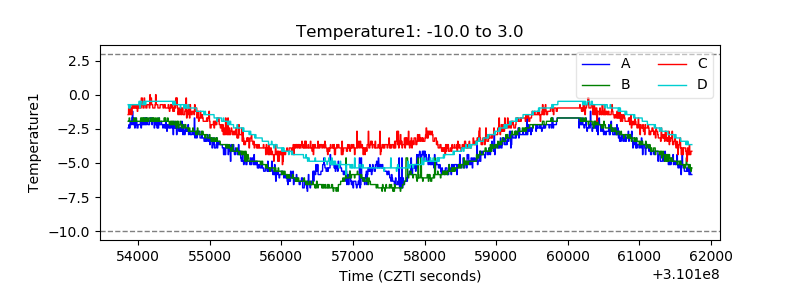 |
| Veto HV Monitor | 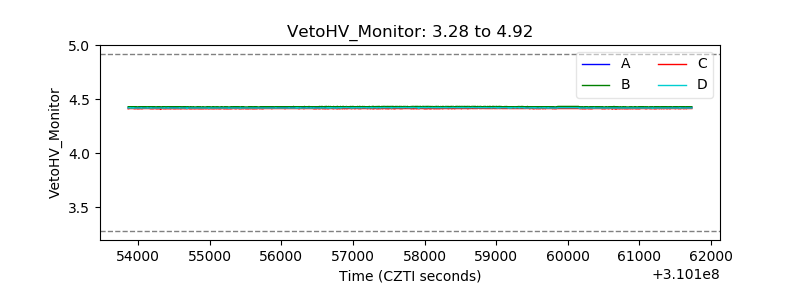 |
| Veto LLD | 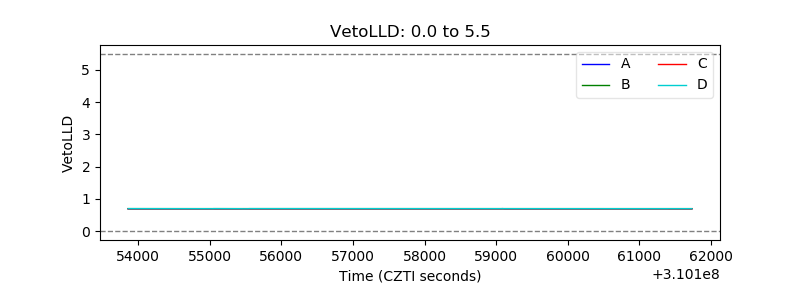 |
| Alpha Counter | 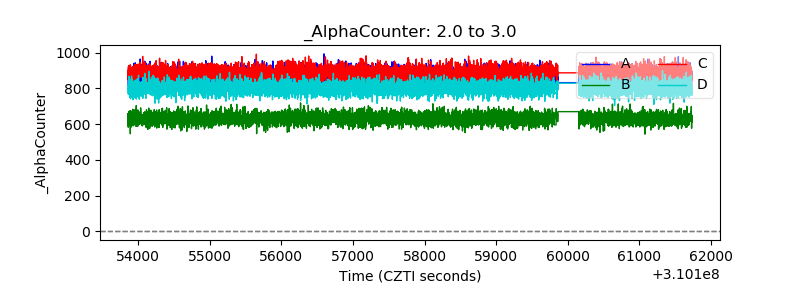 |
| _CPM_Rate | 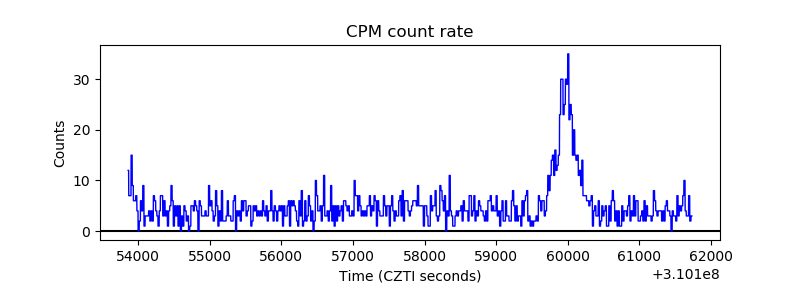 |
| CZT Counter | 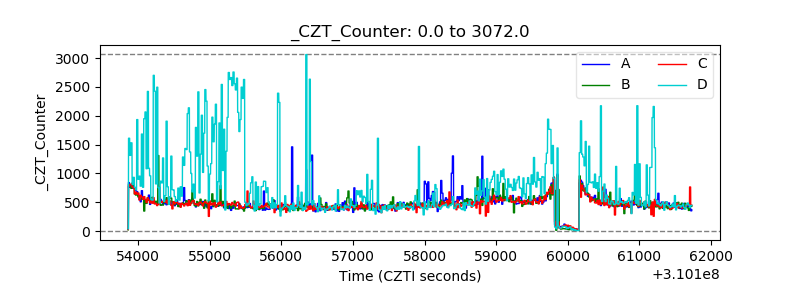 |
| +2.5 Volts monitor |  |
| +5 Volts monitor | 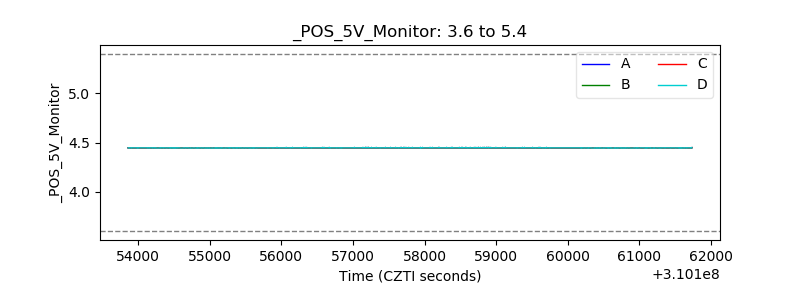 |
| _ROLL_ROT | 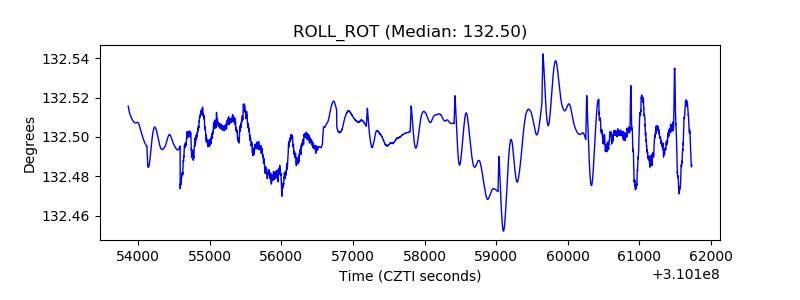 |
| _Roll_DEC | 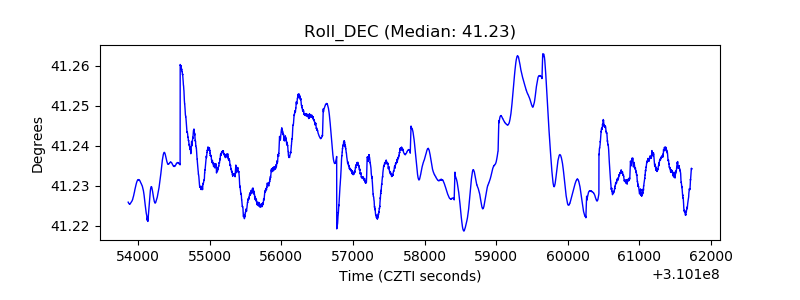 |
| _Roll_RA | 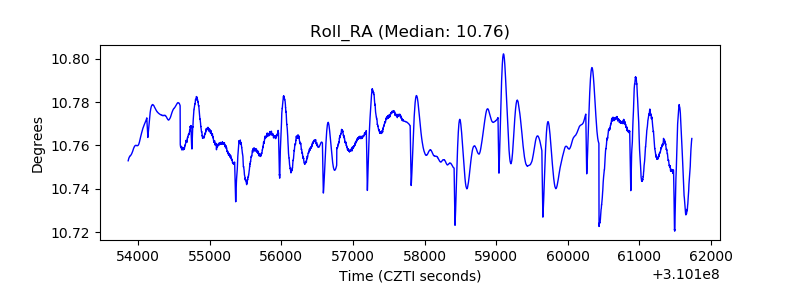 |
| Veto Counter | 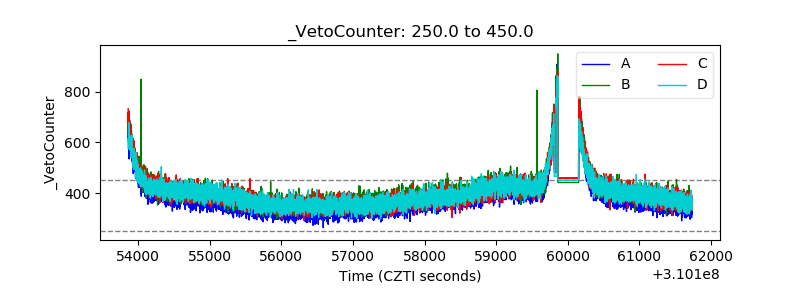 |