| Param | Original file | Final file |
|---|---|---|
| Filename | modeM0/AS1A07_007T04_9000003276_22111cztM0_level2.evt | modeM0/AS1A07_007T04_9000003276_22111cztM0_level2_quad_clean.evt |
| Size (bytes) | 1,338,684,480 | 241,499,520 |
| Size | 1.2 GB | 230.3 MB |
| Events in quadrant A | 8,971,220 | 1,547,506 |
| Events in quadrant B | 8,846,859 | 1,568,629 |
| Events in quadrant C | 8,649,663 | 1,519,739 |
| Events in quadrant D | 12,830,250 | 1,409,751 |
| Mode M9 | |||
|---|---|---|---|
| Quadrant | BADHDUFLAG | Total packets | Discarded packets |
| A | 0 | 22 | 0 |
| B | 0 | 22 | 0 |
| C | 0 | 22 | 0 |
| D | 0 | 22 | 0 |
| Mode M0 | |||
|---|---|---|---|
| Quadrant | BADHDUFLAG | Total packets | Discarded packets |
| A | 0 | 38986 | 4 |
| B | 0 | 38507 | 4 |
| C | 0 | 37903 | 4 |
| D | 0 | 50925 | 4 |
| Mode SS | |||
|---|---|---|---|
| Quadrant | BADHDUFLAG | Total packets | Discarded packets |
| A | 0 | 372 | 0 |
| B | 0 | 372 | 0 |
| C | 0 | 372 | 0 |
| D | 0 | 372 | 0 |
| Quadrant | Total seconds | Saturated seconds | Saturation percentage |
|---|---|---|---|
| A | 18414 | 182 | 0.988378% |
| B | 18414 | 137 | 0.743999% |
| C | 18415 | 163 | 0.885148% |
| D | 18415 | 1280 | 6.950855% |
Noise dominated data is calculated using 1-second bins in cleaned event files. If a bin has >2000 counts, and if more than 50% of those come from <1% of pixels, then it is considered to be noise-dominated and hence unusable.
| Quadrant | # 1 sec bins | Bins with >0 counts | Bins with >2000 counts | High rate bins dominated by noise | Noise dominated (total time) | Noise dominated (detector-on time) | Marked lightcurve |
|---|---|---|---|---|---|---|---|
| A | 20419 | 18417 | 128 | 128 | 0.63% | 0.70% | 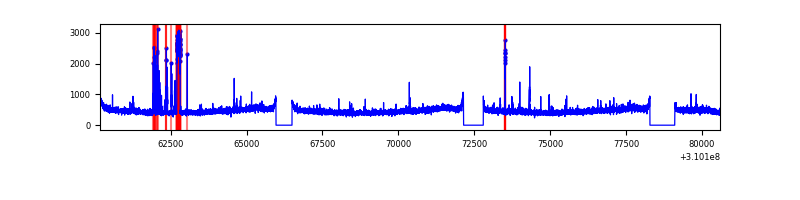 |
| B | 20419 | 18417 | 35 | 35 | 0.17% | 0.19% | 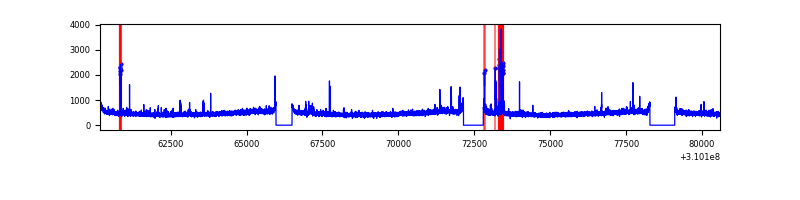 |
| C | 20420 | 18418 | 2 | 2 | 0.01% | 0.01% | 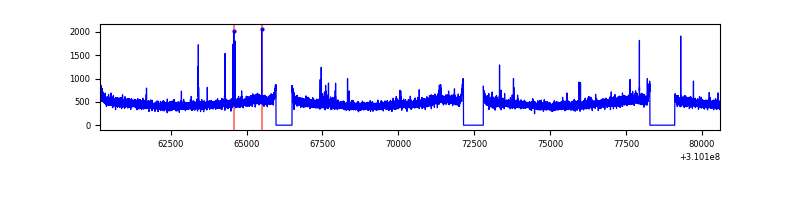 |
| D | 20420 | 18418 | 928 | 928 | 4.54% | 5.04% | 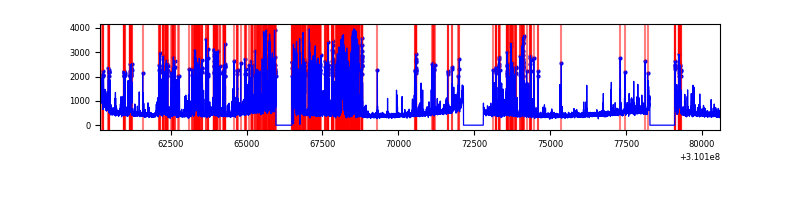 |
Top three noisy pixels from each quadrant. If the there are fewer than three noisy pixels in the level2.evt file, extra rows are filled as -1
| Pixel properties | Quadrant properties | ||||||
|---|---|---|---|---|---|---|---|
| Quadrant | DetID | PixID | Counts | Sigma | Mean | Median | Sigma |
| A | 5 | 16 | 516237 | 1174.58 | 2177 | 2129 | 437.7 |
| A | 15 | 174 | 45694 | 99.53 | 2177 | 2129 | 437.7 |
| A | 13 | 254 | 33300 | 71.22 | 2177 | 2129 | 437.7 |
| B | 3 | 64 | 220601 | 527.13 | 2174 | 2116 | 414.5 |
| B | 12 | 111 | 51210 | 118.45 | 2174 | 2116 | 414.5 |
| B | 11 | 111 | 44687 | 102.71 | 2174 | 2116 | 414.5 |
| C | 14 | 238 | 330761 | 667.84 | 2104 | 2113 | 492.1 |
| C | 10 | 22 | 112843 | 225.01 | 2104 | 2113 | 492.1 |
| C | 13 | 61 | 14781 | 25.74 | 2104 | 2113 | 492.1 |
| D | 1 | 52 | 2521012 | 5036.77 | 2057 | 2000 | 500.1 |
| D | 11 | 176 | 1396735 | 2788.78 | 2057 | 2000 | 500.1 |
| D | 7 | 38 | 226835 | 449.56 | 2057 | 2000 | 500.1 |
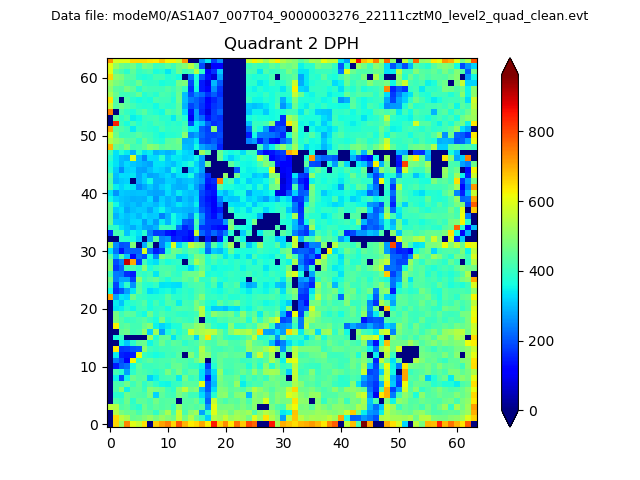
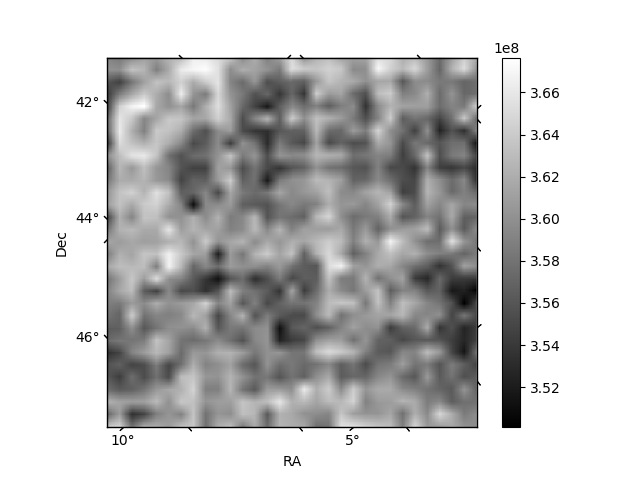
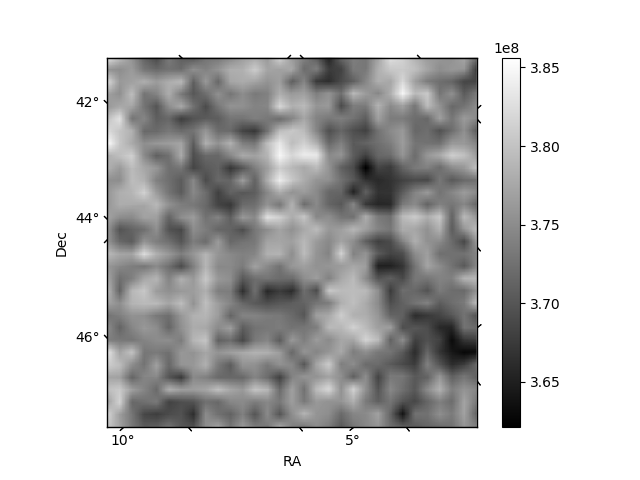
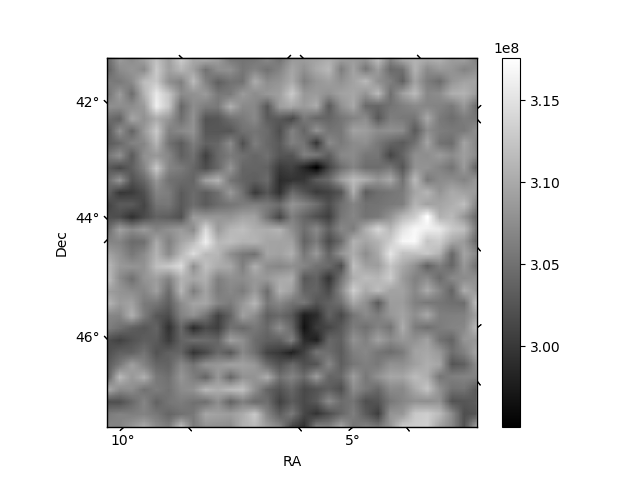
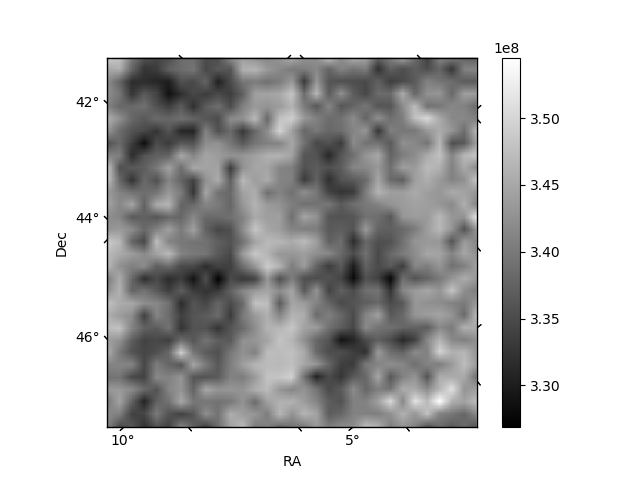
Histogram calculated using DETX and DETY for each event in the final _common_clean file
| Quadrant A | 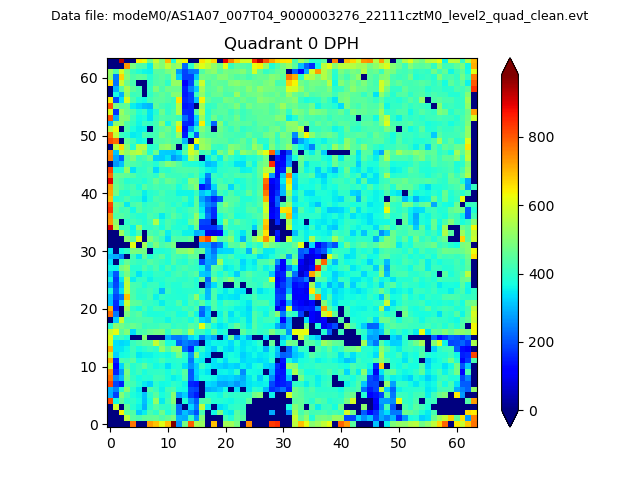 |
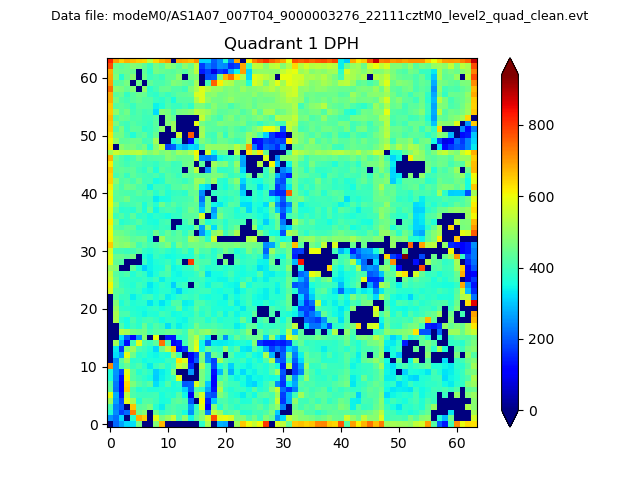 |
Quadrant B |
|---|---|---|---|
| Quadrant D | 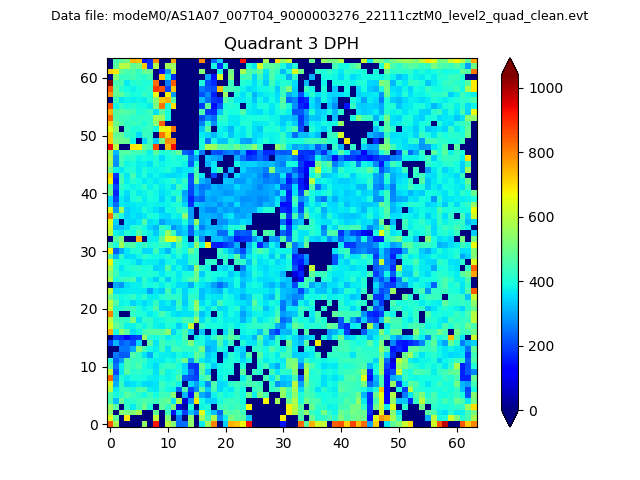 |
 |
Quadrant C |
| Plot type | Count rate plots | Images |
|---|---|---|
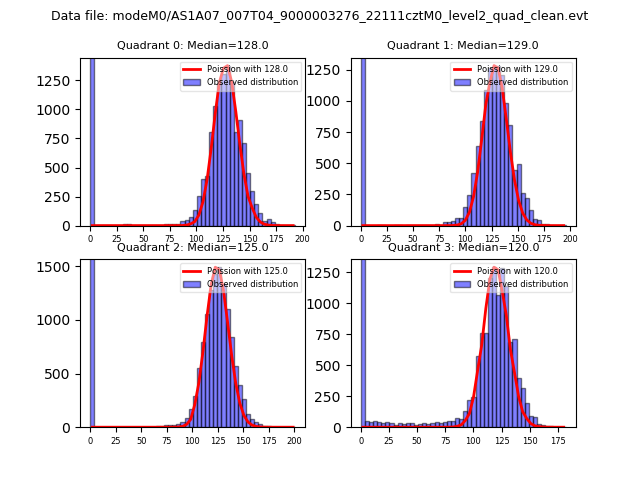
| Comparison with Poisson distribution Blue bars denote a histogram of data divided into 1 sec bins. Red curve is a Poisson curve with rate = median count rate of data. |
 |
 |
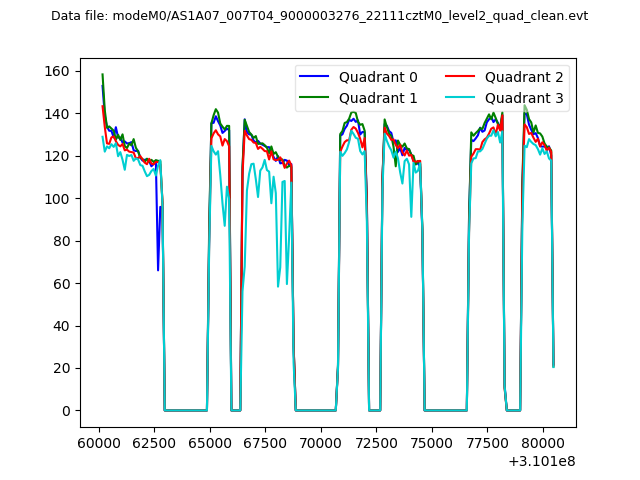
| Quadrant-wise count rates Data is divided into 100 sec bins |
 |
|
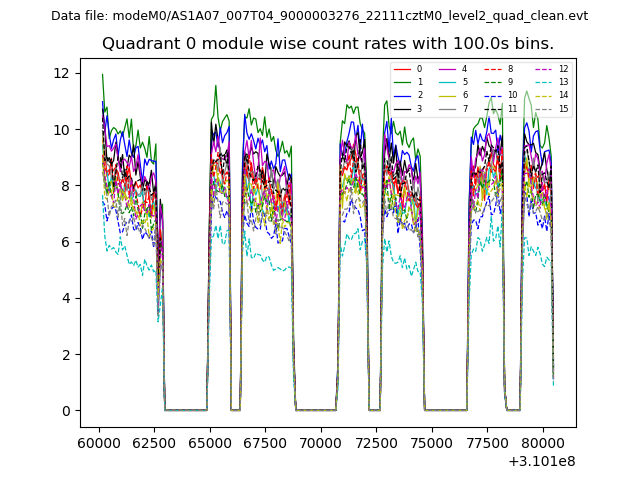
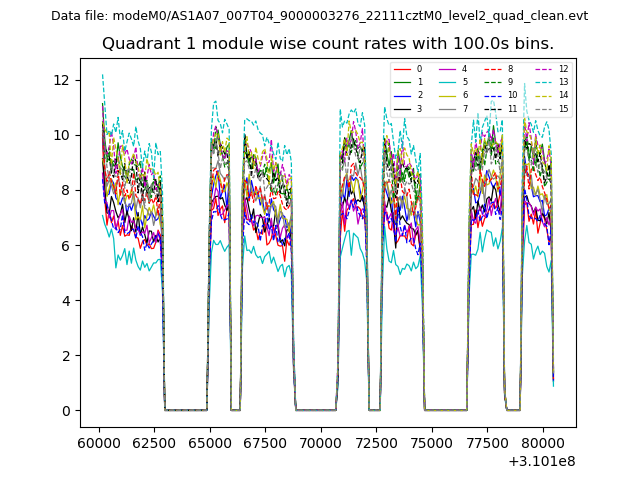
| Module-wise count rates for Quadrant A Data is divided into 100 sec bins |
 |
 |
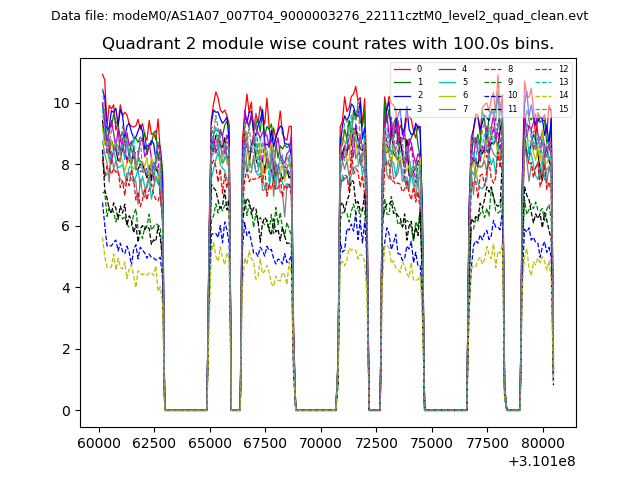
| Module-wise count rates for Quadrant B Data is divided into 100 sec bins |
 |
 |
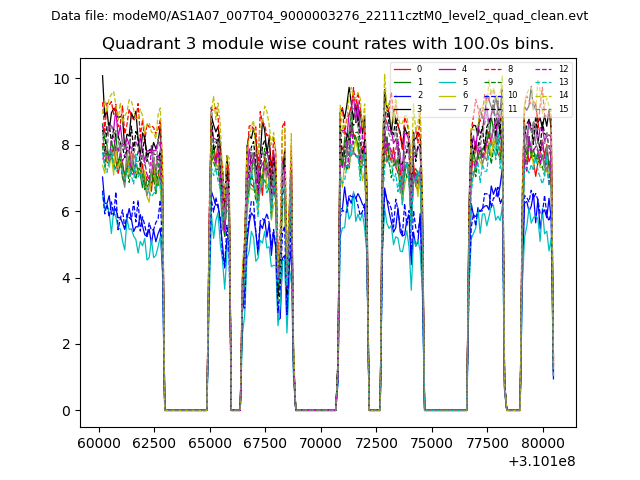
| Module-wise count rates for Quadrant C Data is divided into 100 sec bins |
 |
 |
| Module-wise count rates for Quadrant D Data is divided into 100 sec bins |
 |
 |
| Parameter | Plot |
|---|---|
| CZT HV Monitor | 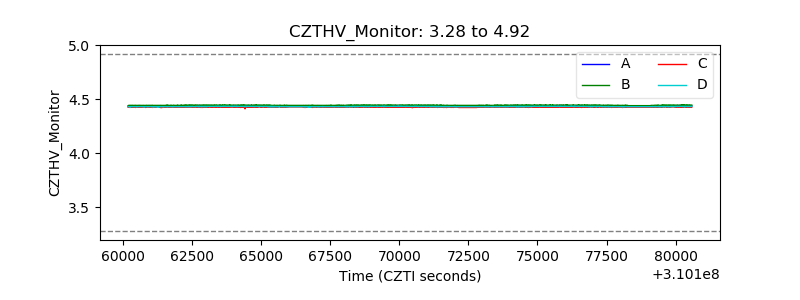 |
| D_VDD | 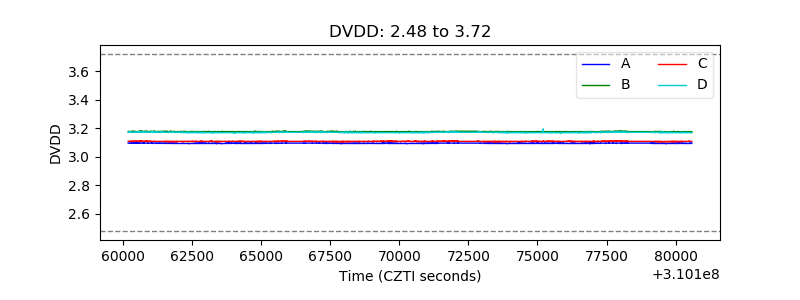 |
| Temperature 1 | 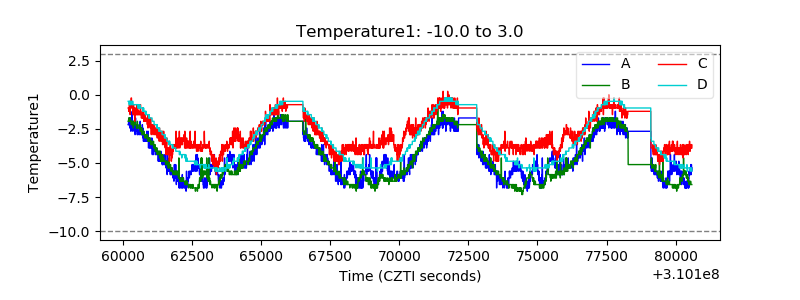 |
| Veto HV Monitor | 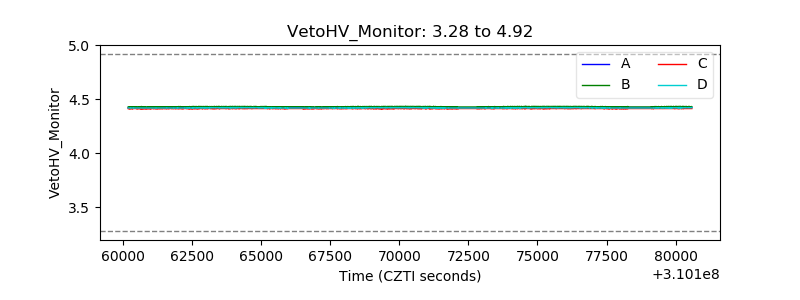 |
| Veto LLD | 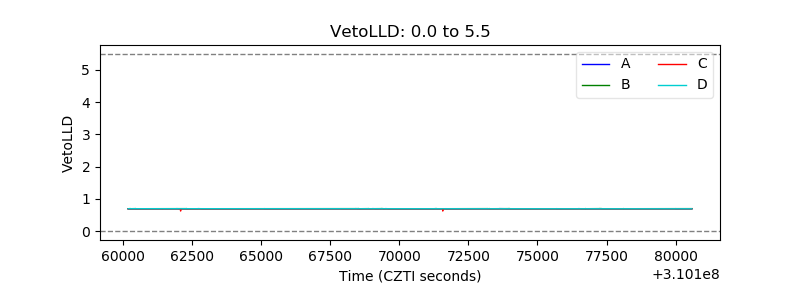 |
| Alpha Counter | 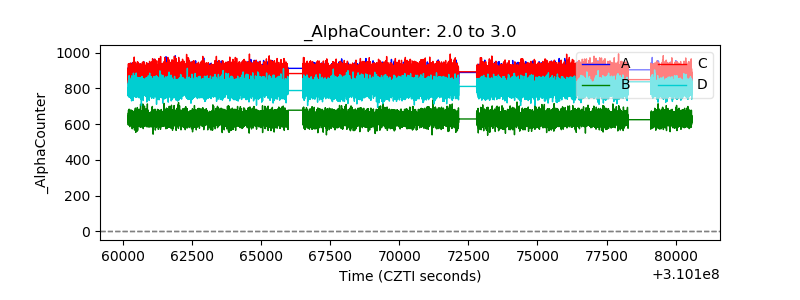 |
| _CPM_Rate | 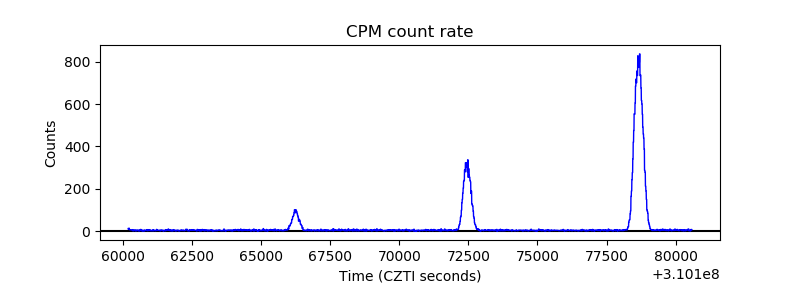 |
| CZT Counter | 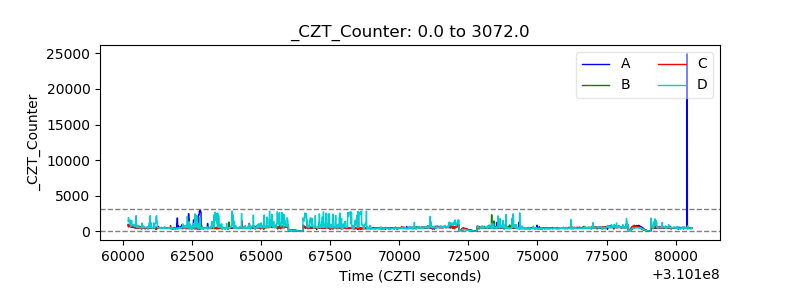 |
| +2.5 Volts monitor | 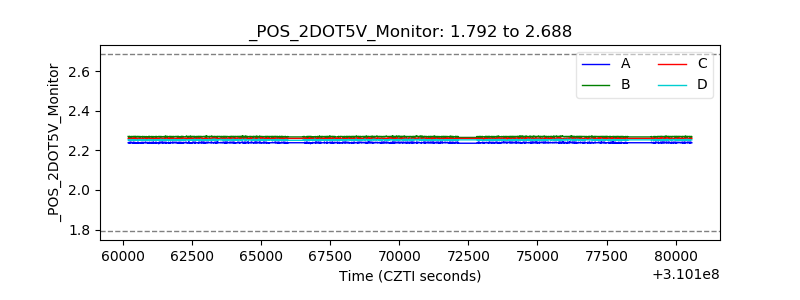 |
| +5 Volts monitor |  |
| _ROLL_ROT | 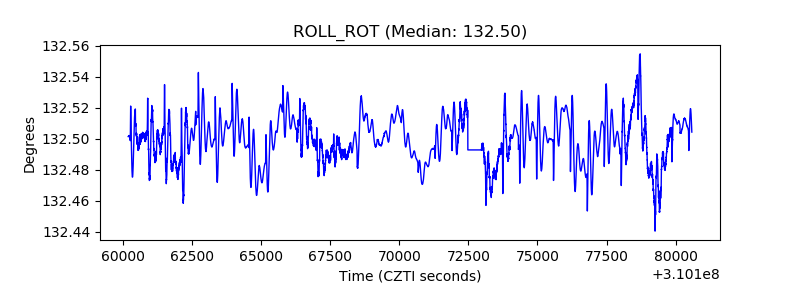 |
| _Roll_DEC | 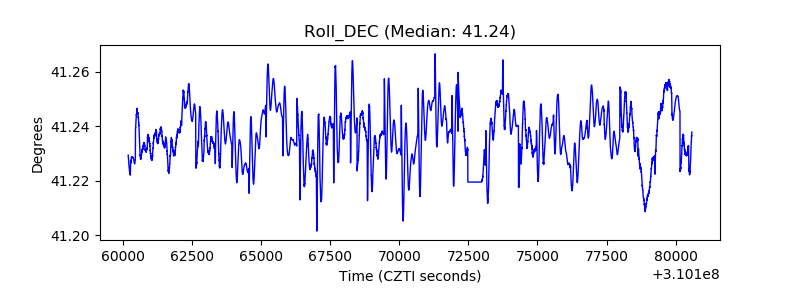 |
| _Roll_RA | 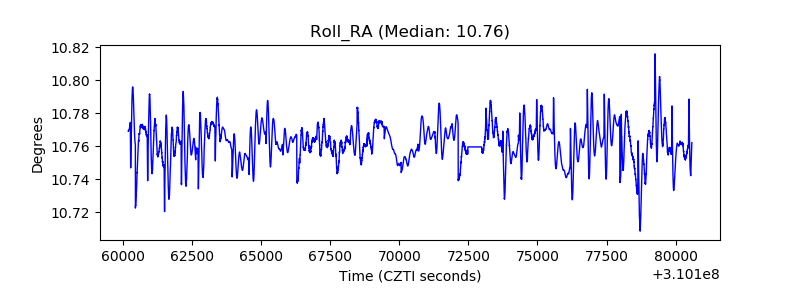 |
| Veto Counter | 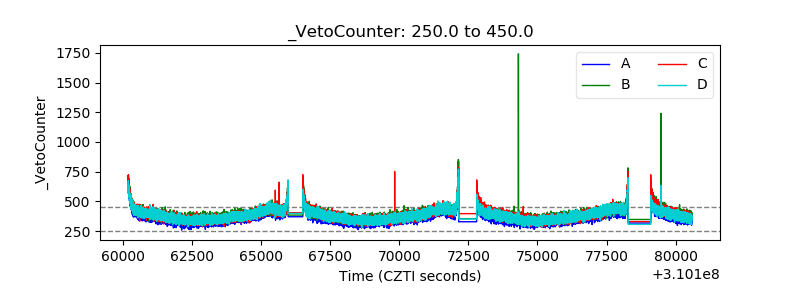 |