| Param | Original file | Final file |
|---|---|---|
| Filename | modeM0/AS1A07_007T04_9000003276_22125cztM0_level2.evt | modeM0/AS1A07_007T04_9000003276_22125cztM0_level2_quad_clean.evt |
| Size (bytes) | 878,497,920 | 172,200,960 |
| Size | 837.8 MB | 164.2 MB |
| Events in quadrant A | 5,816,918 | 1,106,995 |
| Events in quadrant B | 6,195,050 | 1,110,264 |
| Events in quadrant C | 5,923,917 | 1,076,342 |
| Events in quadrant D | 7,806,298 | 1,040,737 |
| Mode M9 | |||
|---|---|---|---|
| Quadrant | BADHDUFLAG | Total packets | Discarded packets |
| A | 0 | 14 | 0 |
| B | 0 | 14 | 0 |
| C | 0 | 14 | 0 |
| D | 0 | 14 | 0 |
| Mode M0 | |||
|---|---|---|---|
| Quadrant | BADHDUFLAG | Total packets | Discarded packets |
| A | 0 | 26043 | 6 |
| B | 0 | 26931 | 3 |
| C | 0 | 26058 | 3 |
| D | 0 | 32167 | 3 |
| Mode SS | |||
|---|---|---|---|
| Quadrant | BADHDUFLAG | Total packets | Discarded packets |
| A | 0 | 258 | 0 |
| B | 0 | 258 | 0 |
| C | 0 | 258 | 0 |
| D | 0 | 258 | 0 |
| Quadrant | Total seconds | Saturated seconds | Saturation percentage |
|---|---|---|---|
| A | 12748 | 47 | 0.368685% |
| B | 12750 | 114 | 0.894118% |
| C | 12749 | 93 | 0.729469% |
| D | 12750 | 516 | 4.047059% |
Noise dominated data is calculated using 1-second bins in cleaned event files. If a bin has >2000 counts, and if more than 50% of those come from <1% of pixels, then it is considered to be noise-dominated and hence unusable.
| Quadrant | # 1 sec bins | Bins with >0 counts | Bins with >2000 counts | High rate bins dominated by noise | Noise dominated (total time) | Noise dominated (detector-on time) | Marked lightcurve |
|---|---|---|---|---|---|---|---|
| A | 14109 | 12751 | 0 | 0 | 0.00% | 0.00% | 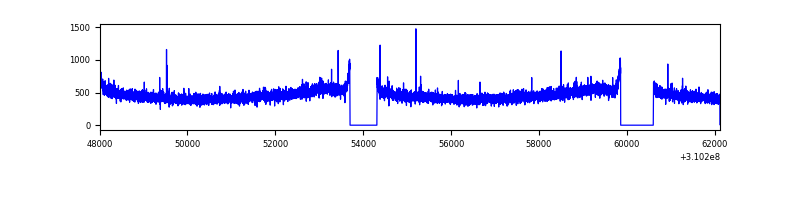 |
| B | 14110 | 12752 | 42 | 42 | 0.30% | 0.33% | 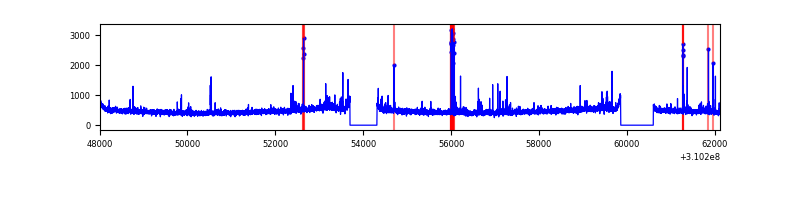 |
| C | 14110 | 12752 | 0 | 0 | 0.00% | 0.00% | 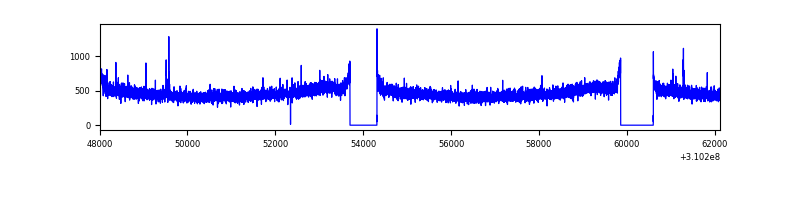 |
| D | 14110 | 12752 | 468 | 468 | 3.32% | 3.67% | 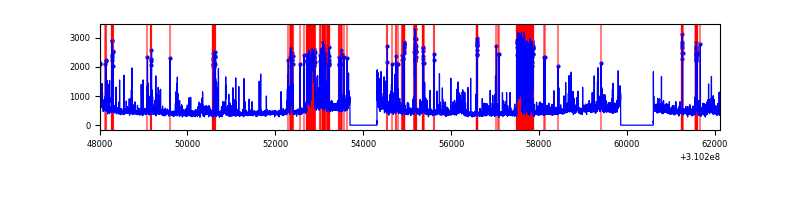 |
Top three noisy pixels from each quadrant. If the there are fewer than three noisy pixels in the level2.evt file, extra rows are filled as -1
| Pixel properties | Quadrant properties | ||||||
|---|---|---|---|---|---|---|---|
| Quadrant | DetID | PixID | Counts | Sigma | Mean | Median | Sigma |
| A | 13 | 254 | 24968 | 77.74 | 1504 | 1469 | 302.3 |
| A | 3 | 137 | 13142 | 38.62 | 1504 | 1469 | 302.3 |
| A | 0 | 226 | 12945 | 37.97 | 1504 | 1469 | 302.3 |
| B | 3 | 64 | 224458 | 784.75 | 1496 | 1458 | 284.2 |
| B | 0 | 190 | 46639 | 158.99 | 1496 | 1458 | 284.2 |
| B | 12 | 111 | 34694 | 116.96 | 1496 | 1458 | 284.2 |
| C | 14 | 238 | 226213 | 657.4 | 1453 | 1461 | 341.9 |
| C | 10 | 22 | 27961 | 77.51 | 1453 | 1461 | 341.9 |
| C | 13 | 61 | 10083 | 25.22 | 1453 | 1461 | 341.9 |
| D | 1 | 52 | 1187366 | 3413.49 | 1439 | 1399 | 347.4 |
| D | 5 | 222 | 566633 | 1626.87 | 1439 | 1399 | 347.4 |
| D | 11 | 176 | 238732 | 683.1 | 1439 | 1399 | 347.4 |
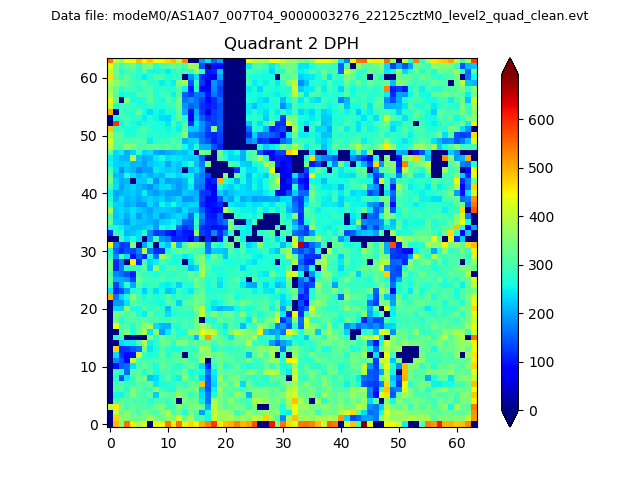
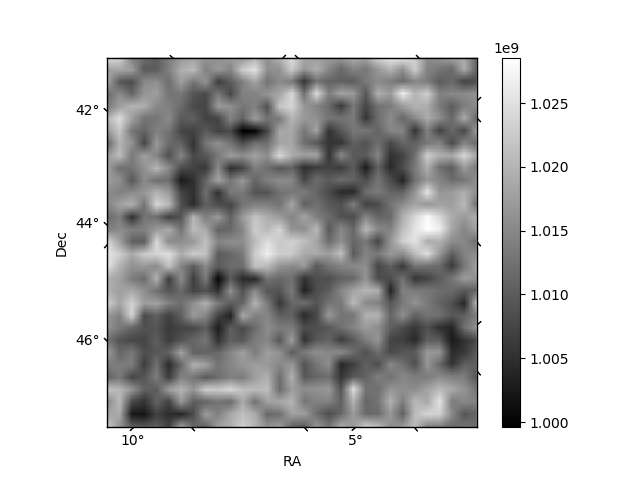
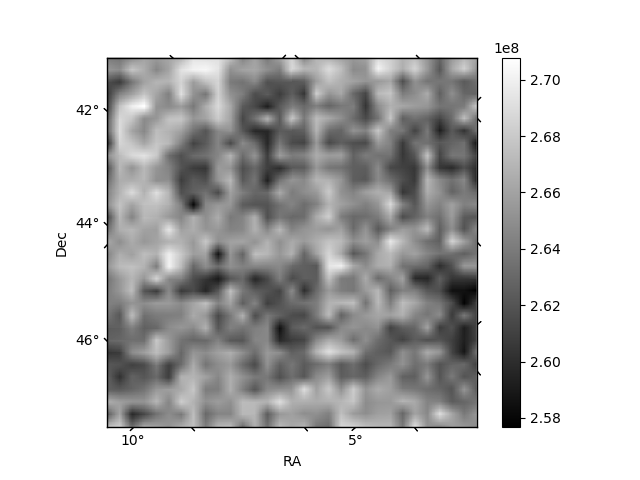
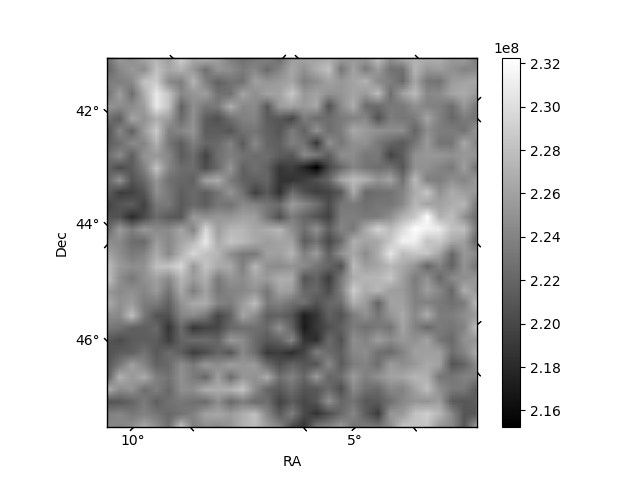
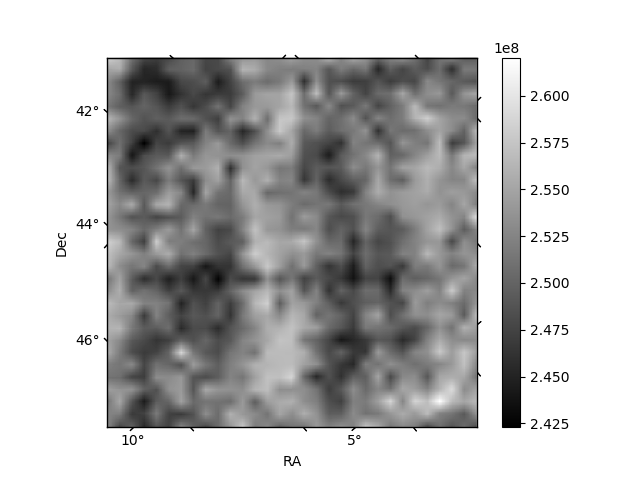
Histogram calculated using DETX and DETY for each event in the final _common_clean file
| Quadrant A | 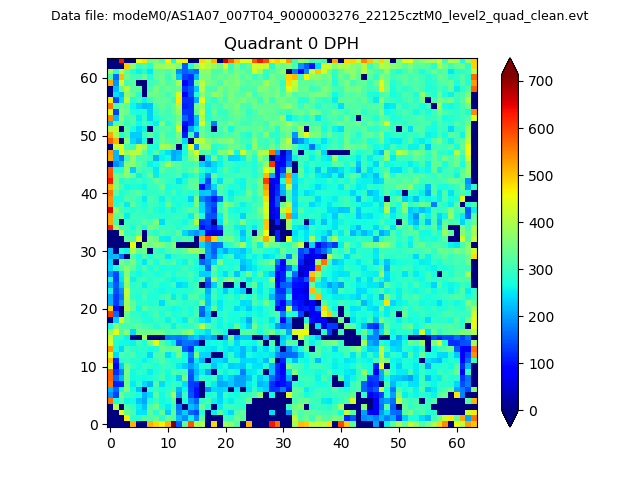 |
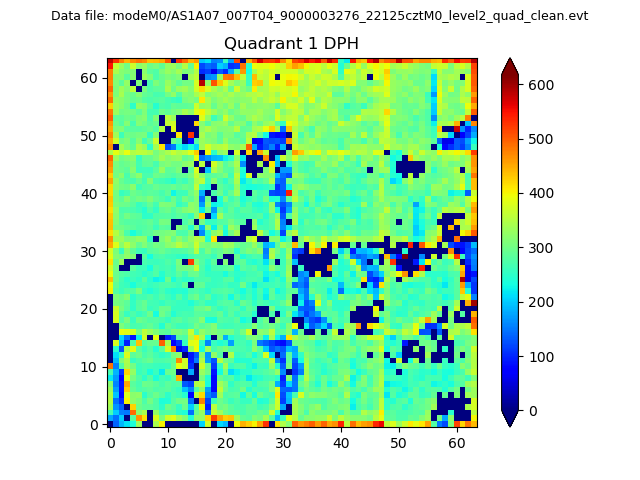 |
Quadrant B |
|---|---|---|---|
| Quadrant D | 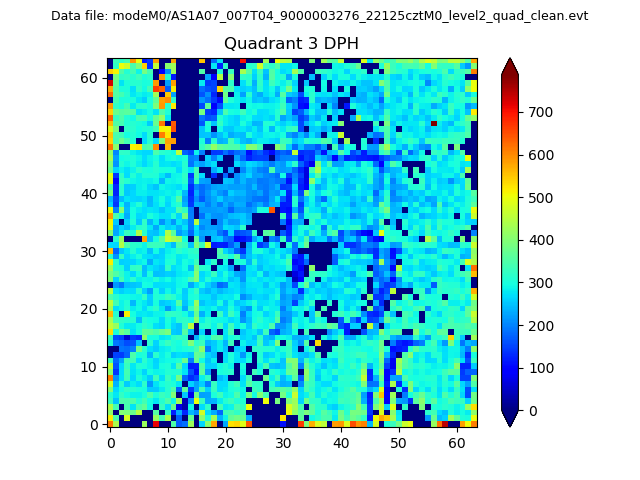 |
 |
Quadrant C |
| Plot type | Count rate plots | Images |
|---|---|---|
| Comparison with Poisson distribution Blue bars denote a histogram of data divided into 1 sec bins. Red curve is a Poisson curve with rate = median count rate of data. |
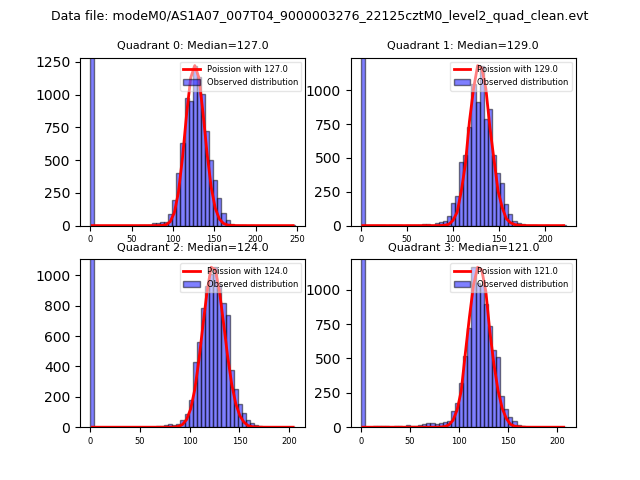 |
 |
| Quadrant-wise count rates Data is divided into 100 sec bins |
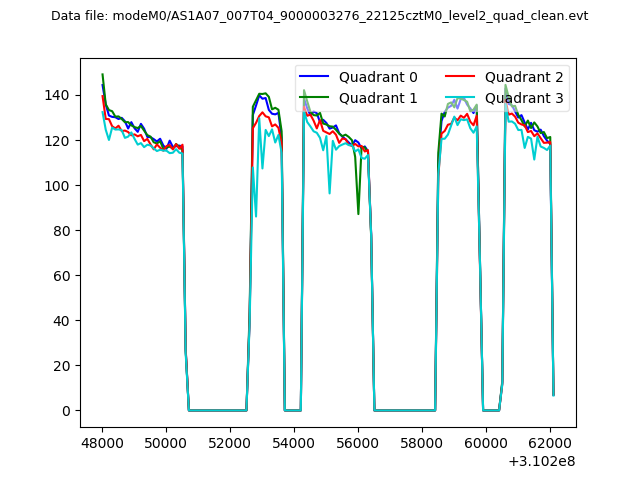 |
|
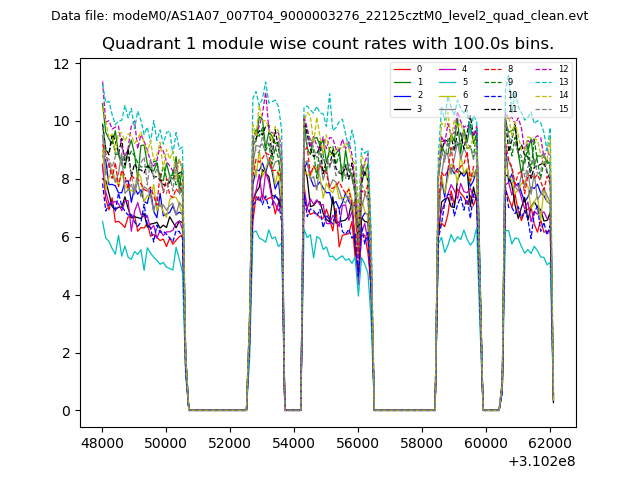
| Module-wise count rates for Quadrant A Data is divided into 100 sec bins |
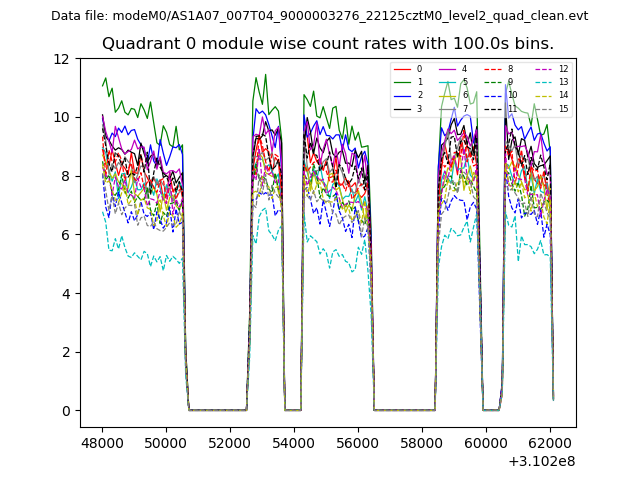 |
 |
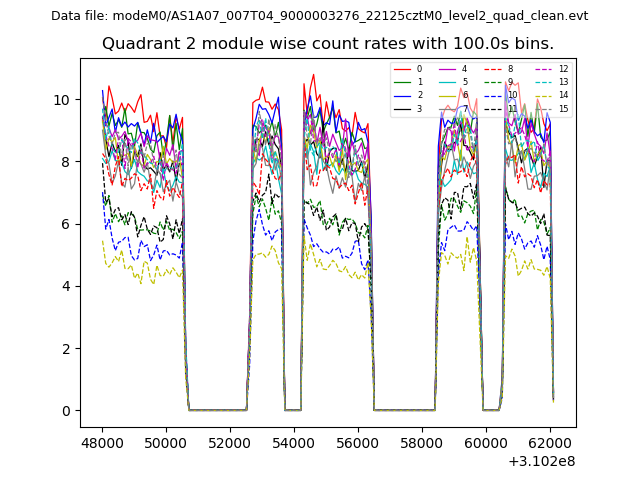
| Module-wise count rates for Quadrant B Data is divided into 100 sec bins |
 |
 |
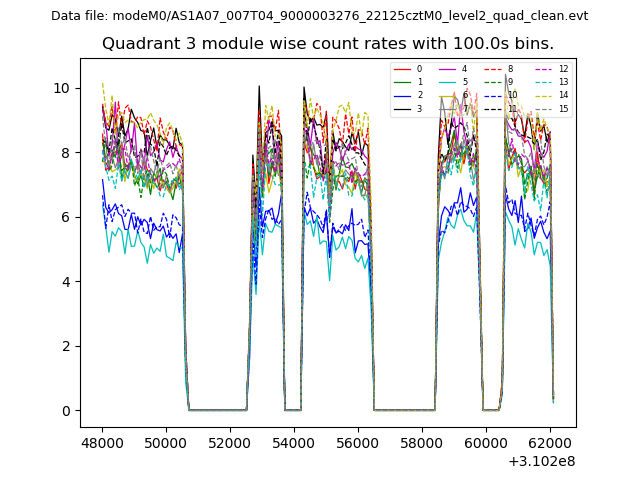
| Module-wise count rates for Quadrant C Data is divided into 100 sec bins |
 |
 |
| Module-wise count rates for Quadrant D Data is divided into 100 sec bins |
 |
 |
| Parameter | Plot |
|---|---|
| CZT HV Monitor | 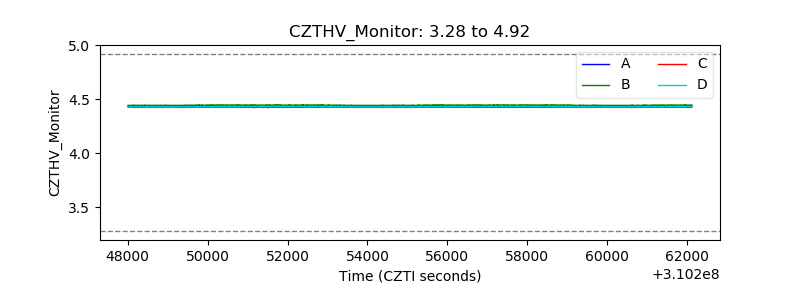 |
| D_VDD | 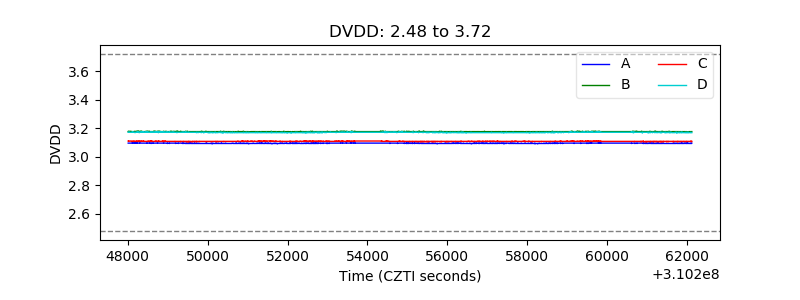 |
| Temperature 1 |  |
| Veto HV Monitor | 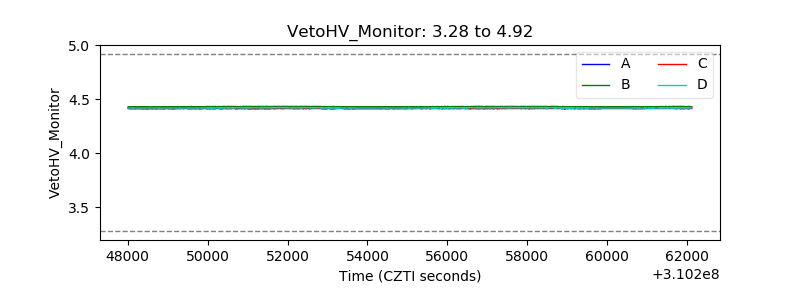 |
| Veto LLD |  |
| Alpha Counter | 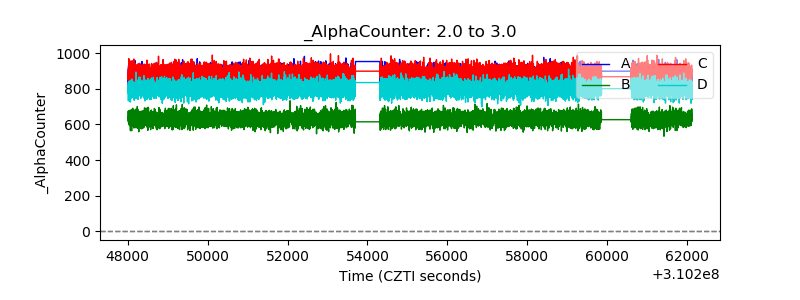 |
| _CPM_Rate | 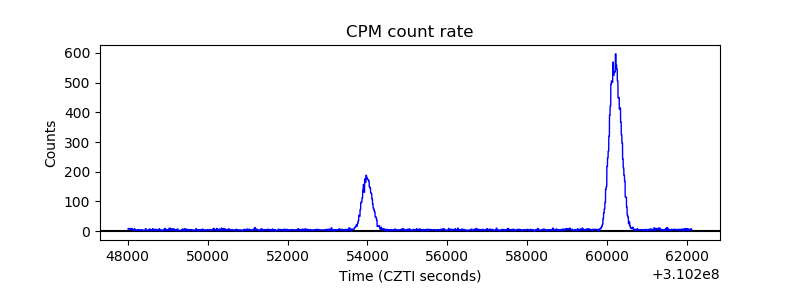 |
| CZT Counter | 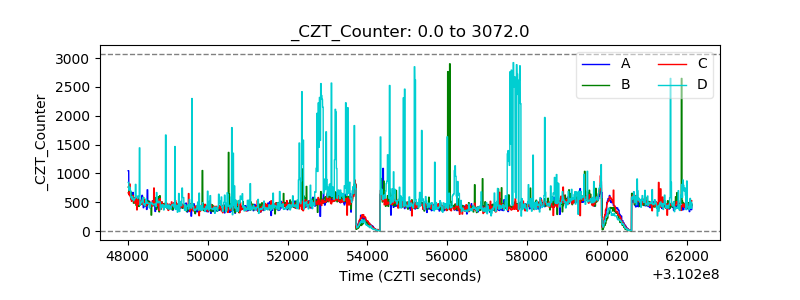 |
| +2.5 Volts monitor |  |
| +5 Volts monitor |  |
| _ROLL_ROT | 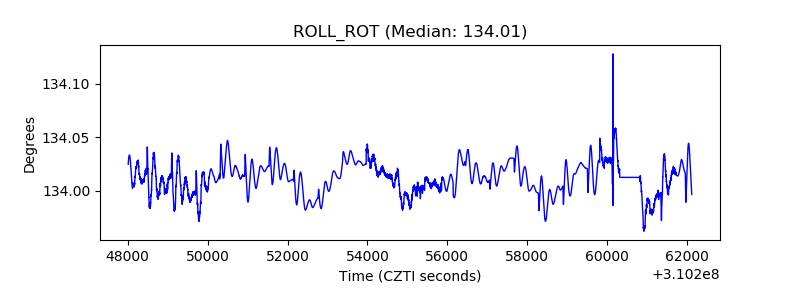 |
| _Roll_DEC |  |
| _Roll_RA | 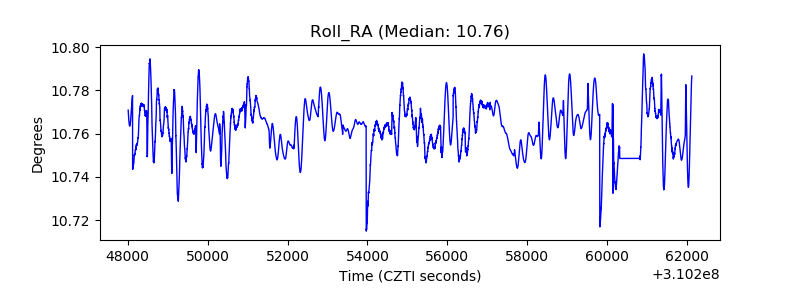 |
| Veto Counter |  |