| Param | Original file | Final file |
|---|---|---|
| Filename | modeM0/AS1A07_007T04_9000003272_22111cztM0_level2.evt | modeM0/AS1A07_007T04_9000003272_22111cztM0_level2_quad_clean.evt |
| Size (bytes) | 261,126,720 | 59,592,960 |
| Size | 249.0 MB | 56.8 MB |
| Events in quadrant A | 1,859,828 | 391,208 |
| Events in quadrant B | 1,867,981 | 397,768 |
| Events in quadrant C | 1,854,597 | 379,860 |
| Events in quadrant D | 2,068,126 | 369,164 |
| Mode M9 | |||
|---|---|---|---|
| Quadrant | BADHDUFLAG | Total packets | Discarded packets |
| A | 0 | 9 | 0 |
| B | 0 | 9 | 0 |
| C | 0 | 9 | 0 |
| D | 0 | 9 | 0 |
| Mode SS | |||
|---|---|---|---|
| Quadrant | BADHDUFLAG | Total packets | Discarded packets |
| A | 0 | 76 | 0 |
| B | 0 | 76 | 0 |
| C | 0 | 76 | 0 |
| D | 0 | 76 | 0 |
| Mode M0 | |||
|---|---|---|---|
| Quadrant | BADHDUFLAG | Total packets | Discarded packets |
| A | 0 | 7774 | 1 |
| B | 0 | 7817 | 1 |
| C | 0 | 7799 | 1 |
| D | 0 | 8614 | 1 |
| Quadrant | Total seconds | Saturated seconds | Saturation percentage |
|---|---|---|---|
| A | 3773 | 16 | 0.424066% |
| B | 3773 | 27 | 0.715611% |
| C | 3773 | 50 | 1.325205% |
| D | 3773 | 55 | 1.457726% |
Noise dominated data is calculated using 1-second bins in cleaned event files. If a bin has >2000 counts, and if more than 50% of those come from <1% of pixels, then it is considered to be noise-dominated and hence unusable.
| Quadrant | # 1 sec bins | Bins with >0 counts | Bins with >2000 counts | High rate bins dominated by noise | Noise dominated (total time) | Noise dominated (detector-on time) | Marked lightcurve |
|---|---|---|---|---|---|---|---|
| A | 4593 | 3774 | 0 | 0 | 0.00% | 0.00% | 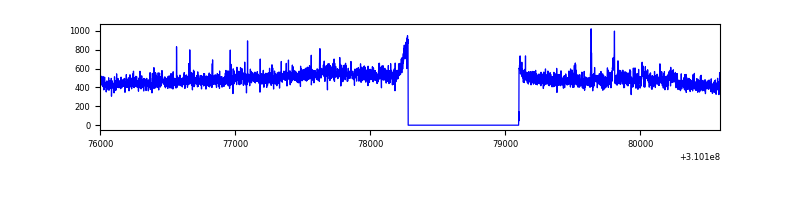 |
| B | 4593 | 3774 | 0 | 0 | 0.00% | 0.00% | 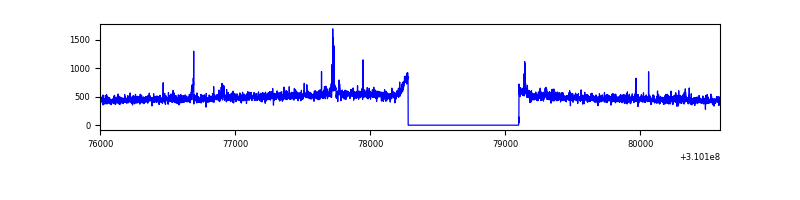 |
| C | 4593 | 3774 | 0 | 0 | 0.00% | 0.00% | 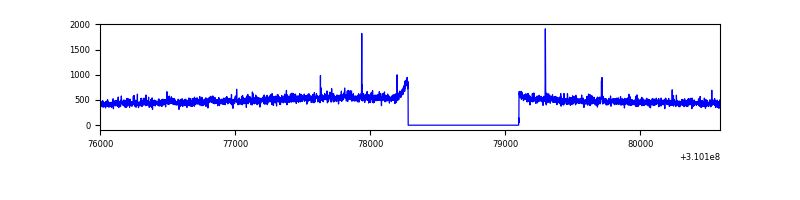 |
| D | 4593 | 3774 | 23 | 23 | 0.50% | 0.61% |  |
Top three noisy pixels from each quadrant. If the there are fewer than three noisy pixels in the level2.evt file, extra rows are filled as -1
| Pixel properties | Quadrant properties | ||||||
|---|---|---|---|---|---|---|---|
| Quadrant | DetID | PixID | Counts | Sigma | Mean | Median | Sigma |
| A | 15 | 174 | 31937 | 325.66 | 470 | 460 | 96.7 |
| A | 5 | 16 | 13252 | 132.35 | 470 | 460 | 96.7 |
| A | 13 | 254 | 6748 | 65.06 | 470 | 460 | 96.7 |
| B | 0 | 190 | 13633 | 143.99 | 467 | 454 | 91.5 |
| B | 12 | 111 | 11056 | 115.83 | 467 | 454 | 91.5 |
| B | 3 | 64 | 11007 | 115.3 | 467 | 454 | 91.5 |
| C | 14 | 238 | 70135 | 649.76 | 451 | 454 | 107.2 |
| C | 10 | 22 | 19176 | 174.58 | 451 | 454 | 107.2 |
| C | 8 | 222 | 3366 | 27.15 | 451 | 454 | 107.2 |
| D | 2 | 133 | 104259 | 925.78 | 455 | 441 | 112.1 |
| D | 2 | 136 | 71207 | 631.04 | 455 | 441 | 112.1 |
| D | 13 | 172 | 45827 | 404.72 | 455 | 441 | 112.1 |
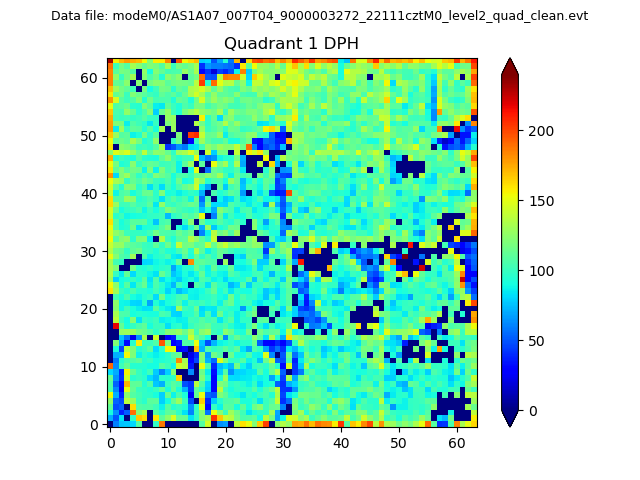
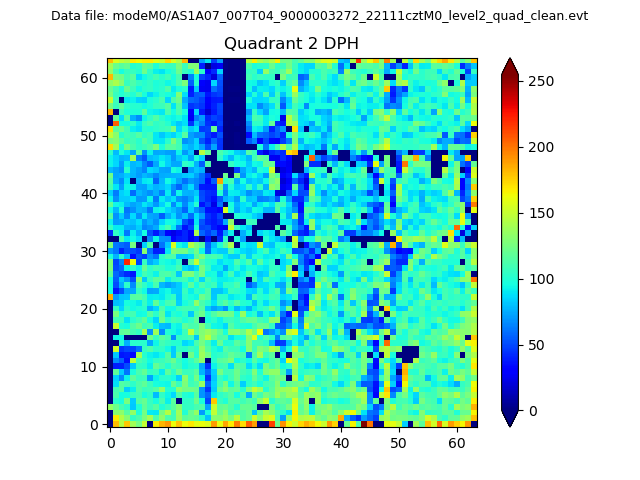
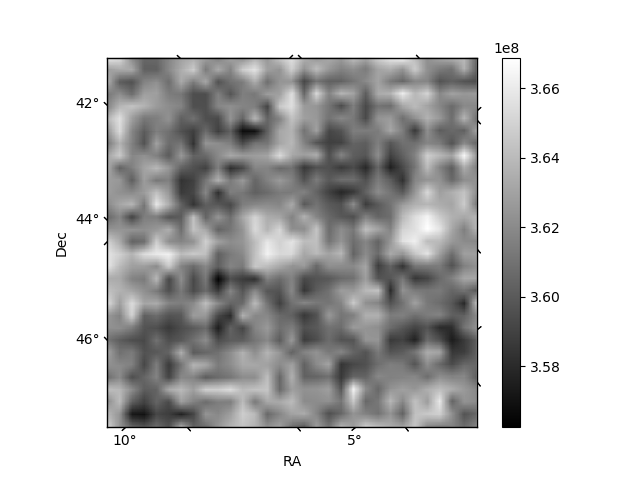
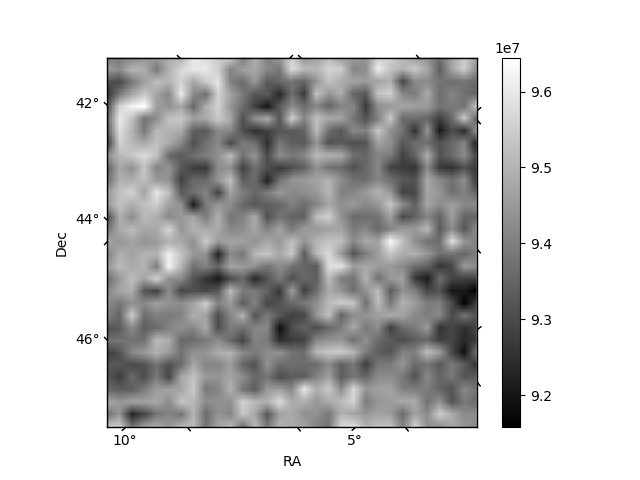
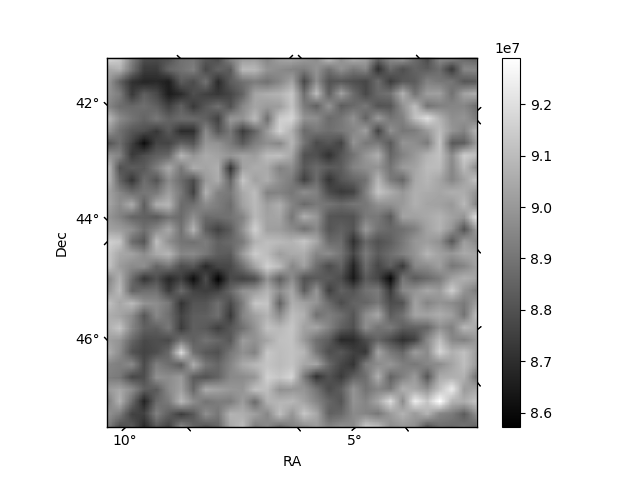
Histogram calculated using DETX and DETY for each event in the final _common_clean file
| Quadrant A | 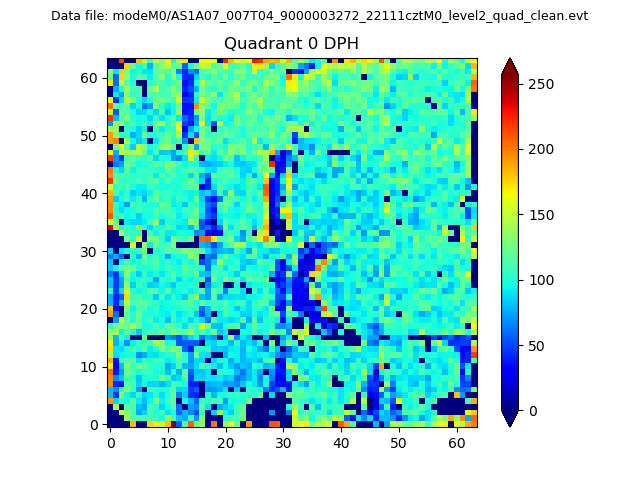 |
 |
Quadrant B |
|---|---|---|---|
| Quadrant D | 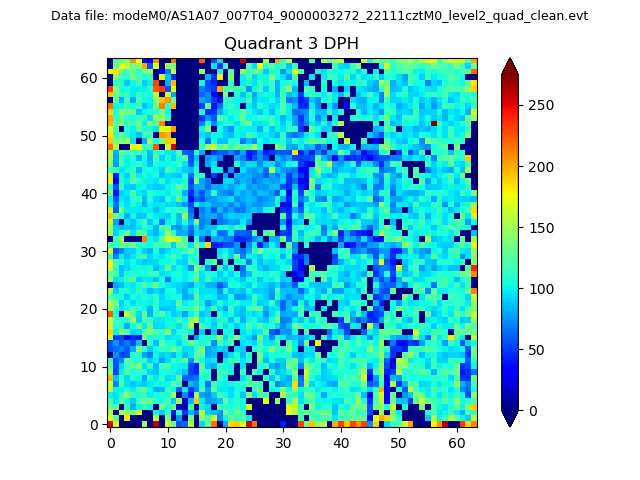 |
 |
Quadrant C |
| Plot type | Count rate plots | Images |
|---|---|---|
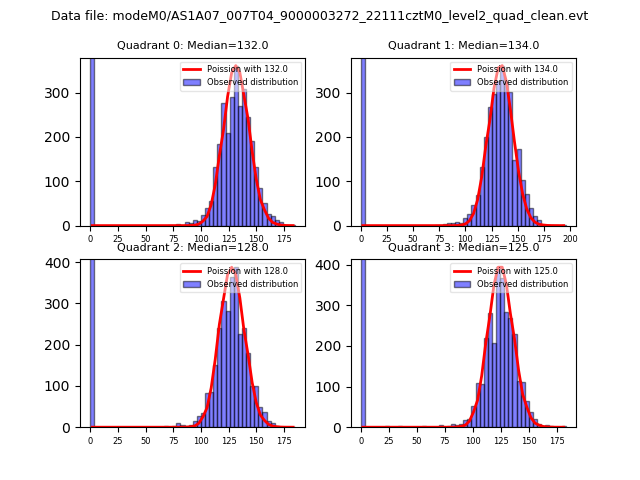
| Comparison with Poisson distribution Blue bars denote a histogram of data divided into 1 sec bins. Red curve is a Poisson curve with rate = median count rate of data. |
 |
 |
| Quadrant-wise count rates Data is divided into 100 sec bins |
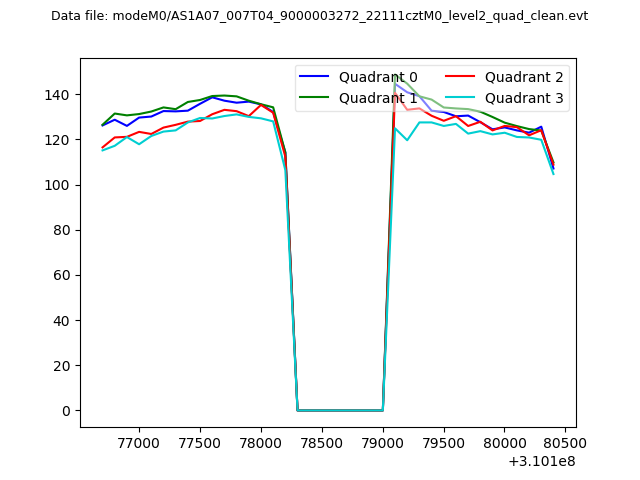 |
|
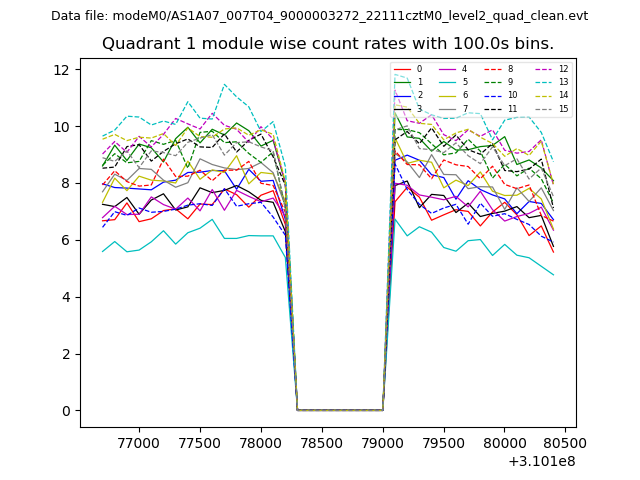
| Module-wise count rates for Quadrant A Data is divided into 100 sec bins |
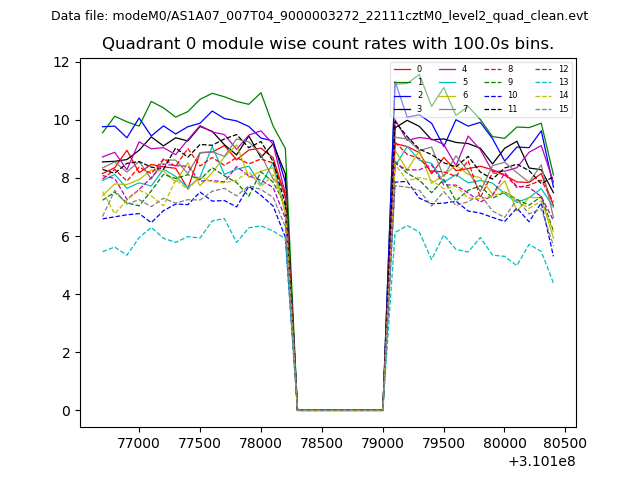 |
 |
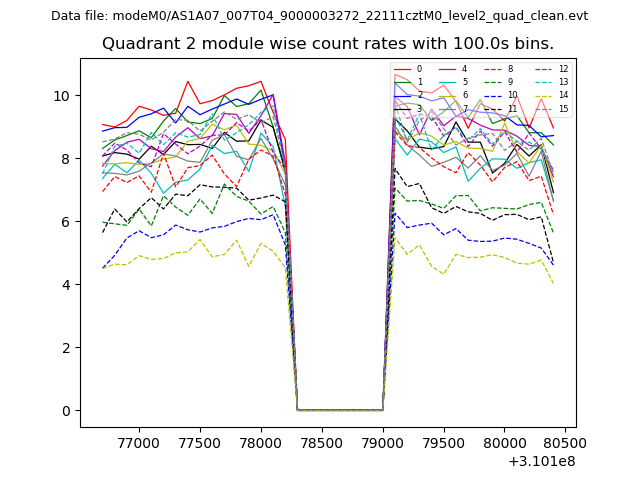
| Module-wise count rates for Quadrant B Data is divided into 100 sec bins |
 |
 |
| Module-wise count rates for Quadrant C Data is divided into 100 sec bins |
 |
 |
| Module-wise count rates for Quadrant D Data is divided into 100 sec bins |
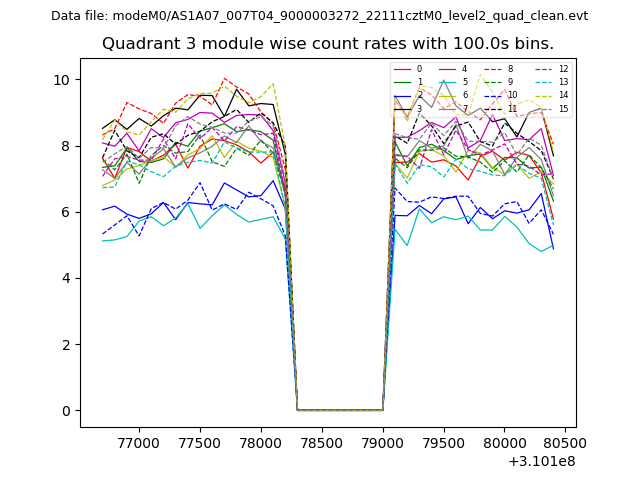 |
 |
| Parameter | Plot |
|---|---|
| CZT HV Monitor | 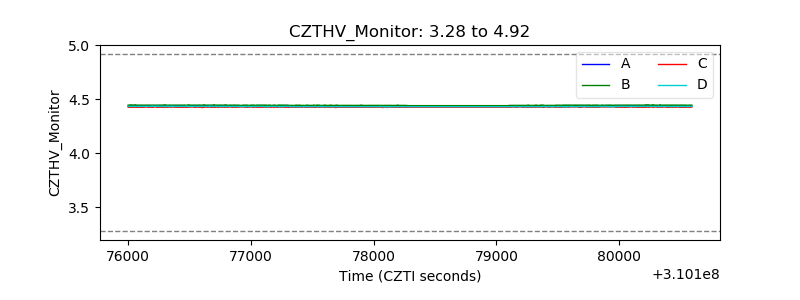 |
| D_VDD |  |
| Temperature 1 | 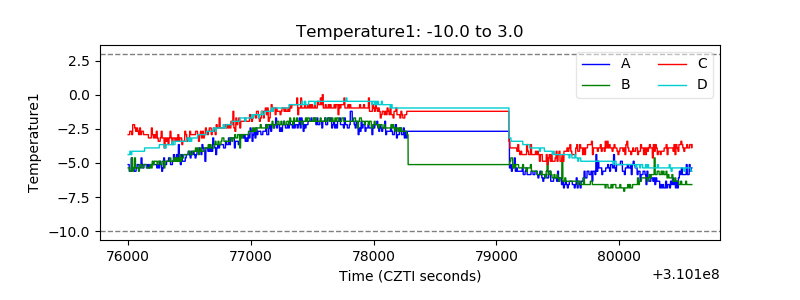 |
| Veto HV Monitor | 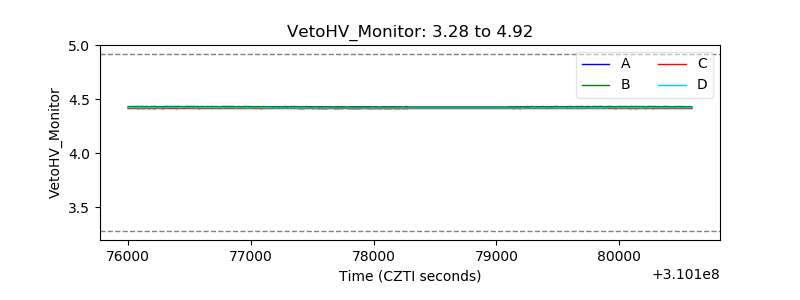 |
| Veto LLD | 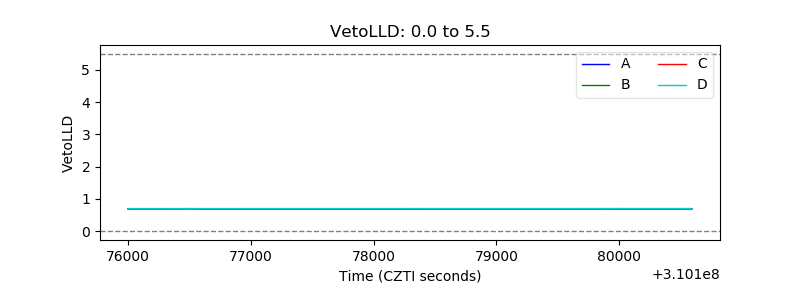 |
| Alpha Counter | 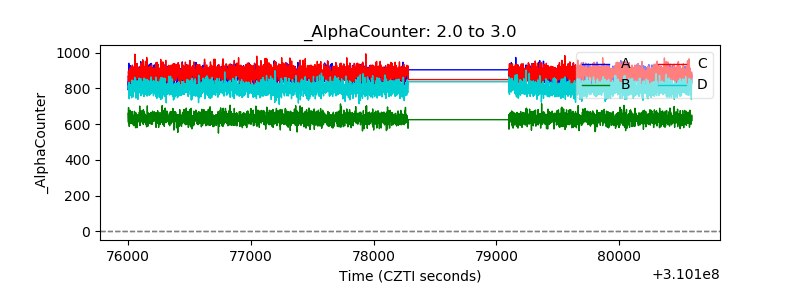 |
| _CPM_Rate | 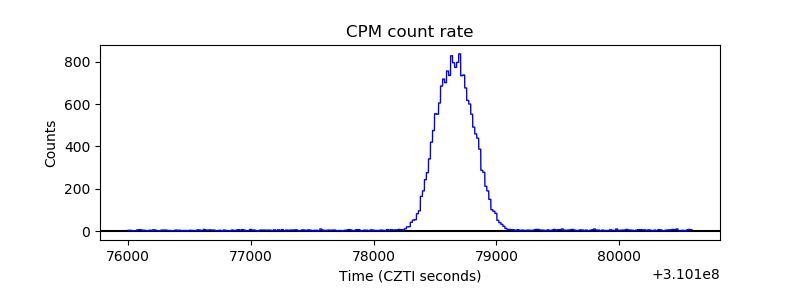 |
| CZT Counter | 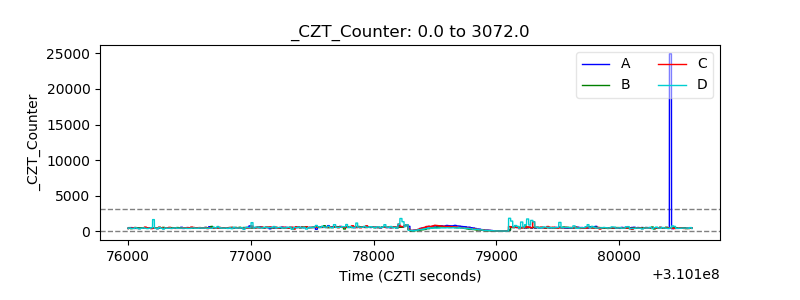 |
| +2.5 Volts monitor |  |
| +5 Volts monitor |  |
| _ROLL_ROT | 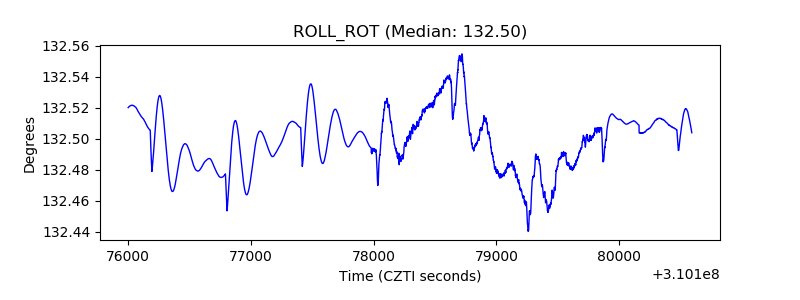 |
| _Roll_DEC | 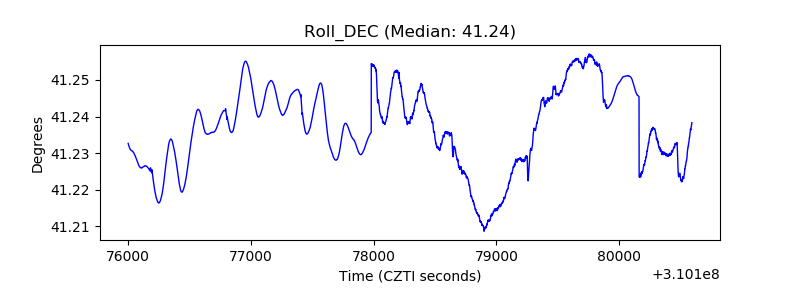 |
| _Roll_RA |  |
| Veto Counter | 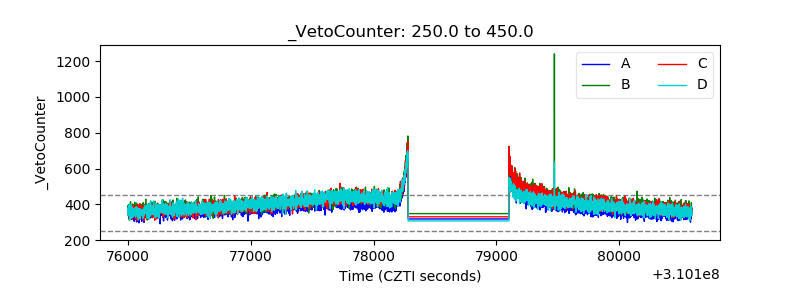 |