| Param | Original file | Final file |
|---|---|---|
| Filename | modeM0/AS1A07_007T04_9000003272_22115cztM0_level2.evt | modeM0/AS1A07_007T04_9000003272_22115cztM0_level2_quad_clean.evt |
| Size (bytes) | 645,779,520 | 67,867,200 |
| Size | 615.9 MB | 64.7 MB |
| Events in quadrant A | 3,267,741 | 443,768 |
| Events in quadrant B | 3,378,661 | 452,003 |
| Events in quadrant C | 3,293,175 | 420,746 |
| Events in quadrant D | 9,181,389 | 287,846 |
| Mode M9 | |||
|---|---|---|---|
| Quadrant | BADHDUFLAG | Total packets | Discarded packets |
| A | 0 | 18 | 0 |
| B | 0 | 19 | 0 |
| C | 0 | 19 | 0 |
| D | 0 | 19 | 0 |
| Mode SS | |||
|---|---|---|---|
| Quadrant | BADHDUFLAG | Total packets | Discarded packets |
| A | 0 | 132 | 0 |
| B | 0 | 132 | 0 |
| C | 0 | 132 | 0 |
| D | 0 | 132 | 0 |
| Mode M0 | |||
|---|---|---|---|
| Quadrant | BADHDUFLAG | Total packets | Discarded packets |
| A | 0 | 13542 | 2 |
| B | 0 | 13923 | 2 |
| C | 0 | 13671 | 2 |
| D | 0 | 31626 | 2 |
| Quadrant | Total seconds | Saturated seconds | Saturation percentage |
|---|---|---|---|
| A | 6441 | 13 | 0.201832% |
| B | 6441 | 36 | 0.558919% |
| C | 6441 | 62 | 0.962583% |
| D | 6441 | 2264 | 35.149821% |
Noise dominated data is calculated using 1-second bins in cleaned event files. If a bin has >2000 counts, and if more than 50% of those come from <1% of pixels, then it is considered to be noise-dominated and hence unusable.
| Quadrant | # 1 sec bins | Bins with >0 counts | Bins with >2000 counts | High rate bins dominated by noise | Noise dominated (total time) | Noise dominated (detector-on time) | Marked lightcurve |
|---|---|---|---|---|---|---|---|
| A | 7681 | 6442 | 0 | 0 | 0.00% | 0.00% | 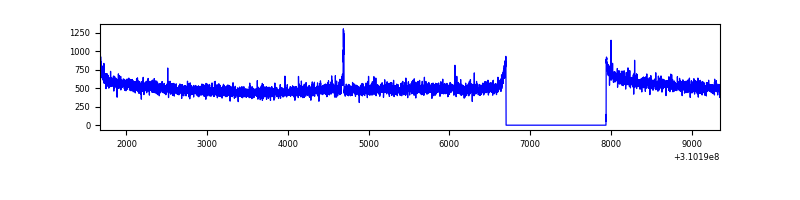 |
| B | 7681 | 6442 | 8 | 8 | 0.10% | 0.12% | 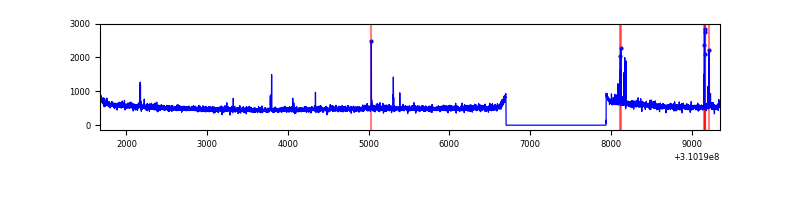 |
| C | 7681 | 6442 | 6 | 6 | 0.08% | 0.09% | 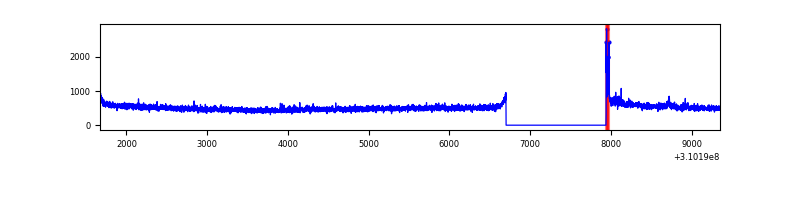 |
| D | 7681 | 6442 | 2156 | 2156 | 28.07% | 33.47% | 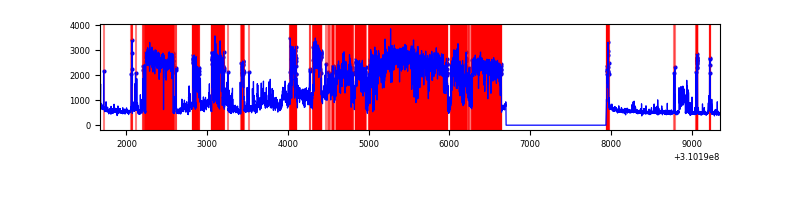 |
Top three noisy pixels from each quadrant. If the there are fewer than three noisy pixels in the level2.evt file, extra rows are filled as -1
| Pixel properties | Quadrant properties | ||||||
|---|---|---|---|---|---|---|---|
| Quadrant | DetID | PixID | Counts | Sigma | Mean | Median | Sigma |
| A | 13 | 254 | 11512 | 63.41 | 844 | 830 | 168.5 |
| A | 15 | 174 | 11416 | 62.84 | 844 | 830 | 168.5 |
| A | 0 | 226 | 7262 | 38.18 | 844 | 830 | 168.5 |
| B | 3 | 64 | 61386 | 384.78 | 839 | 820 | 157.4 |
| B | 0 | 230 | 19115 | 116.23 | 839 | 820 | 157.4 |
| B | 12 | 111 | 18890 | 114.8 | 839 | 820 | 157.4 |
| C | 14 | 238 | 129568 | 702.02 | 797 | 805 | 183.4 |
| C | 5 | 4 | 33772 | 179.74 | 797 | 805 | 183.4 |
| C | 10 | 22 | 20350 | 106.56 | 797 | 805 | 183.4 |
| D | 2 | 133 | 5138933 | 31908.31 | 666 | 646 | 161.0 |
| D | 1 | 52 | 1048563 | 6507.47 | 666 | 646 | 161.0 |
| D | 7 | 238 | 176623 | 1092.8 | 666 | 646 | 161.0 |
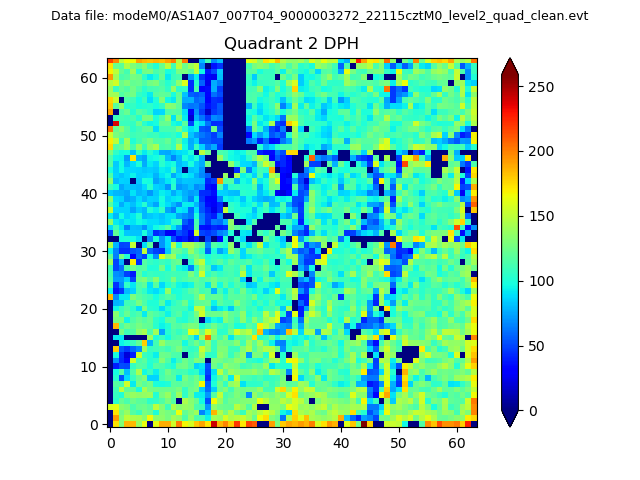
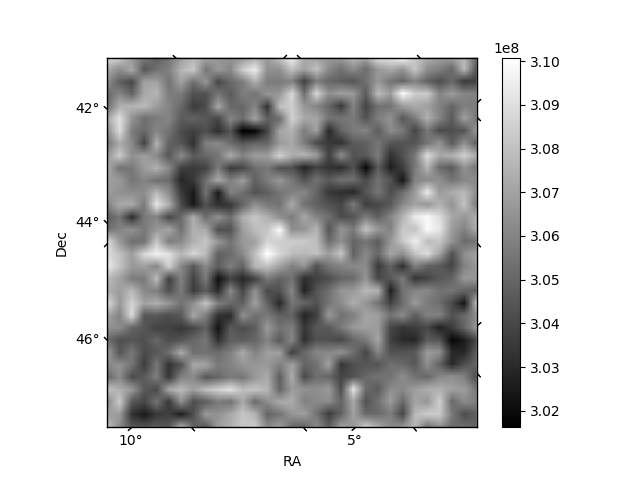
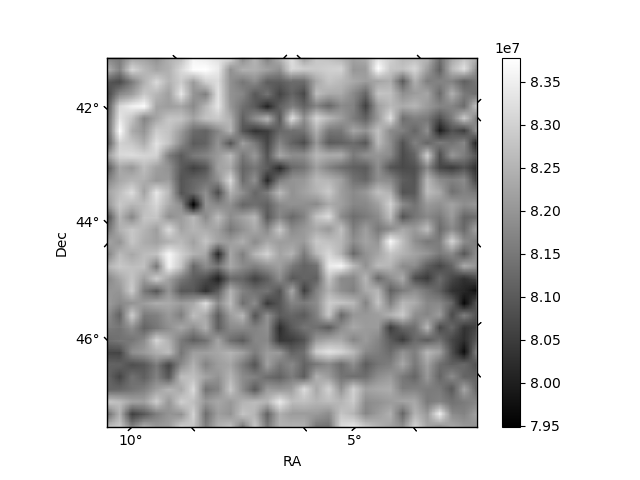
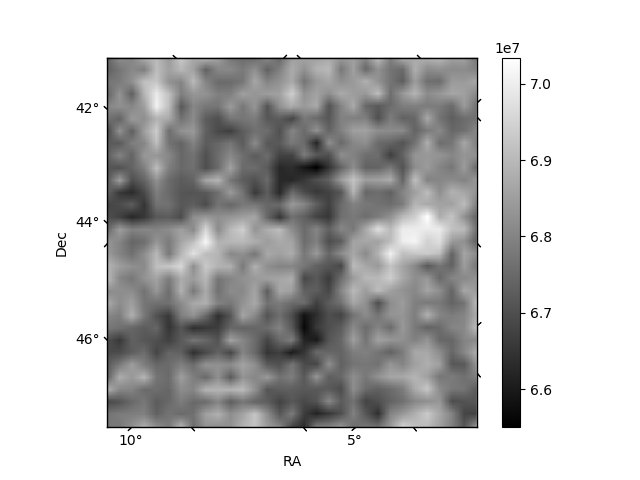
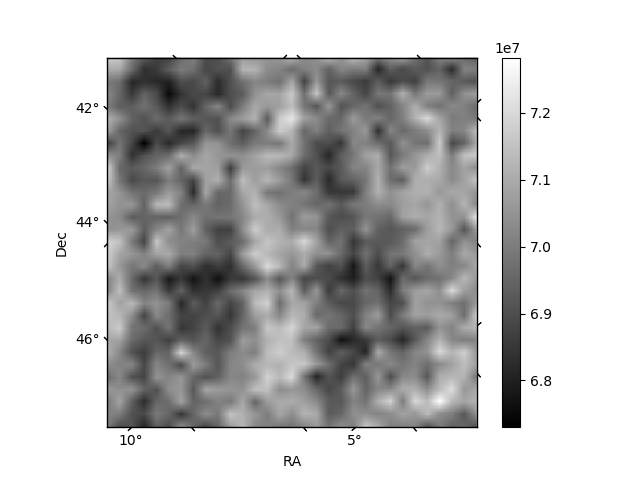
Histogram calculated using DETX and DETY for each event in the final _common_clean file
| Quadrant A | 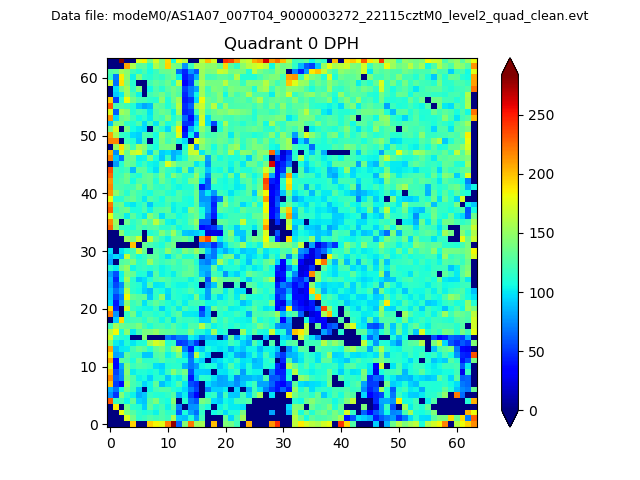 |
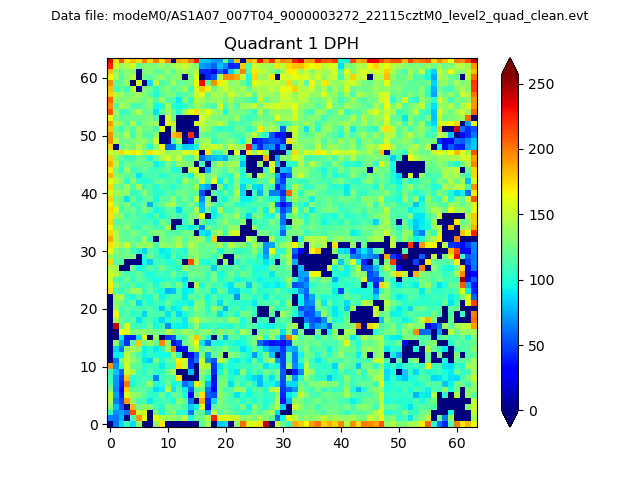 |
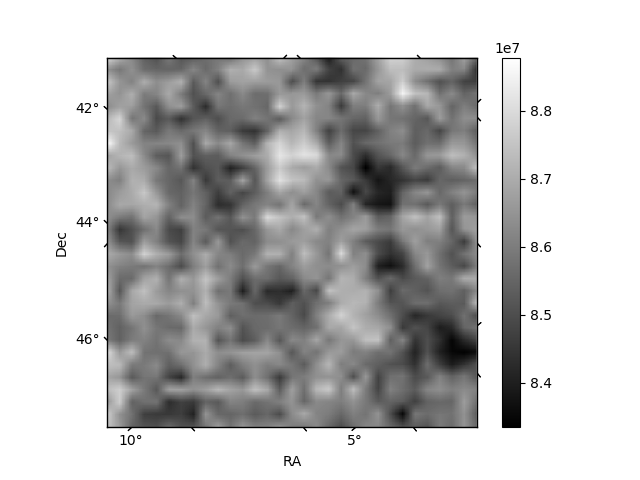
Quadrant B |
|---|---|---|---|
| Quadrant D | 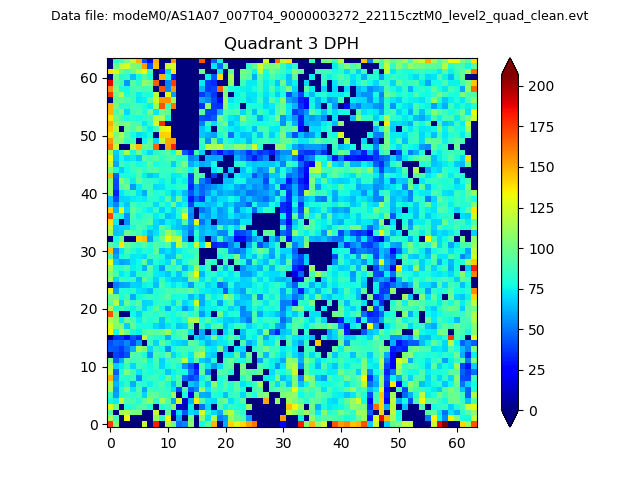 |
 |
Quadrant C |
| Plot type | Count rate plots | Images |
|---|---|---|
| Comparison with Poisson distribution Blue bars denote a histogram of data divided into 1 sec bins. Red curve is a Poisson curve with rate = median count rate of data. |
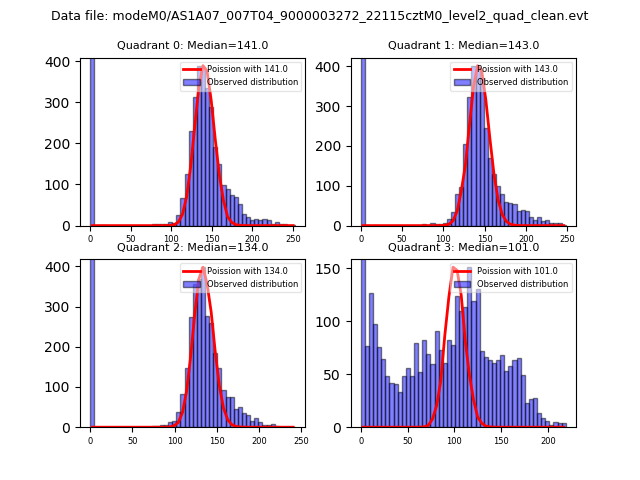 |
 |
| Quadrant-wise count rates Data is divided into 100 sec bins |
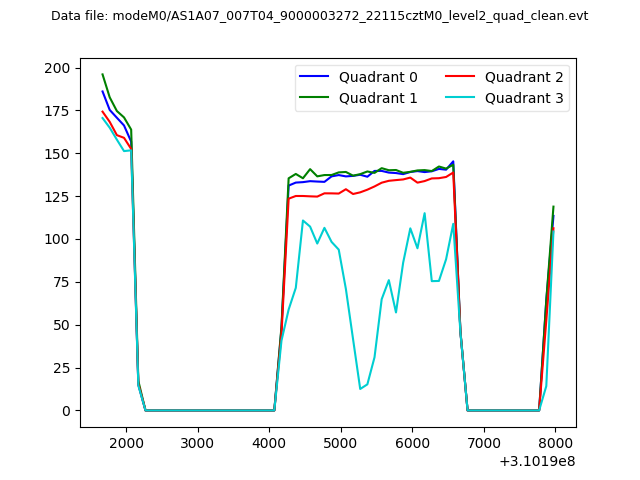 |
|
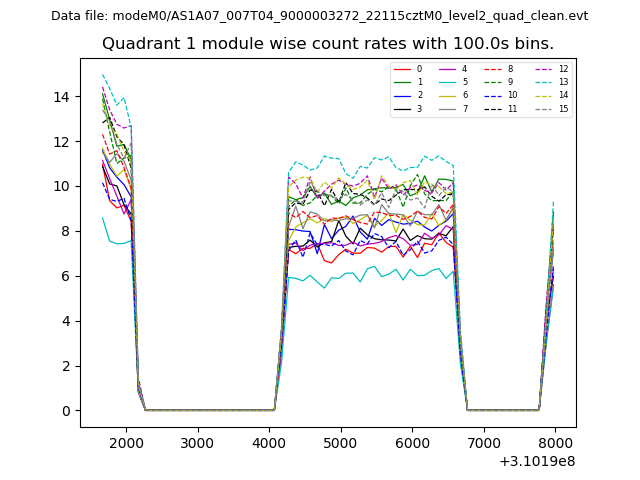
| Module-wise count rates for Quadrant A Data is divided into 100 sec bins |
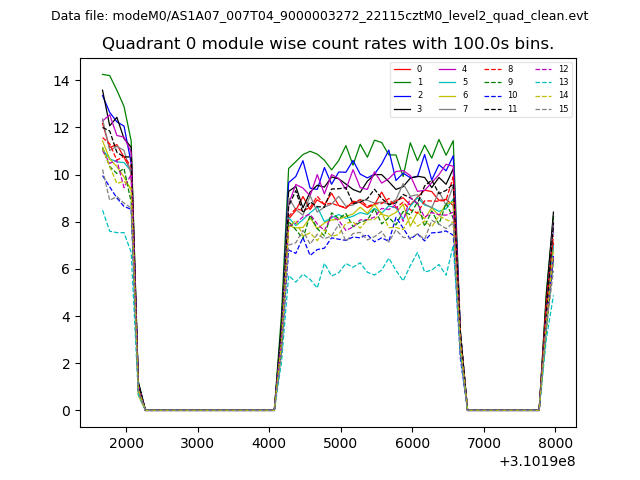 |
 |
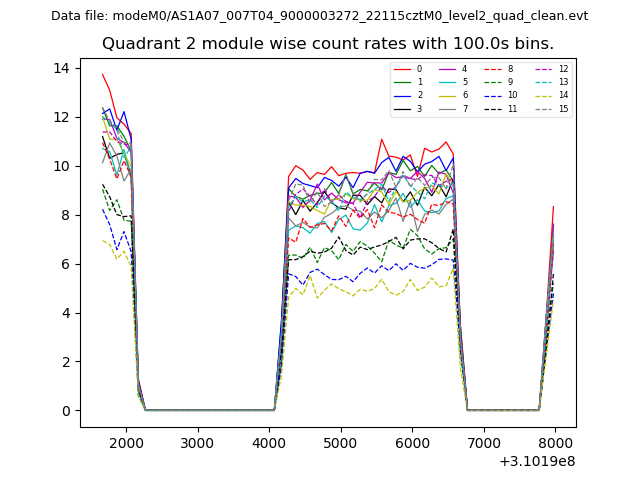
| Module-wise count rates for Quadrant B Data is divided into 100 sec bins |
 |
 |
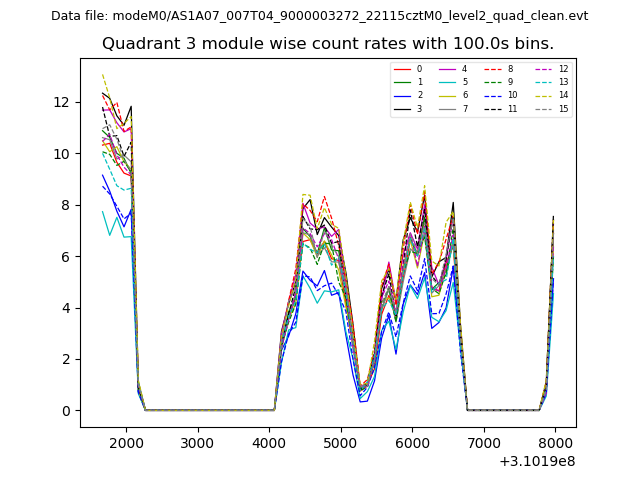
| Module-wise count rates for Quadrant C Data is divided into 100 sec bins |
 |
 |
| Module-wise count rates for Quadrant D Data is divided into 100 sec bins |
 |
 |
| Parameter | Plot |
|---|---|
| CZT HV Monitor | 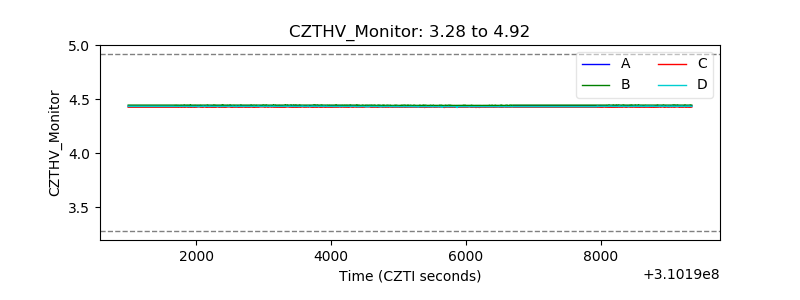 |
| D_VDD | 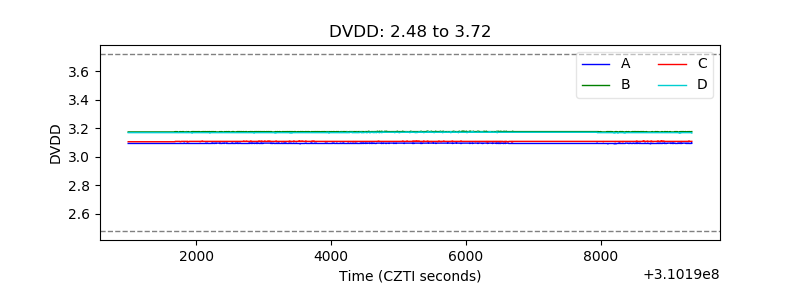 |
| Temperature 1 |  |
| Veto HV Monitor | 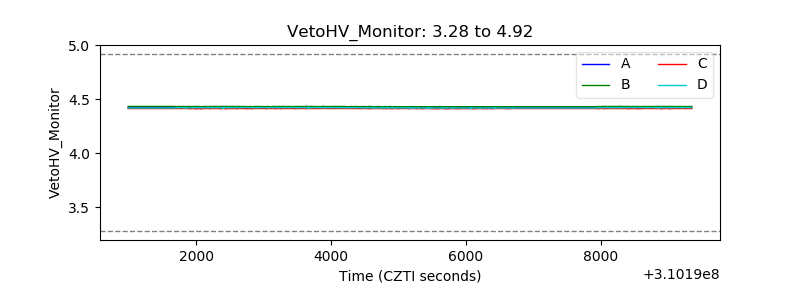 |
| Veto LLD | 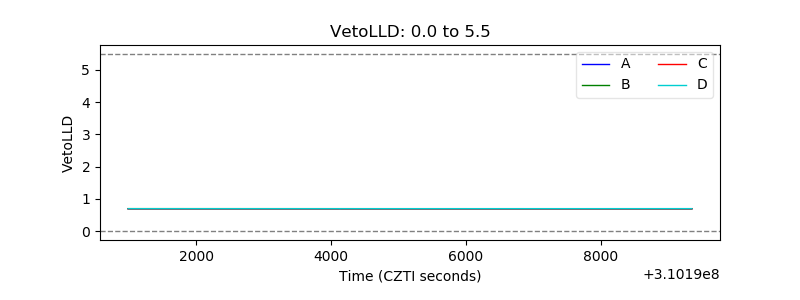 |
| Alpha Counter | 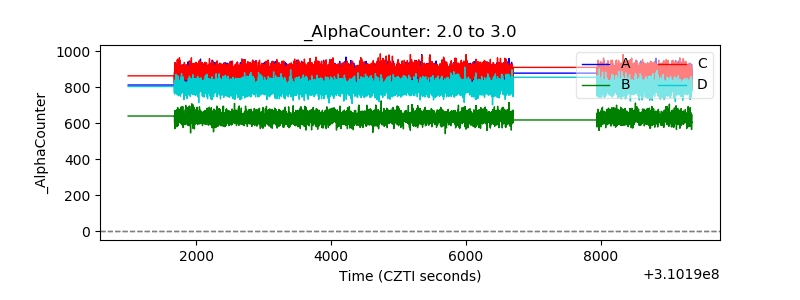 |
| _CPM_Rate | 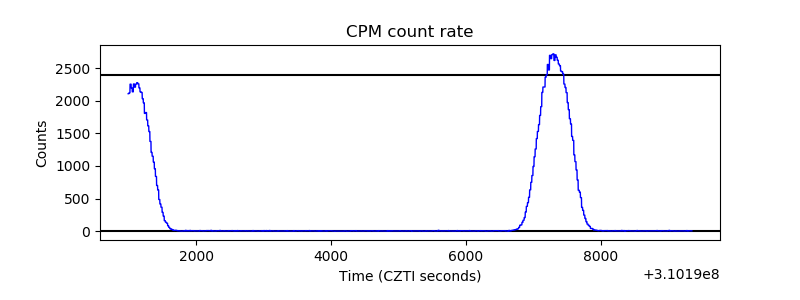 |
| CZT Counter | 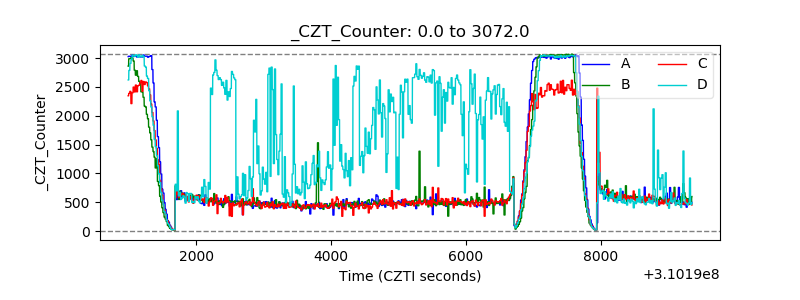 |
| +2.5 Volts monitor | 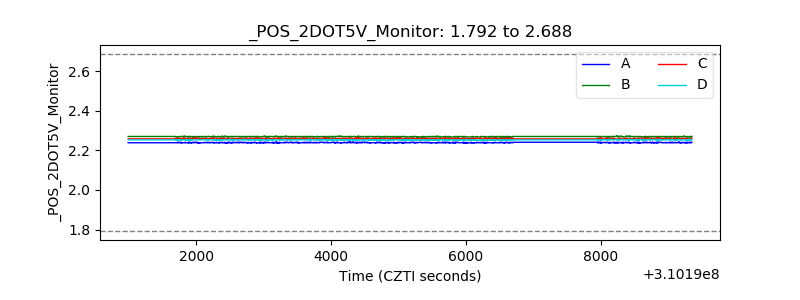 |
| +5 Volts monitor |  |
| _ROLL_ROT | 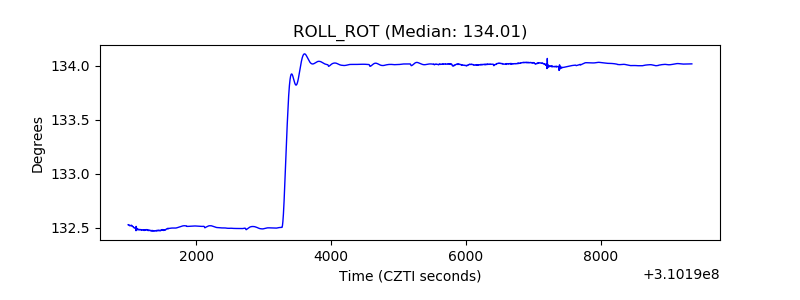 |
| _Roll_DEC | 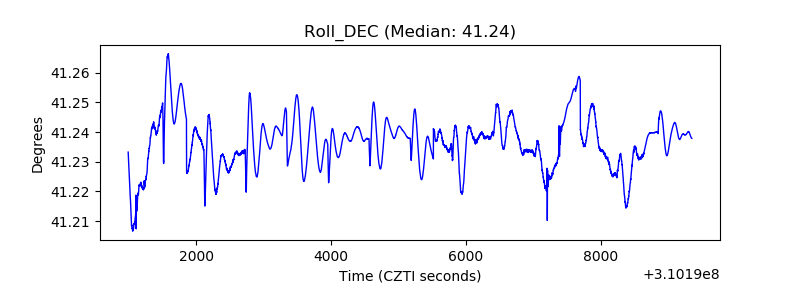 |
| _Roll_RA | 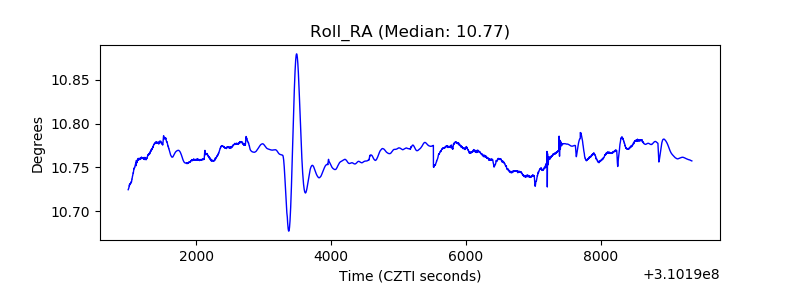 |
| Veto Counter | 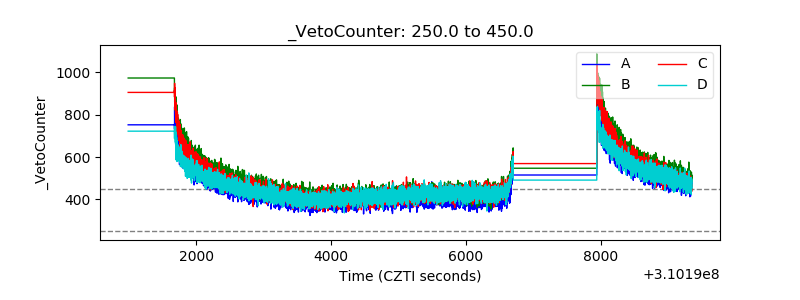 |