| Param | Original file | Final file |
|---|---|---|
| Filename | modeM0/AS1A07_007T04_9000003272_22116cztM0_level2.evt | modeM0/AS1A07_007T04_9000003272_22116cztM0_level2_quad_clean.evt |
| Size (bytes) | 517,556,160 | 68,382,720 |
| Size | 493.6 MB | 65.2 MB |
| Events in quadrant A | 3,409,244 | 421,597 |
| Events in quadrant B | 3,564,774 | 425,515 |
| Events in quadrant C | 3,431,345 | 397,663 |
| Events in quadrant D | 4,836,022 | 380,203 |
| Mode M9 | |||
|---|---|---|---|
| Quadrant | BADHDUFLAG | Total packets | Discarded packets |
| A | 0 | 23 | 0 |
| B | 0 | 24 | 0 |
| C | 0 | 24 | 0 |
| D | 0 | 24 | 0 |
| Mode SS | |||
|---|---|---|---|
| Quadrant | BADHDUFLAG | Total packets | Discarded packets |
| A | 0 | 130 | 0 |
| B | 0 | 130 | 0 |
| C | 0 | 130 | 0 |
| D | 0 | 130 | 0 |
| Mode M0 | |||
|---|---|---|---|
| Quadrant | BADHDUFLAG | Total packets | Discarded packets |
| A | 0 | 13889 | 2 |
| B | 0 | 14389 | 3 |
| C | 0 | 13934 | 2 |
| D | 0 | 18709 | 2 |
| Quadrant | Total seconds | Saturated seconds | Saturation percentage |
|---|---|---|---|
| A | 6385 | 42 | 0.657792% |
| B | 6384 | 86 | 1.347118% |
| C | 6384 | 88 | 1.378446% |
| D | 6384 | 260 | 4.072682% |
Noise dominated data is calculated using 1-second bins in cleaned event files. If a bin has >2000 counts, and if more than 50% of those come from <1% of pixels, then it is considered to be noise-dominated and hence unusable.
| Quadrant | # 1 sec bins | Bins with >0 counts | Bins with >2000 counts | High rate bins dominated by noise | Noise dominated (total time) | Noise dominated (detector-on time) | Marked lightcurve |
|---|---|---|---|---|---|---|---|
| A | 7690 | 6386 | 0 | 0 | 0.00% | 0.00% | 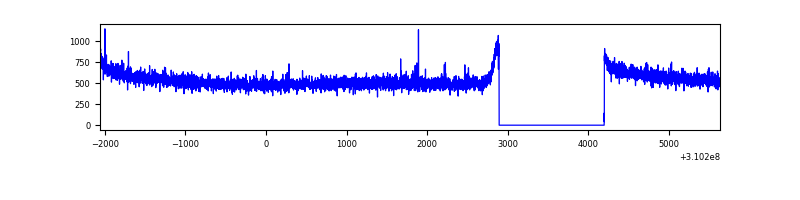 |
| B | 7689 | 6385 | 18 | 18 | 0.23% | 0.28% |  |
| C | 7689 | 6385 | 6 | 6 | 0.08% | 0.09% | 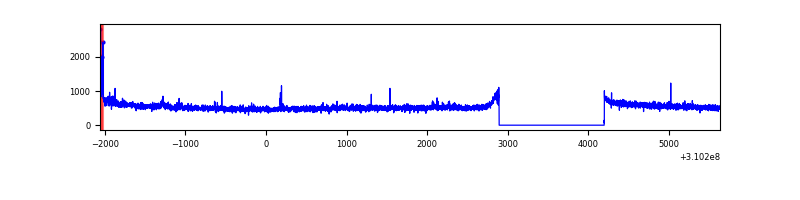 |
| D | 7689 | 6385 | 226 | 226 | 2.94% | 3.54% | 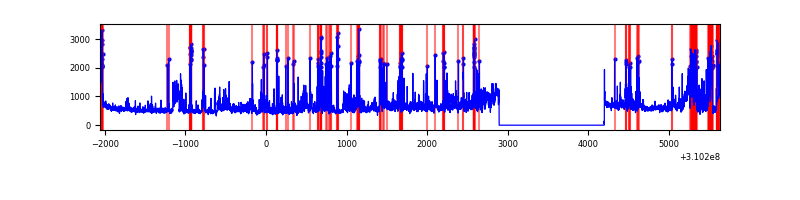 |
Top three noisy pixels from each quadrant. If the there are fewer than three noisy pixels in the level2.evt file, extra rows are filled as -1
| Pixel properties | Quadrant properties | ||||||
|---|---|---|---|---|---|---|---|
| Quadrant | DetID | PixID | Counts | Sigma | Mean | Median | Sigma |
| A | 13 | 254 | 11160 | 59.36 | 883 | 870 | 173.3 |
| A | 0 | 226 | 7654 | 39.14 | 883 | 870 | 173.3 |
| A | 3 | 137 | 6975 | 35.22 | 883 | 870 | 173.3 |
| B | 3 | 64 | 113488 | 697.95 | 873 | 856 | 161.4 |
| B | 0 | 230 | 35278 | 213.3 | 873 | 856 | 161.4 |
| B | 12 | 111 | 19187 | 113.59 | 873 | 856 | 161.4 |
| C | 14 | 238 | 133194 | 698.87 | 827 | 835 | 189.4 |
| C | 10 | 22 | 38773 | 200.32 | 827 | 835 | 189.4 |
| C | 5 | 4 | 34332 | 176.87 | 827 | 835 | 189.4 |
| D | 1 | 52 | 1139604 | 5719.21 | 826 | 803 | 199.1 |
| D | 11 | 176 | 317012 | 1588.04 | 826 | 803 | 199.1 |
| D | 2 | 136 | 103810 | 517.32 | 826 | 803 | 199.1 |
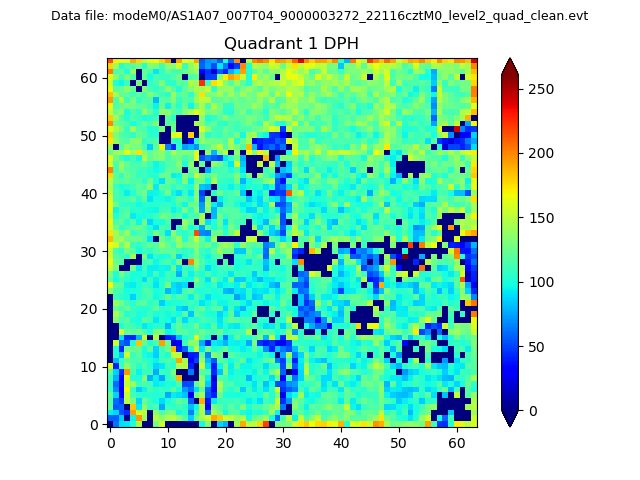
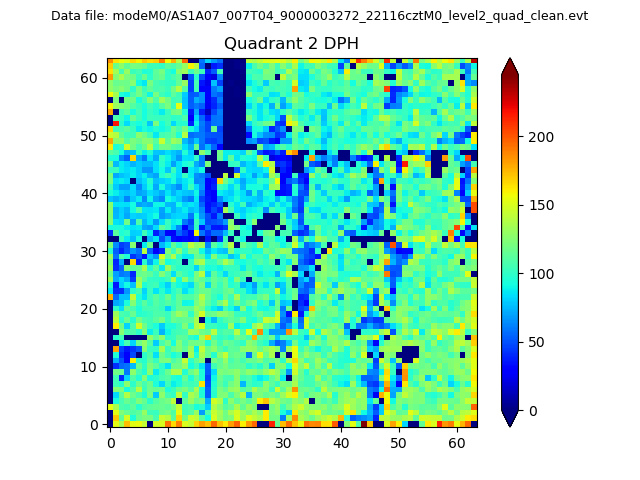
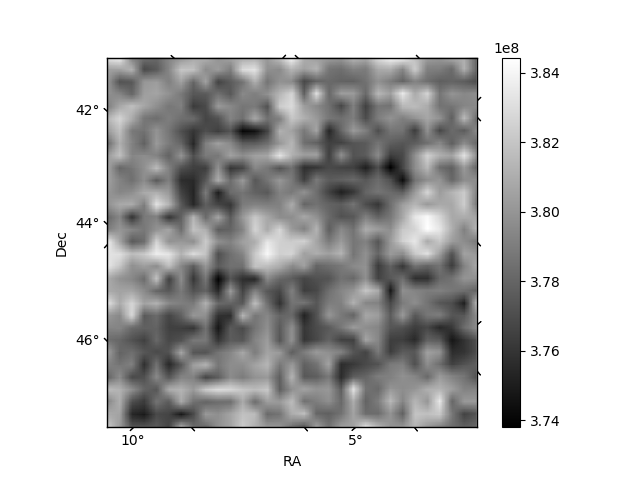
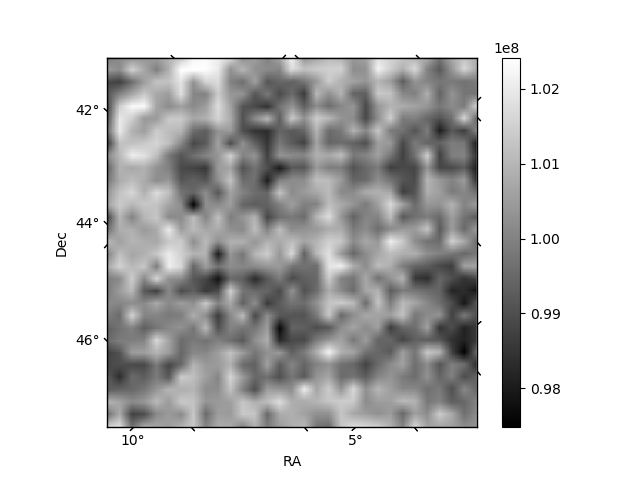
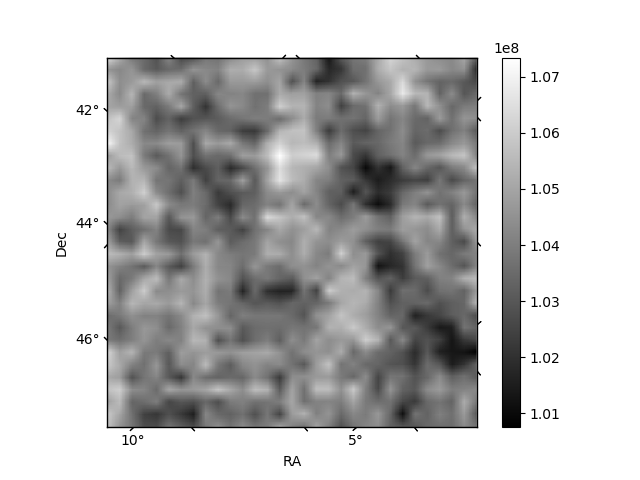
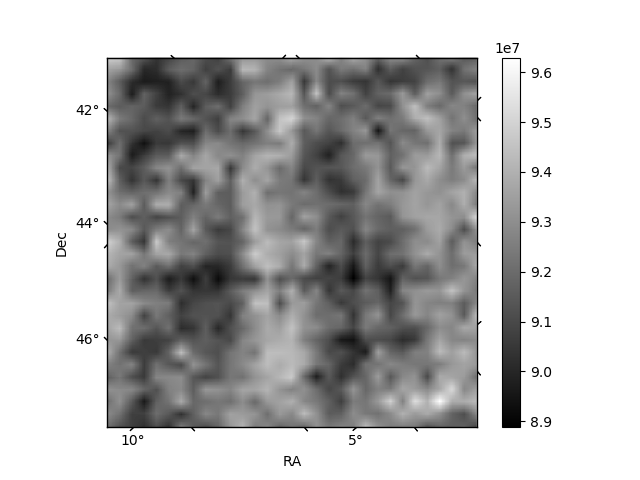
Histogram calculated using DETX and DETY for each event in the final _common_clean file
| Quadrant A | 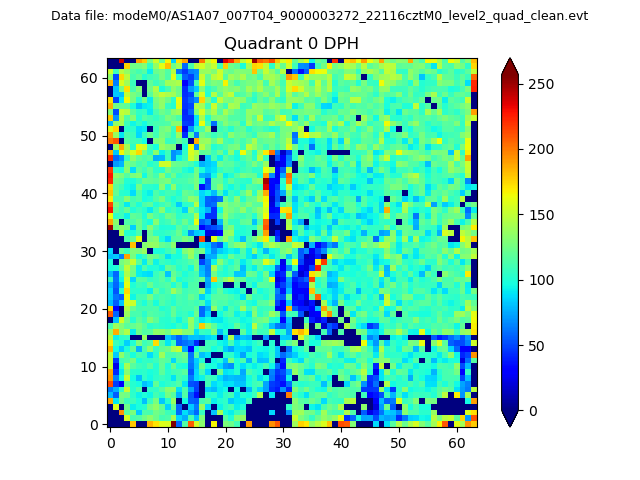 |
 |
Quadrant B |
|---|---|---|---|
| Quadrant D | 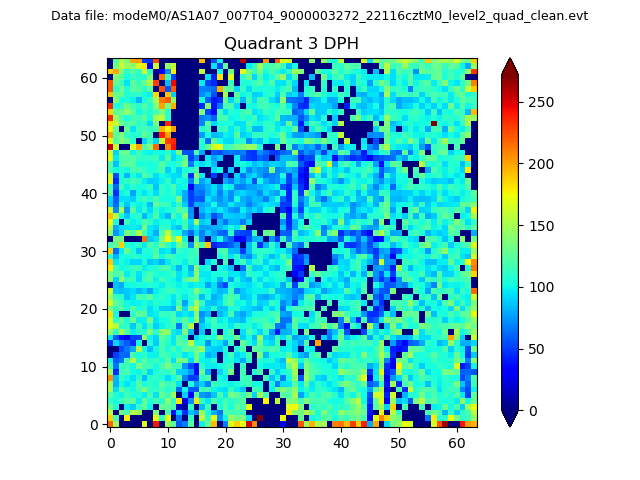 |
 |
Quadrant C |
| Plot type | Count rate plots | Images |
|---|---|---|
| Comparison with Poisson distribution Blue bars denote a histogram of data divided into 1 sec bins. Red curve is a Poisson curve with rate = median count rate of data. |
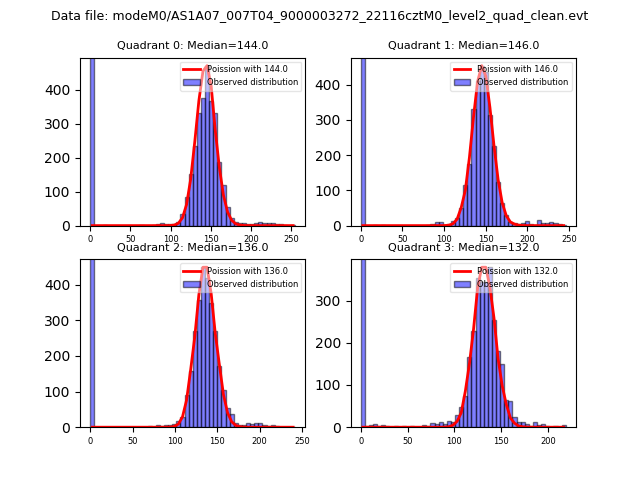 |
 |
| Quadrant-wise count rates Data is divided into 100 sec bins |
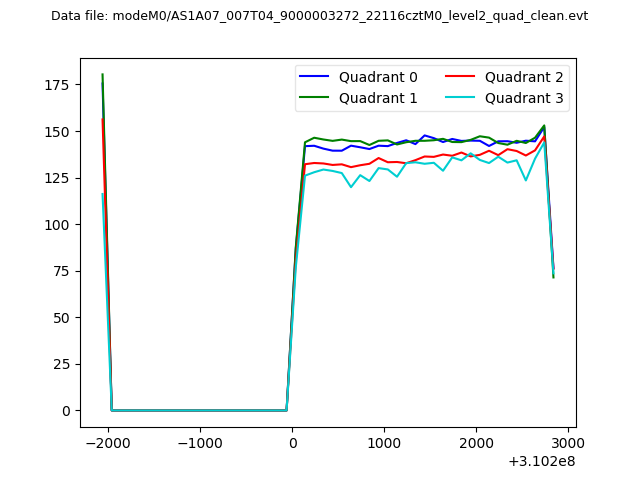 |
|
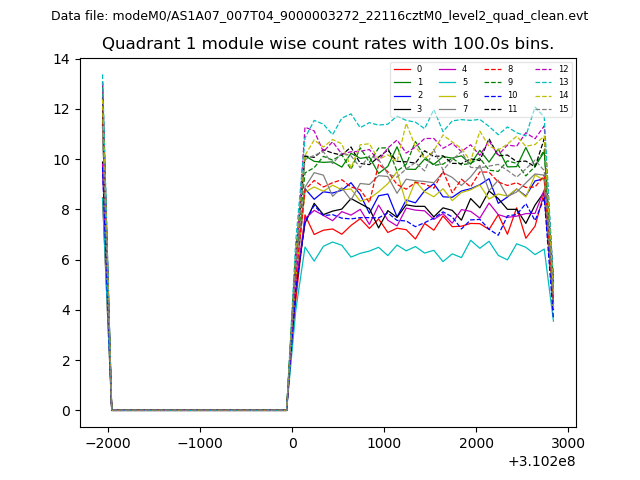
| Module-wise count rates for Quadrant A Data is divided into 100 sec bins |
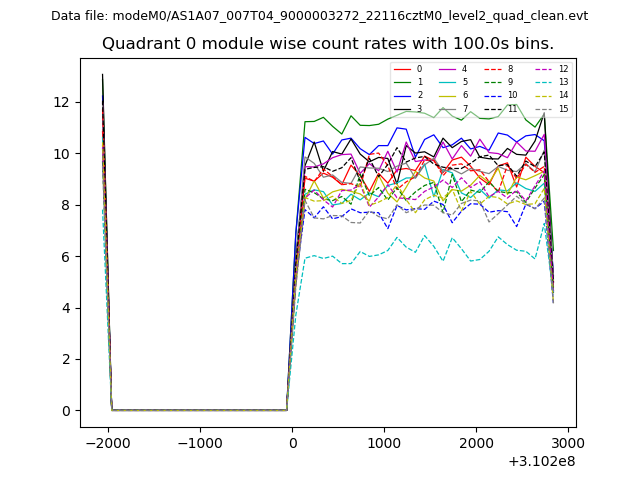 |
 |
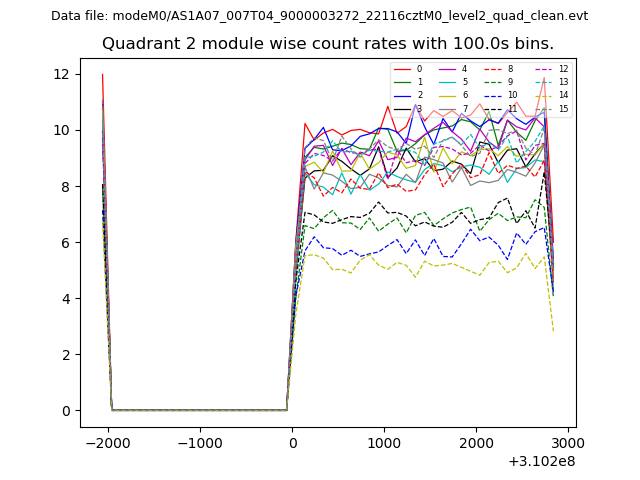
| Module-wise count rates for Quadrant B Data is divided into 100 sec bins |
 |
 |
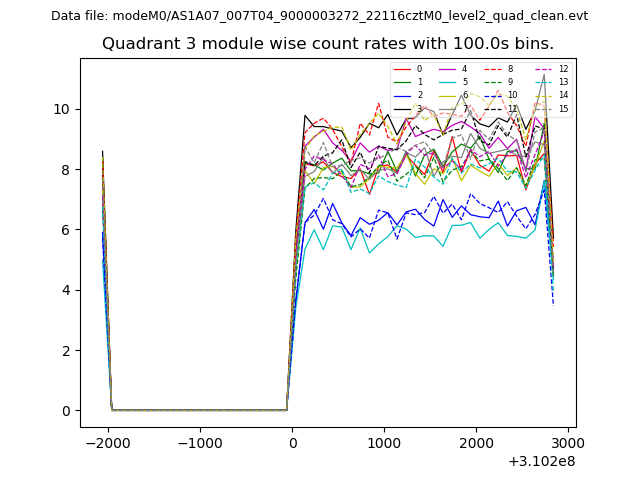
| Module-wise count rates for Quadrant C Data is divided into 100 sec bins |
 |
 |
| Module-wise count rates for Quadrant D Data is divided into 100 sec bins |
 |
 |
| Parameter | Plot |
|---|---|
| CZT HV Monitor | 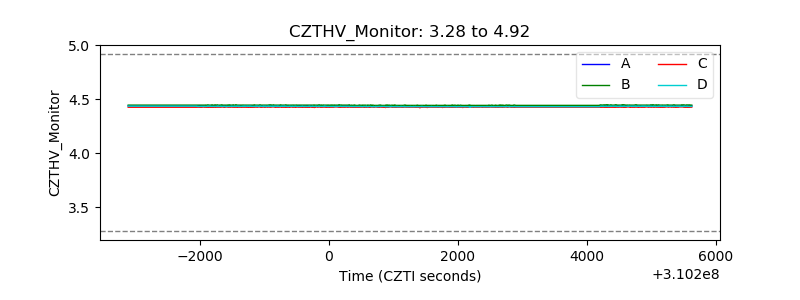 |
| D_VDD | 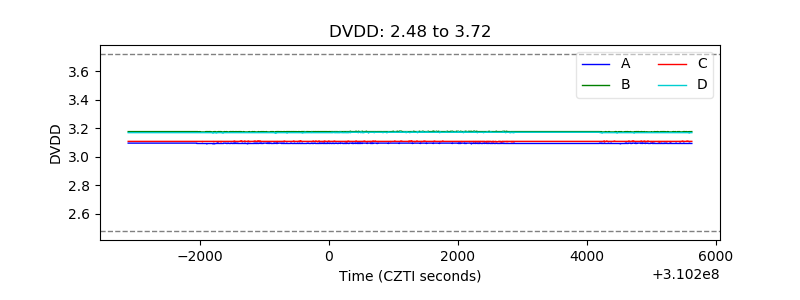 |
| Temperature 1 |  |
| Veto HV Monitor | 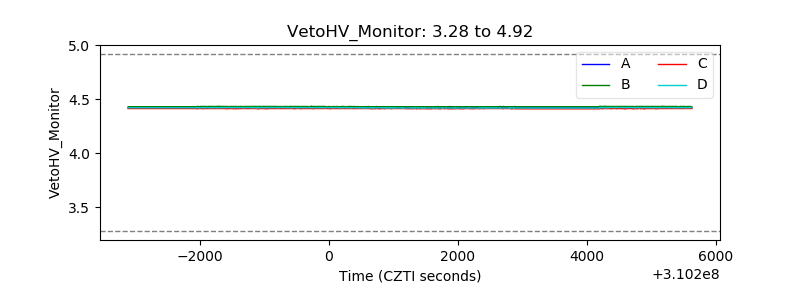 |
| Veto LLD | 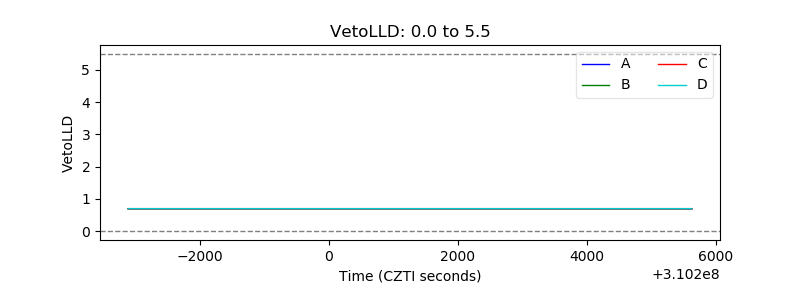 |
| Alpha Counter | 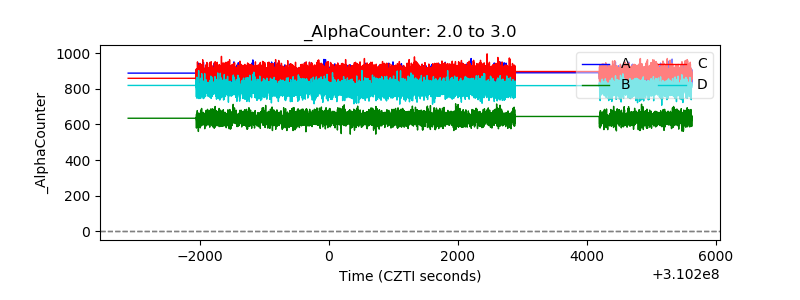 |
| _CPM_Rate | 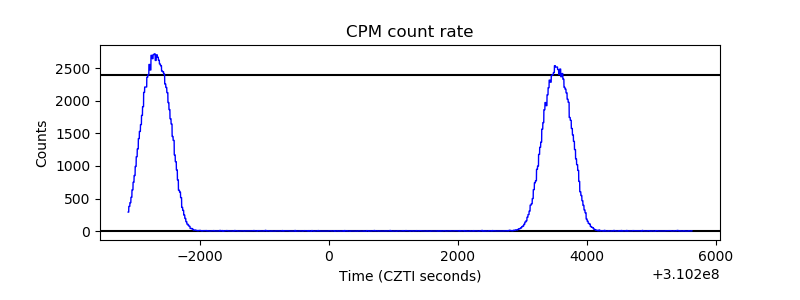 |
| CZT Counter | 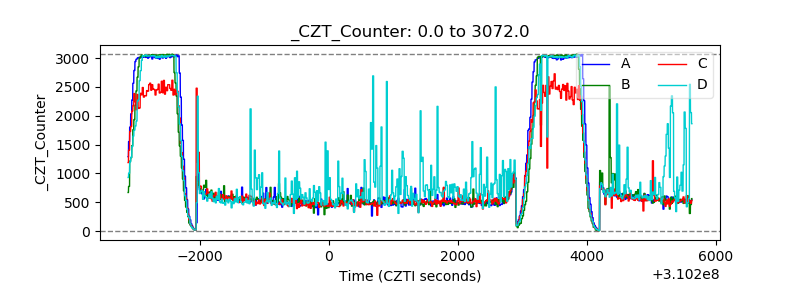 |
| +2.5 Volts monitor | 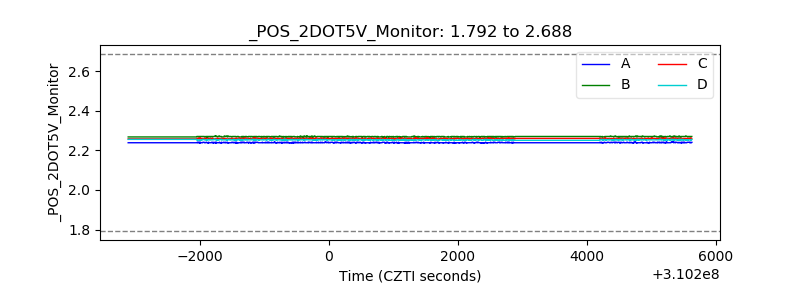 |
| +5 Volts monitor |  |
| _ROLL_ROT | 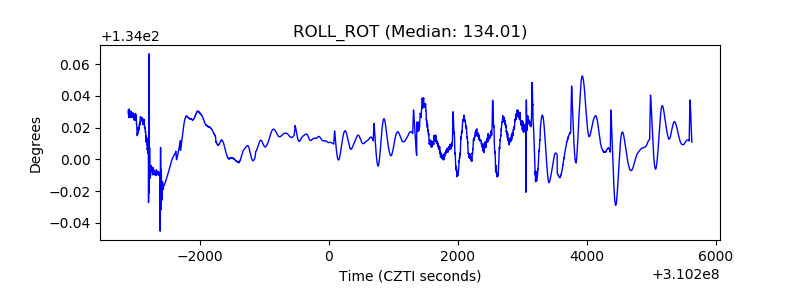 |
| _Roll_DEC | 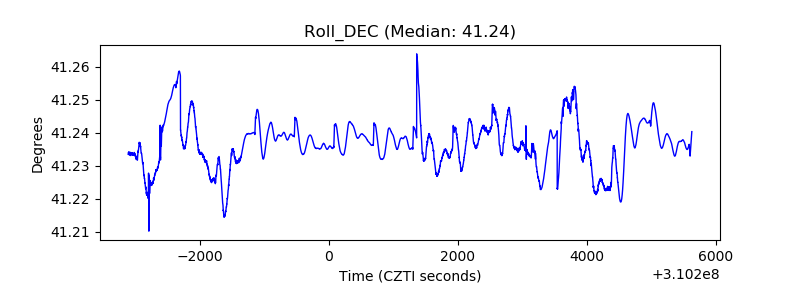 |
| _Roll_RA | 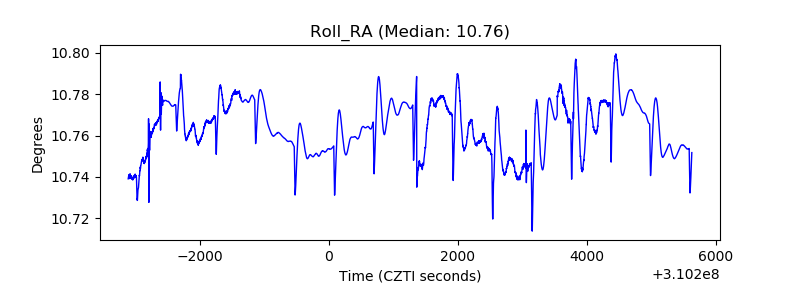 |
| Veto Counter | 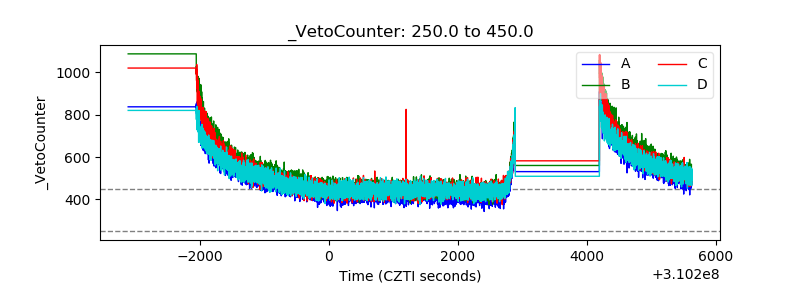 |