| Param | Original file | Final file |
|---|---|---|
| Filename | modeM0/AS1A07_007T04_9000003272_22117cztM0_level2.evt | modeM0/AS1A07_007T04_9000003272_22117cztM0_level2_quad_clean.evt |
| Size (bytes) | 559,863,360 | 73,722,240 |
| Size | 533.9 MB | 70.3 MB |
| Events in quadrant A | 3,378,766 | 465,918 |
| Events in quadrant B | 3,576,373 | 473,326 |
| Events in quadrant C | 3,346,844 | 442,234 |
| Events in quadrant D | 6,233,887 | 418,282 |
| Mode M9 | |||
|---|---|---|---|
| Quadrant | BADHDUFLAG | Total packets | Discarded packets |
| A | 0 | 23 | 0 |
| B | 0 | 24 | 0 |
| C | 0 | 24 | 0 |
| D | 0 | 24 | 0 |
| Mode SS | |||
|---|---|---|---|
| Quadrant | BADHDUFLAG | Total packets | Discarded packets |
| A | 0 | 124 | 0 |
| B | 0 | 124 | 0 |
| C | 0 | 124 | 0 |
| D | 0 | 124 | 0 |
| Mode M0 | |||
|---|---|---|---|
| Quadrant | BADHDUFLAG | Total packets | Discarded packets |
| A | 0 | 13749 | 2 |
| B | 0 | 14347 | 2 |
| C | 0 | 13529 | 2 |
| D | 0 | 22757 | 2 |
| Quadrant | Total seconds | Saturated seconds | Saturation percentage |
|---|---|---|---|
| A | 6201 | 41 | 0.661184% |
| B | 6201 | 91 | 1.467505% |
| C | 6201 | 74 | 1.193356% |
| D | 6201 | 926 | 14.933075% |
Noise dominated data is calculated using 1-second bins in cleaned event files. If a bin has >2000 counts, and if more than 50% of those come from <1% of pixels, then it is considered to be noise-dominated and hence unusable.
| Quadrant | # 1 sec bins | Bins with >0 counts | Bins with >2000 counts | High rate bins dominated by noise | Noise dominated (total time) | Noise dominated (detector-on time) | Marked lightcurve |
|---|---|---|---|---|---|---|---|
| A | 7541 | 6202 | 0 | 0 | 0.00% | 0.00% | 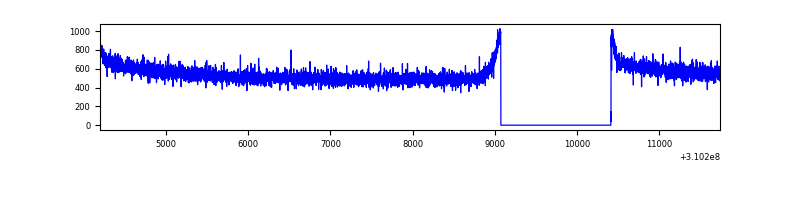 |
| B | 7541 | 6202 | 23 | 23 | 0.30% | 0.37% |  |
| C | 7541 | 6202 | 3 | 3 | 0.04% | 0.05% | 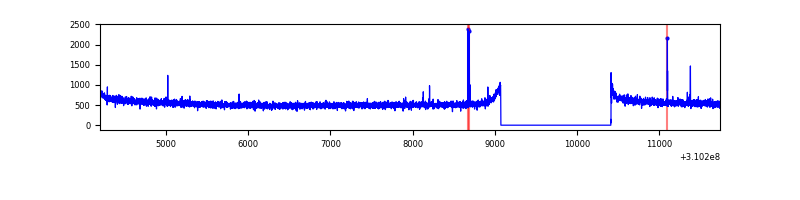 |
| D | 7541 | 6202 | 680 | 680 | 9.02% | 10.96% | 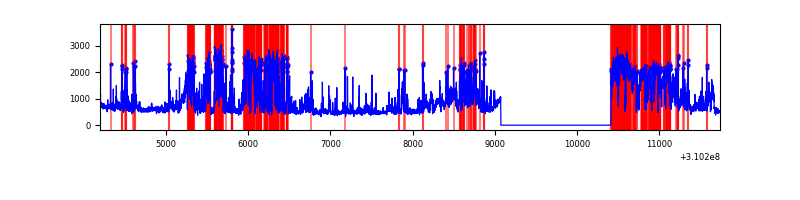 |
Top three noisy pixels from each quadrant. If the there are fewer than three noisy pixels in the level2.evt file, extra rows are filled as -1
| Pixel properties | Quadrant properties | ||||||
|---|---|---|---|---|---|---|---|
| Quadrant | DetID | PixID | Counts | Sigma | Mean | Median | Sigma |
| A | 13 | 254 | 11375 | 60.47 | 876 | 860 | 173.9 |
| A | 0 | 226 | 7495 | 38.16 | 876 | 860 | 173.9 |
| A | 3 | 137 | 6795 | 34.13 | 876 | 860 | 173.9 |
| B | 3 | 64 | 187388 | 1172.63 | 862 | 846 | 159.1 |
| B | 12 | 111 | 18592 | 111.55 | 862 | 846 | 159.1 |
| B | 11 | 111 | 16596 | 99.01 | 862 | 846 | 159.1 |
| C | 14 | 238 | 133162 | 704.51 | 816 | 824 | 187.8 |
| C | 10 | 22 | 29161 | 150.85 | 816 | 824 | 187.8 |
| C | 13 | 61 | 5730 | 26.12 | 816 | 824 | 187.8 |
| D | 1 | 52 | 1354233 | 7258.15 | 784 | 764 | 186.5 |
| D | 2 | 133 | 1177782 | 6311.91 | 784 | 764 | 186.5 |
| D | 11 | 176 | 648000 | 3470.89 | 784 | 764 | 186.5 |
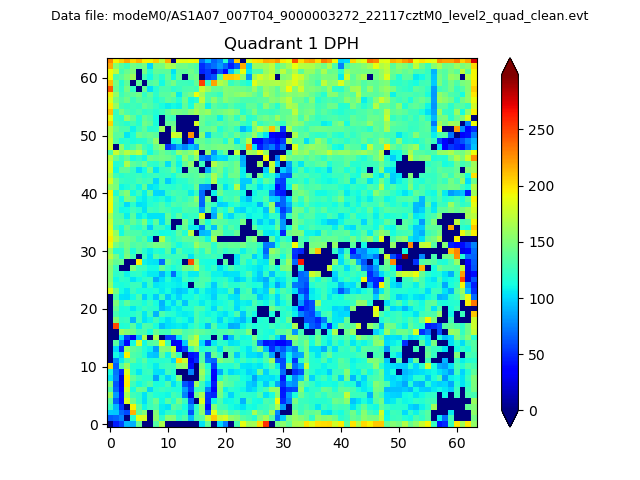
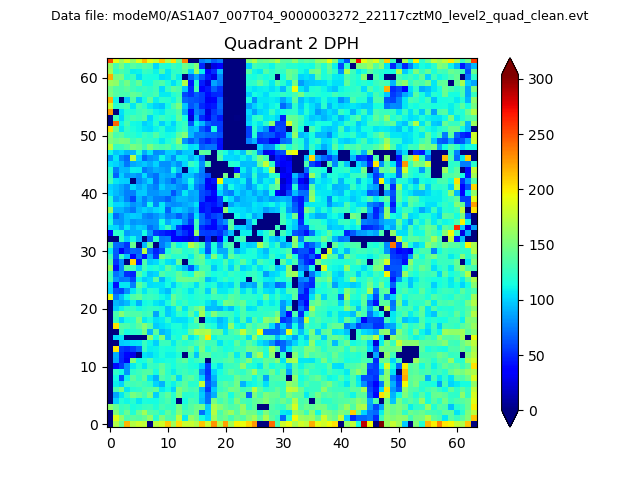
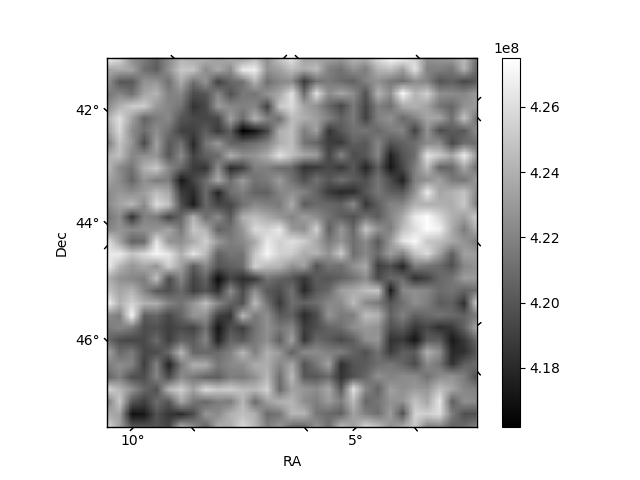
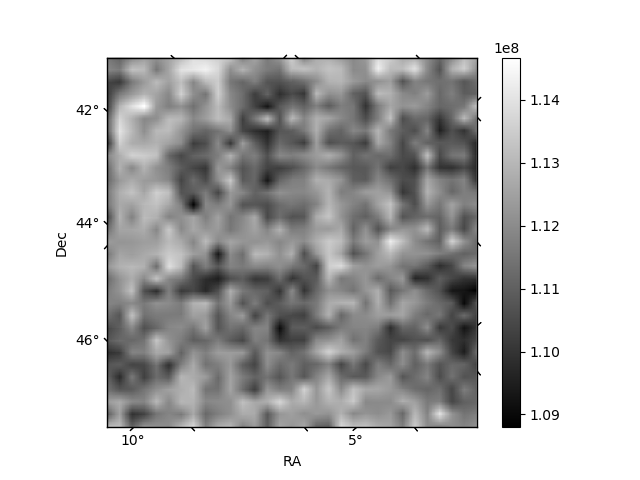
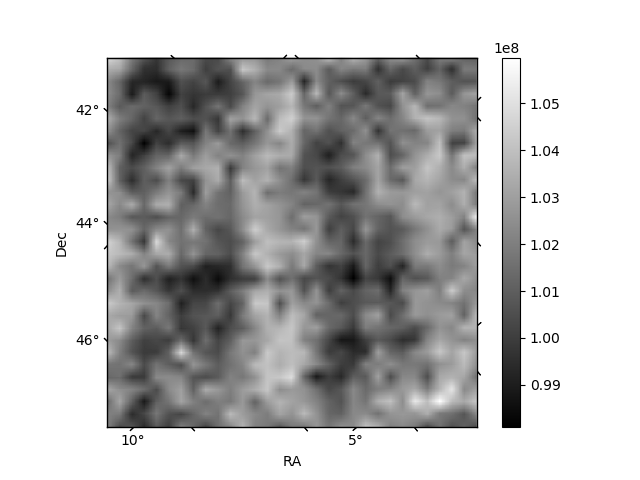
Histogram calculated using DETX and DETY for each event in the final _common_clean file
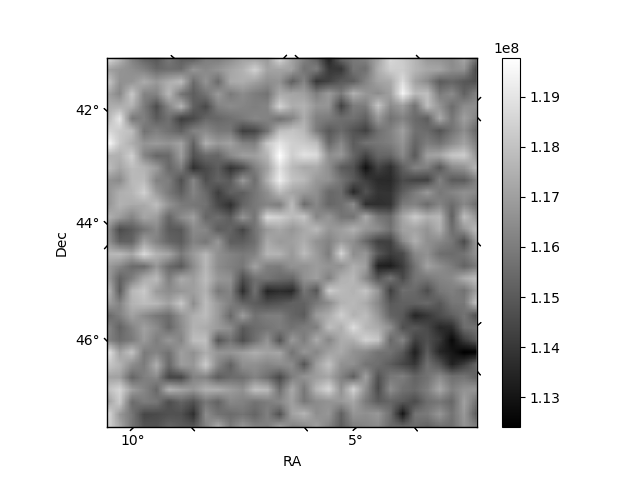
| Quadrant A | 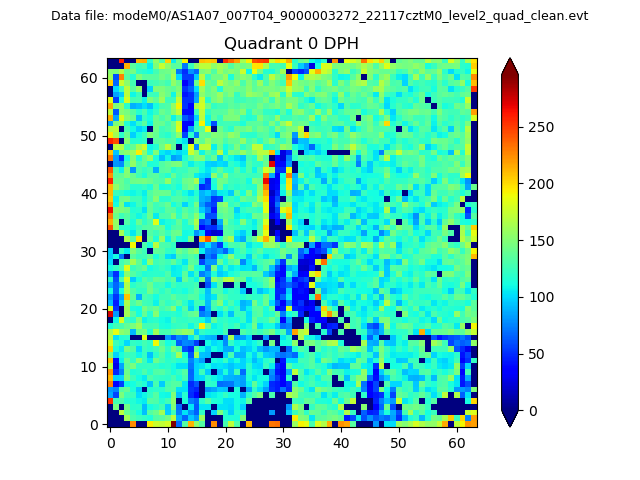 |
 |
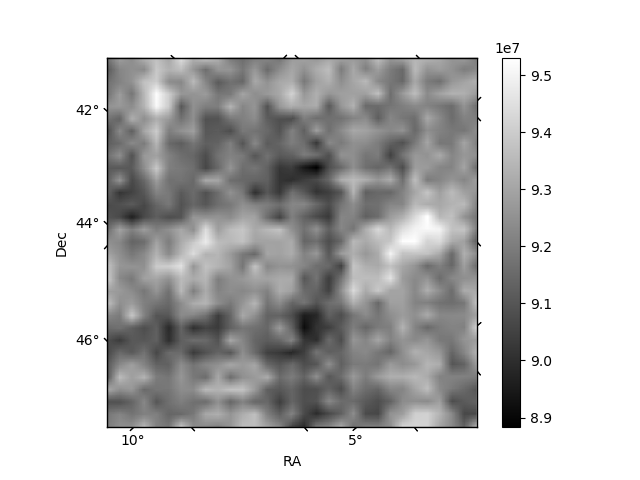
Quadrant B |
|---|---|---|---|
| Quadrant D | 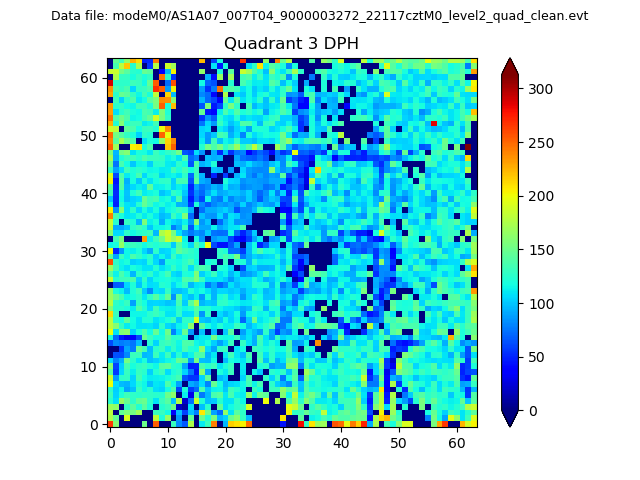 |
 |
Quadrant C |
| Plot type | Count rate plots | Images |
|---|---|---|
| Comparison with Poisson distribution Blue bars denote a histogram of data divided into 1 sec bins. Red curve is a Poisson curve with rate = median count rate of data. |
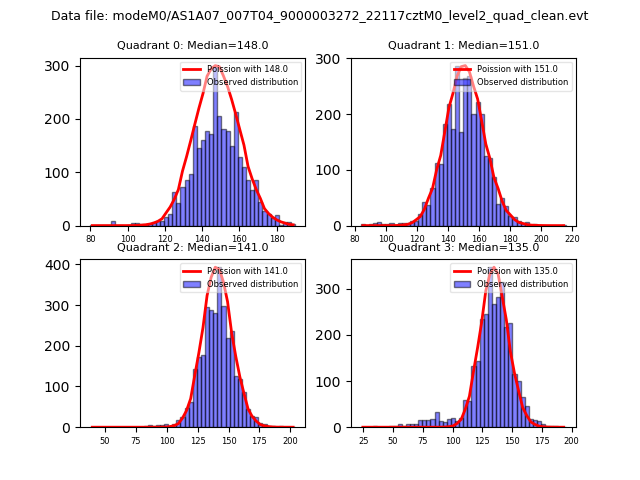 |
 |
| Quadrant-wise count rates Data is divided into 100 sec bins |
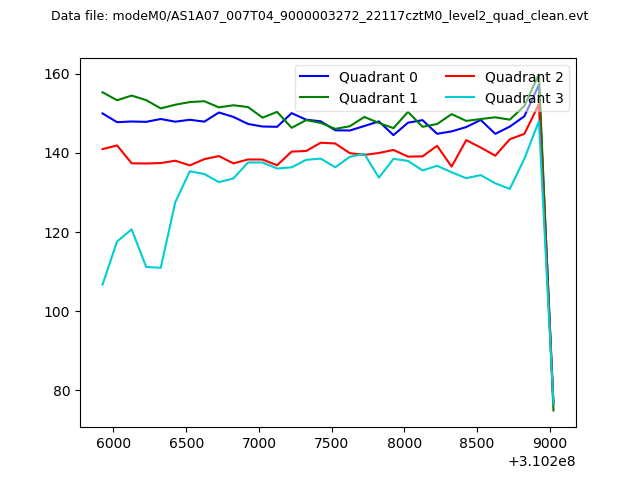 |
|
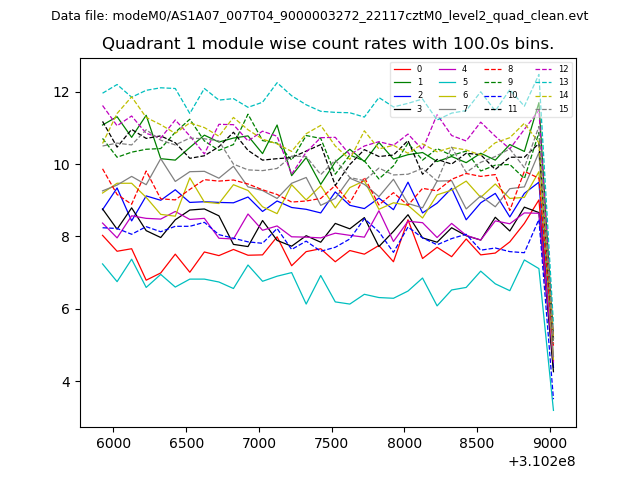
| Module-wise count rates for Quadrant A Data is divided into 100 sec bins |
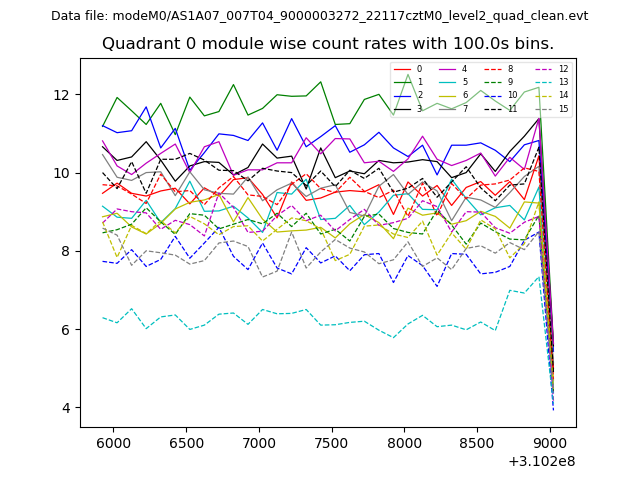 |
 |
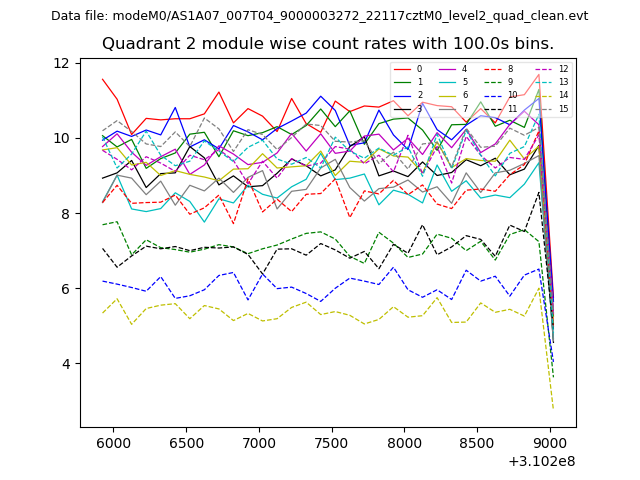
| Module-wise count rates for Quadrant B Data is divided into 100 sec bins |
 |
 |
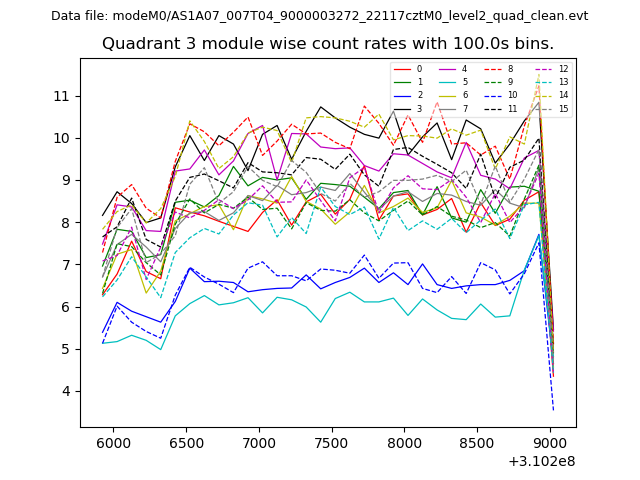
| Module-wise count rates for Quadrant C Data is divided into 100 sec bins |
 |
 |
| Module-wise count rates for Quadrant D Data is divided into 100 sec bins |
 |
 |
| Parameter | Plot |
|---|---|
| CZT HV Monitor | 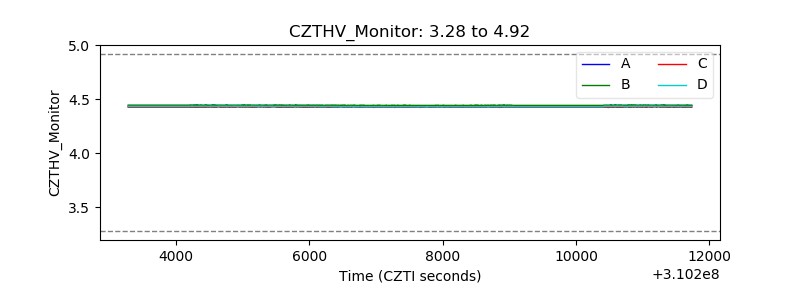 |
| D_VDD | 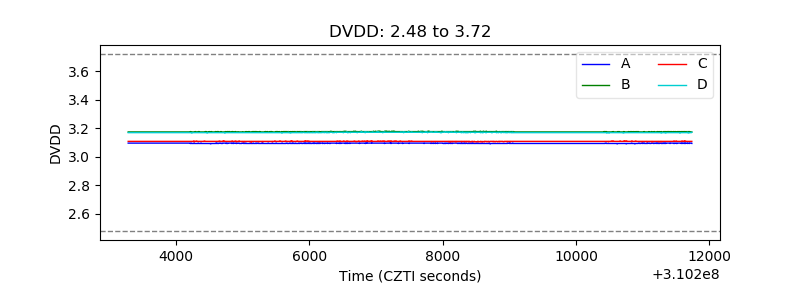 |
| Temperature 1 | 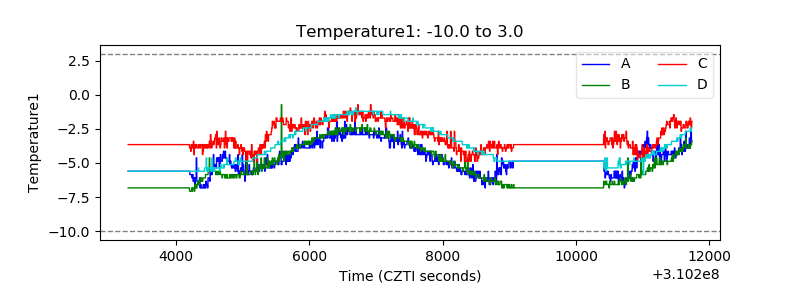 |
| Veto HV Monitor |  |
| Veto LLD | 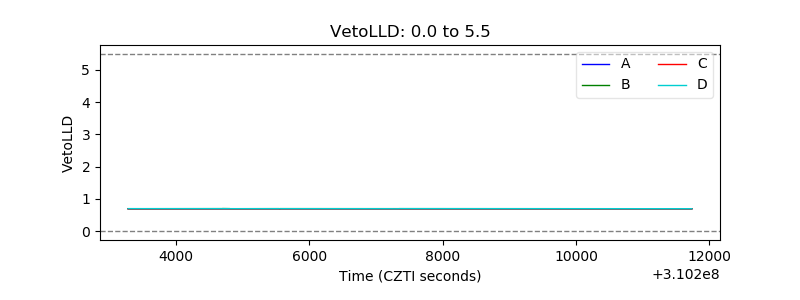 |
| Alpha Counter | 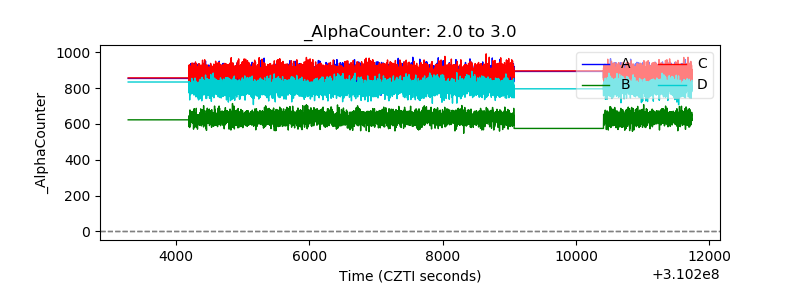 |
| _CPM_Rate | 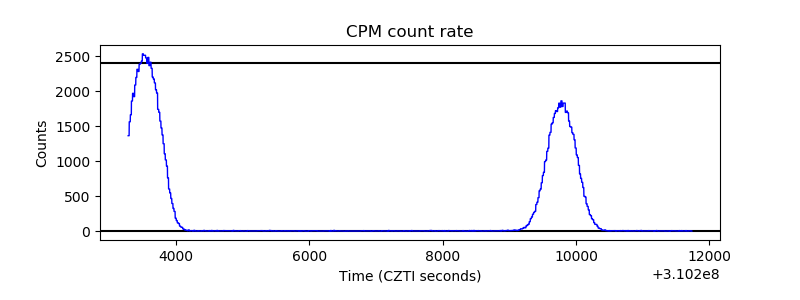 |
| CZT Counter | 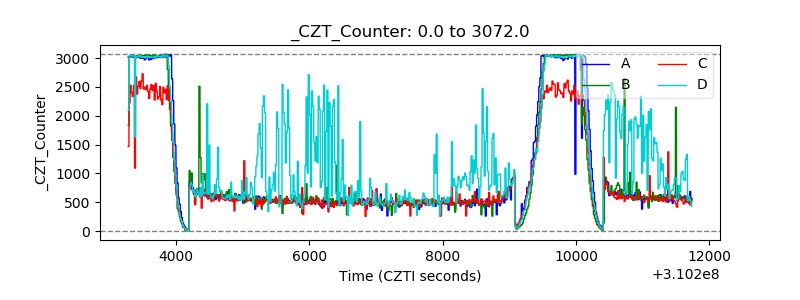 |
| +2.5 Volts monitor |  |
| +5 Volts monitor | 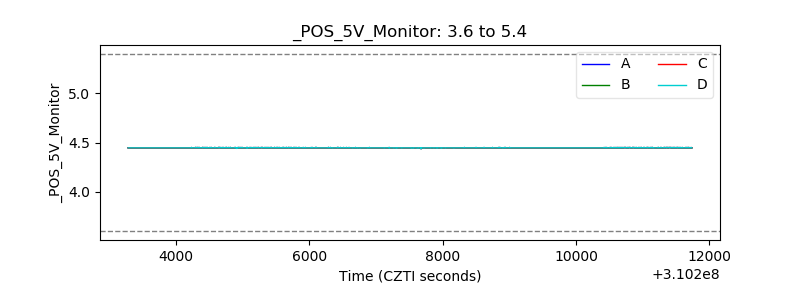 |
| _ROLL_ROT | 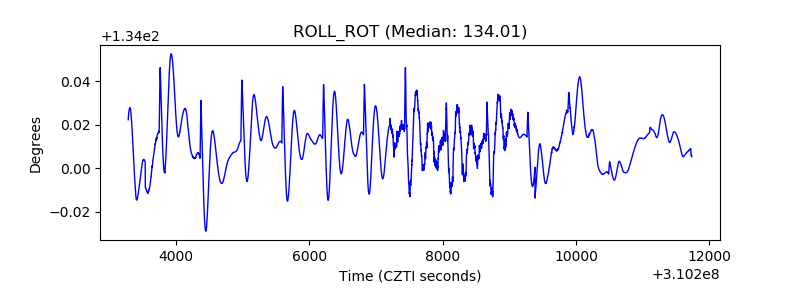 |
| _Roll_DEC |  |
| _Roll_RA | 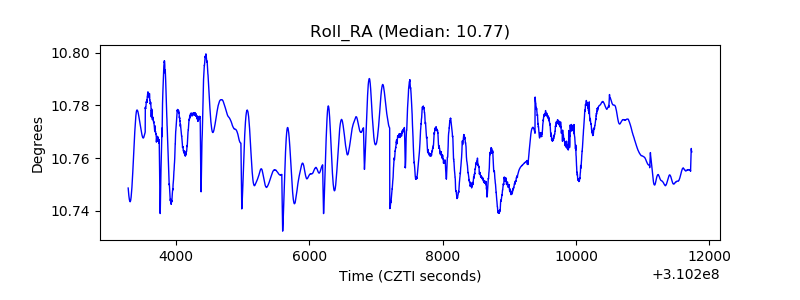 |
| Veto Counter | 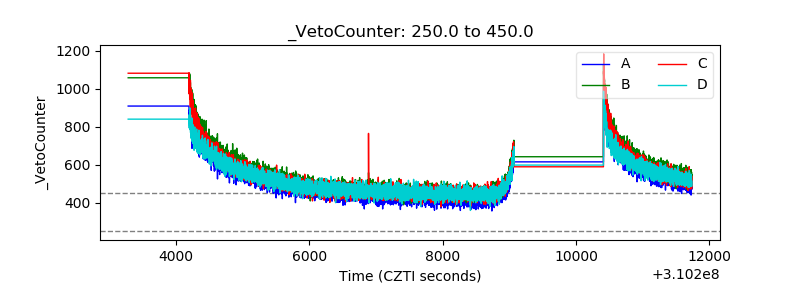 |