| Param | Original file | Final file |
|---|---|---|
| Filename | modeM0/AS1A07_007T04_9000003272_22120cztM0_level2.evt | modeM0/AS1A07_007T04_9000003272_22120cztM0_level2_quad_clean.evt |
| Size (bytes) | 497,344,320 | 106,888,320 |
| Size | 474.3 MB | 101.9 MB |
| Events in quadrant A | 3,461,211 | 703,876 |
| Events in quadrant B | 3,660,798 | 707,538 |
| Events in quadrant C | 3,499,174 | 673,775 |
| Events in quadrant D | 3,958,055 | 656,818 |
| Mode M9 | |||
|---|---|---|---|
| Quadrant | BADHDUFLAG | Total packets | Discarded packets |
| A | 0 | 17 | 0 |
| B | 0 | 18 | 0 |
| C | 0 | 18 | 0 |
| D | 0 | 18 | 0 |
| Mode SS | |||
|---|---|---|---|
| Quadrant | BADHDUFLAG | Total packets | Discarded packets |
| A | 0 | 142 | 0 |
| B | 0 | 142 | 0 |
| C | 0 | 142 | 0 |
| D | 0 | 142 | 0 |
| Mode M0 | |||
|---|---|---|---|
| Quadrant | BADHDUFLAG | Total packets | Discarded packets |
| A | 0 | 14705 | 2 |
| B | 0 | 15268 | 2 |
| C | 0 | 14756 | 3 |
| D | 0 | 16287 | 2 |
| Quadrant | Total seconds | Saturated seconds | Saturation percentage |
|---|---|---|---|
| A | 7118 | 97 | 1.362742% |
| B | 7118 | 128 | 1.798258% |
| C | 7117 | 124 | 1.742307% |
| D | 7117 | 149 | 2.093579% |
Noise dominated data is calculated using 1-second bins in cleaned event files. If a bin has >2000 counts, and if more than 50% of those come from <1% of pixels, then it is considered to be noise-dominated and hence unusable.
| Quadrant | # 1 sec bins | Bins with >0 counts | Bins with >2000 counts | High rate bins dominated by noise | Noise dominated (total time) | Noise dominated (detector-on time) | Marked lightcurve |
|---|---|---|---|---|---|---|---|
| A | 7858 | 7119 | 0 | 0 | 0.00% | 0.00% | 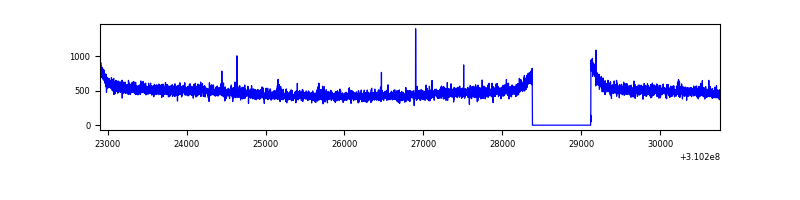 |
| B | 7858 | 7119 | 13 | 13 | 0.17% | 0.18% | 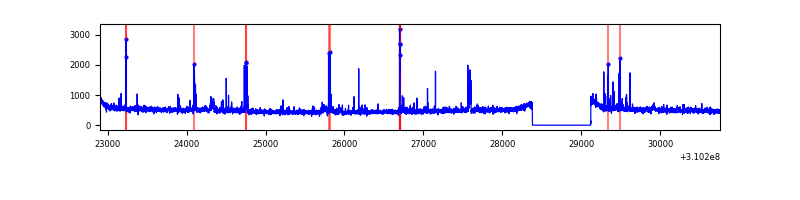 |
| C | 7857 | 7118 | 0 | 0 | 0.00% | 0.00% | 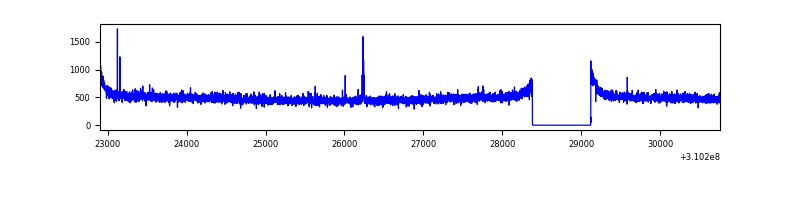 |
| D | 7857 | 7118 | 77 | 77 | 0.98% | 1.08% | 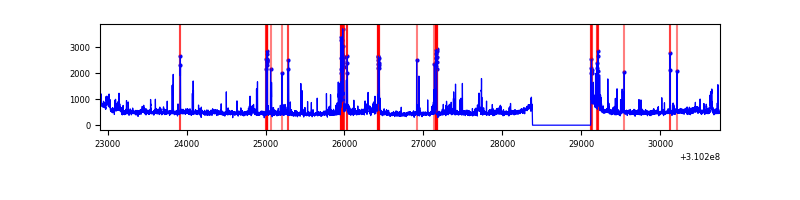 |
Top three noisy pixels from each quadrant. If the there are fewer than three noisy pixels in the level2.evt file, extra rows are filled as -1
| Pixel properties | Quadrant properties | ||||||
|---|---|---|---|---|---|---|---|
| Quadrant | DetID | PixID | Counts | Sigma | Mean | Median | Sigma |
| A | 13 | 254 | 12783 | 65.89 | 896 | 878 | 180.7 |
| A | 0 | 226 | 7844 | 38.55 | 896 | 878 | 180.7 |
| A | 3 | 137 | 7415 | 36.18 | 896 | 878 | 180.7 |
| B | 3 | 64 | 114140 | 670.19 | 884 | 863 | 169.0 |
| B | 0 | 190 | 30047 | 172.66 | 884 | 863 | 169.0 |
| B | 0 | 197 | 21616 | 122.78 | 884 | 863 | 169.0 |
| C | 14 | 238 | 135503 | 676.42 | 854 | 859 | 199.1 |
| C | 10 | 22 | 29887 | 145.83 | 854 | 859 | 199.1 |
| C | 13 | 61 | 5926 | 25.46 | 854 | 859 | 199.1 |
| D | 2 | 133 | 232876 | 1121.69 | 863 | 839 | 206.9 |
| D | 1 | 52 | 192968 | 928.77 | 863 | 839 | 206.9 |
| D | 11 | 176 | 141653 | 680.71 | 863 | 839 | 206.9 |
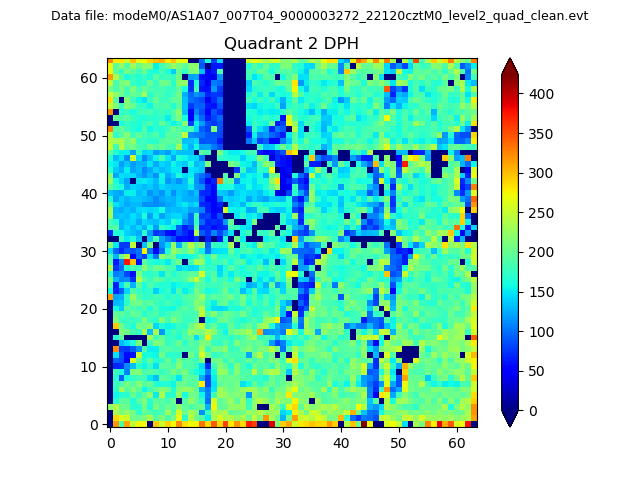
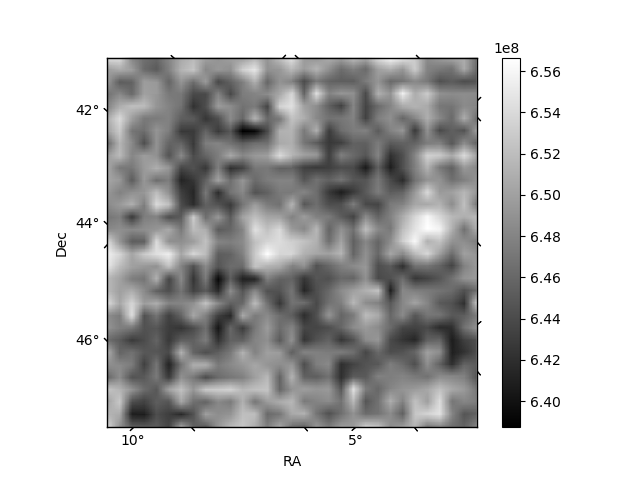
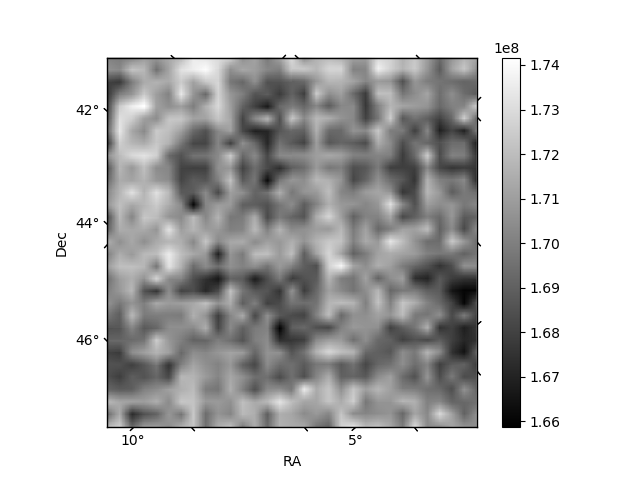
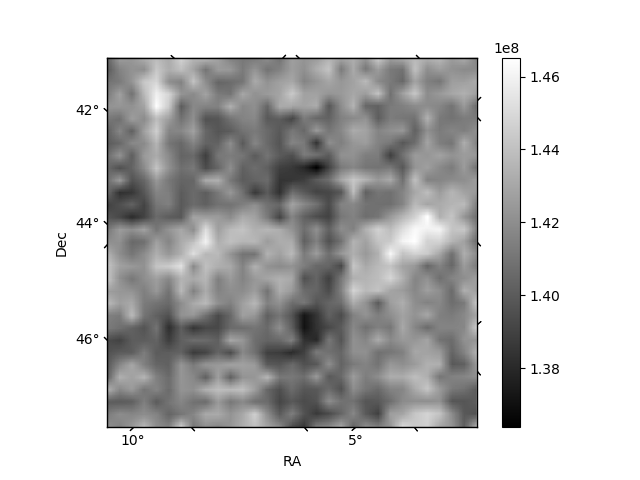
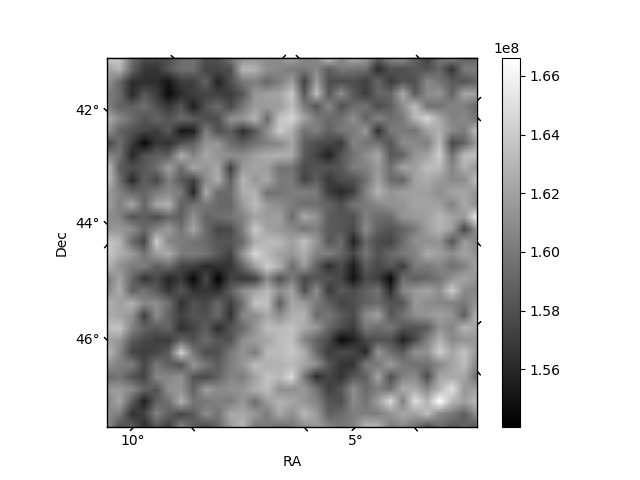
Histogram calculated using DETX and DETY for each event in the final _common_clean file
| Quadrant A | 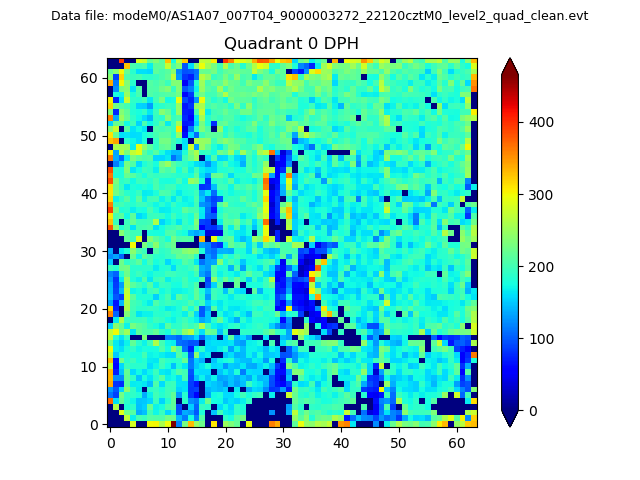 |
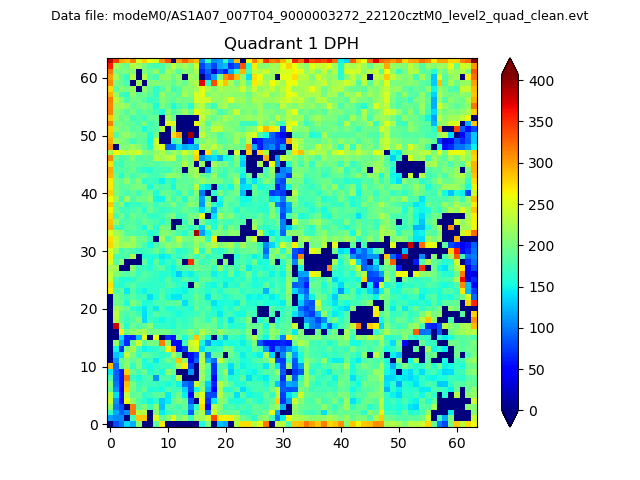 |
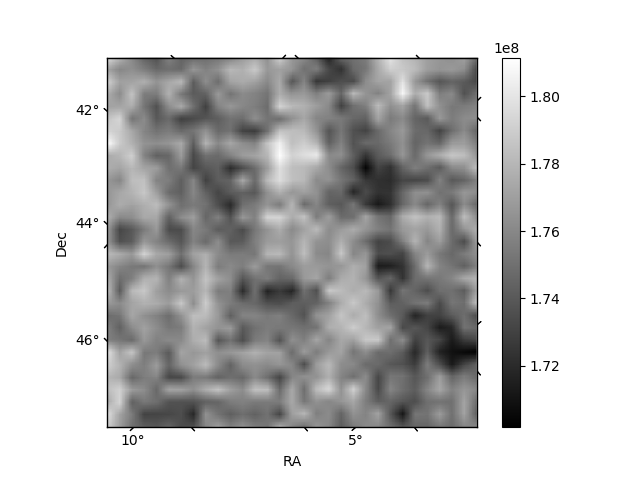
Quadrant B |
|---|---|---|---|
| Quadrant D | 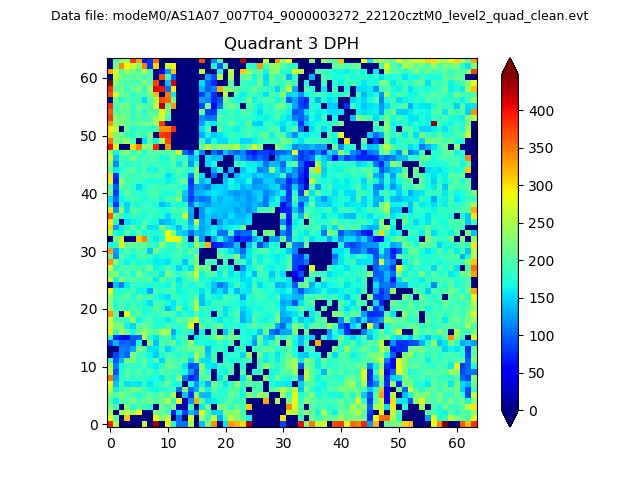 |
 |
Quadrant C |
| Plot type | Count rate plots | Images |
|---|---|---|
| Comparison with Poisson distribution Blue bars denote a histogram of data divided into 1 sec bins. Red curve is a Poisson curve with rate = median count rate of data. |
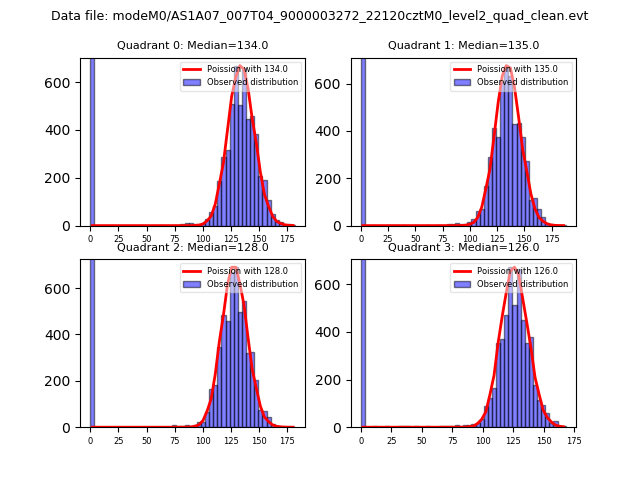 |
 |
| Quadrant-wise count rates Data is divided into 100 sec bins |
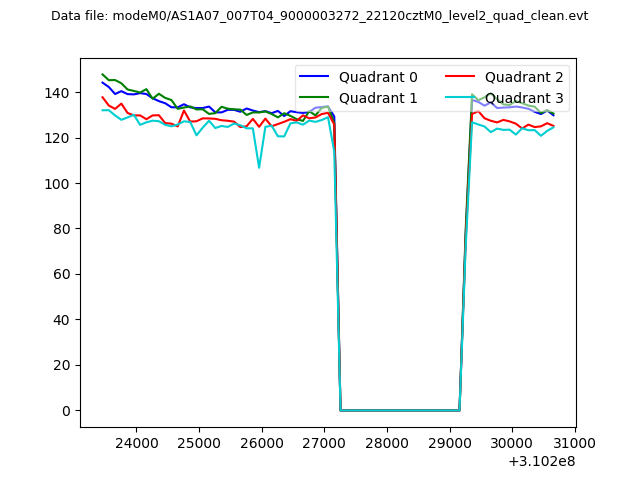 |
|
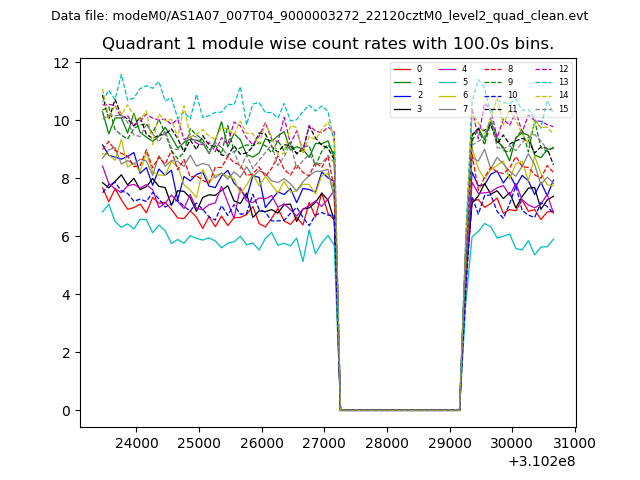
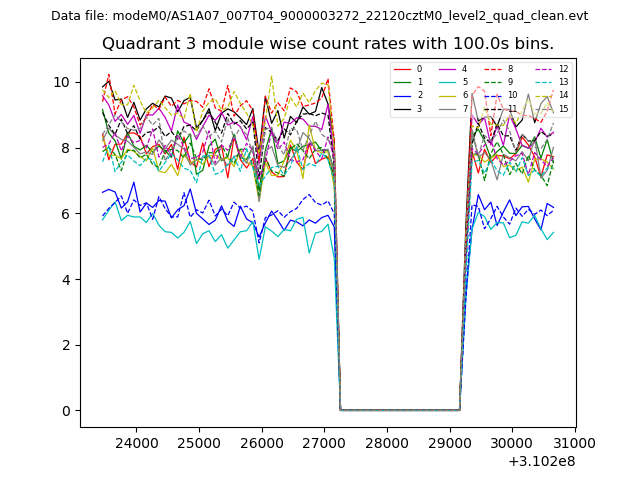
| Module-wise count rates for Quadrant A Data is divided into 100 sec bins |
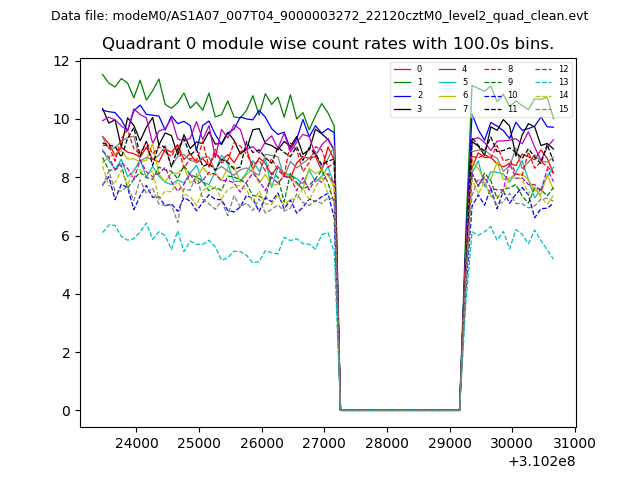 |
 |
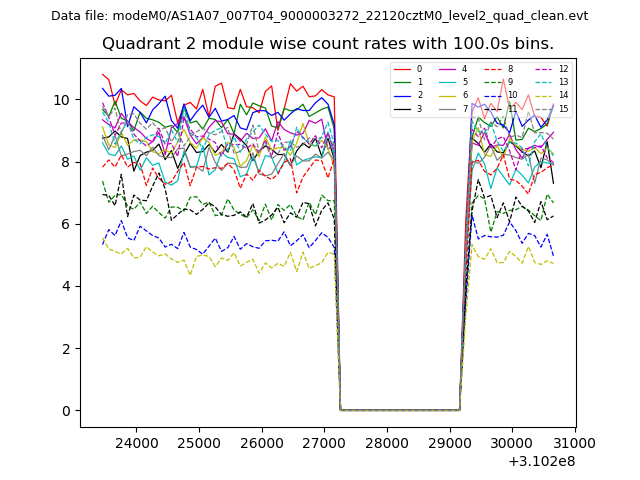
| Module-wise count rates for Quadrant B Data is divided into 100 sec bins |
 |
 |
| Module-wise count rates for Quadrant C Data is divided into 100 sec bins |
 |
 |
| Module-wise count rates for Quadrant D Data is divided into 100 sec bins |
 |
 |
| Parameter | Plot |
|---|---|
| CZT HV Monitor | 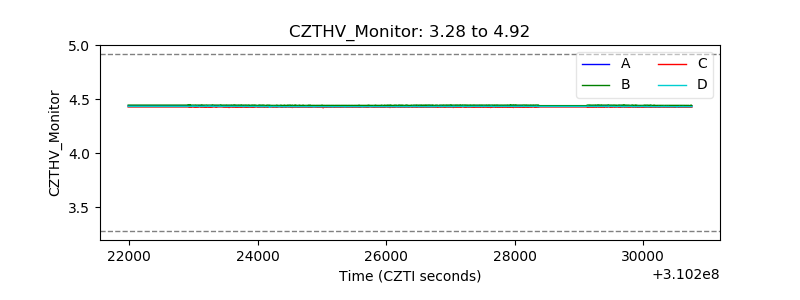 |
| D_VDD | 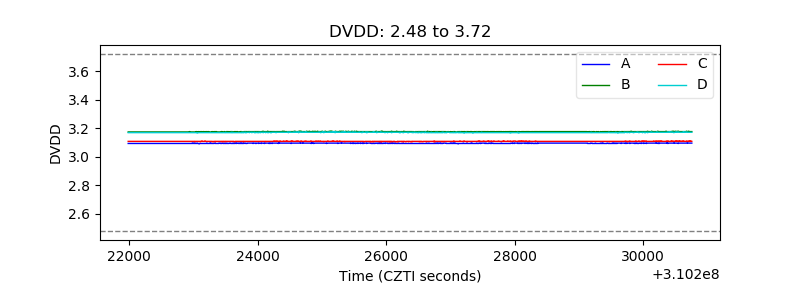 |
| Temperature 1 | 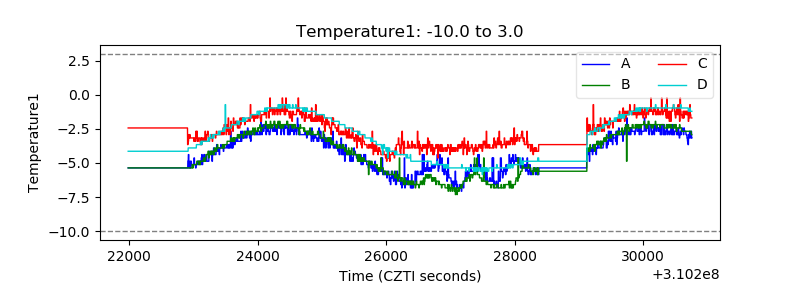 |
| Veto HV Monitor | 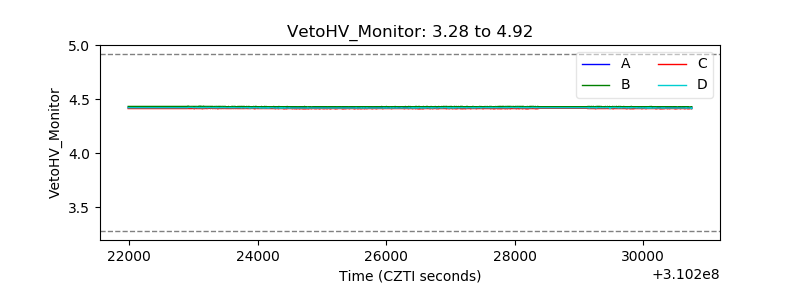 |
| Veto LLD | 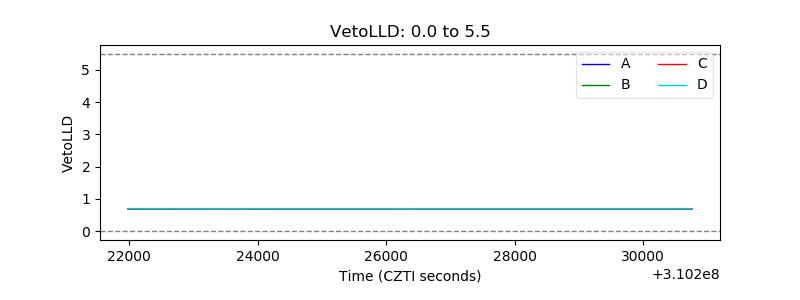 |
| Alpha Counter | 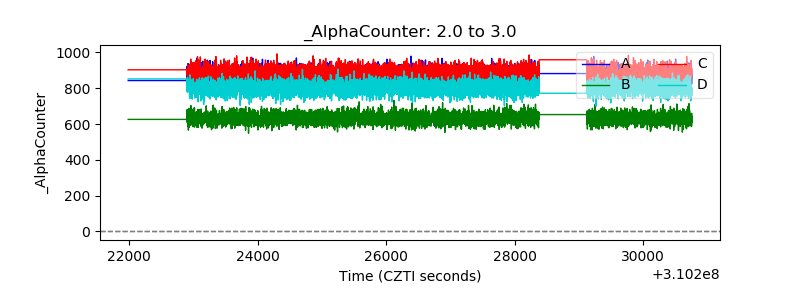 |
| _CPM_Rate | 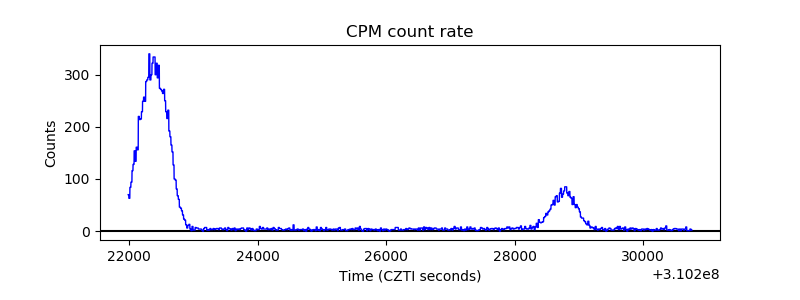 |
| CZT Counter | 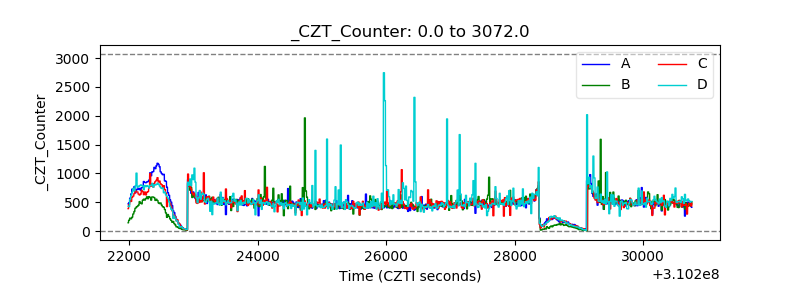 |
| +2.5 Volts monitor |  |
| +5 Volts monitor | 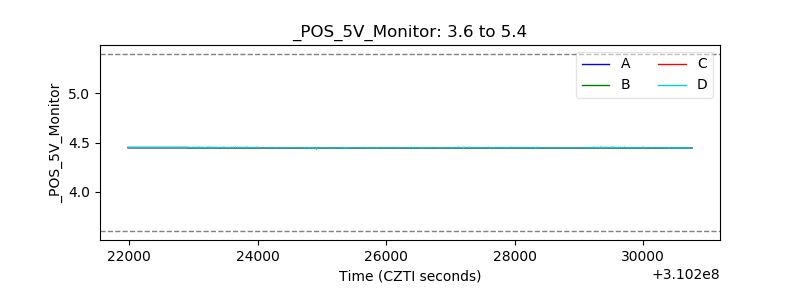 |
| _ROLL_ROT | 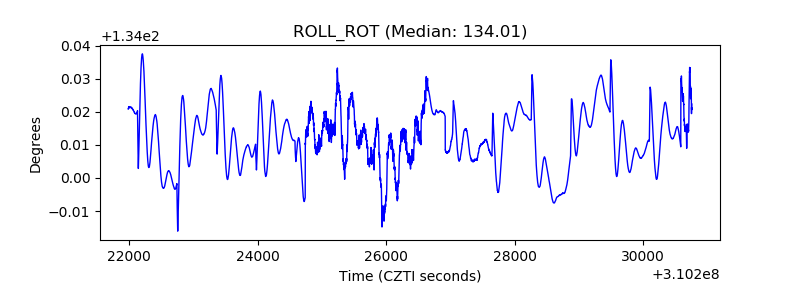 |
| _Roll_DEC | 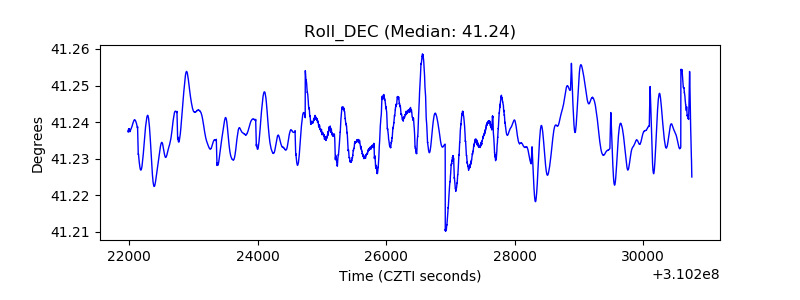 |
| _Roll_RA | 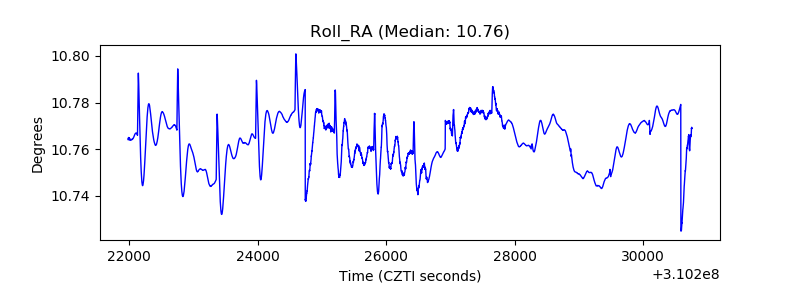 |
| Veto Counter | 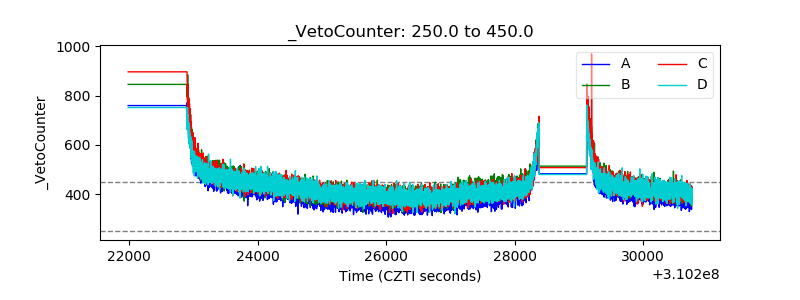 |