| Param | Original file | Final file |
|---|---|---|
| Filename | modeM0/AS1A07_007T04_9000003272_22121cztM0_level2.evt | modeM0/AS1A07_007T04_9000003272_22121cztM0_level2_quad_clean.evt |
| Size (bytes) | 476,438,400 | 99,855,360 |
| Size | 454.4 MB | 95.2 MB |
| Events in quadrant A | 3,303,154 | 655,041 |
| Events in quadrant B | 3,652,324 | 648,335 |
| Events in quadrant C | 3,319,443 | 627,304 |
| Events in quadrant D | 3,684,560 | 612,210 |
| Mode M9 | |||
|---|---|---|---|
| Quadrant | BADHDUFLAG | Total packets | Discarded packets |
| A | 0 | 4 | 0 |
| B | 0 | 4 | 0 |
| C | 0 | 4 | 0 |
| D | 0 | 4 | 0 |
| Mode SS | |||
|---|---|---|---|
| Quadrant | BADHDUFLAG | Total packets | Discarded packets |
| A | 0 | 140 | 0 |
| B | 0 | 140 | 0 |
| C | 0 | 140 | 0 |
| D | 0 | 140 | 0 |
| Mode M0 | |||
|---|---|---|---|
| Quadrant | BADHDUFLAG | Total packets | Discarded packets |
| A | 0 | 14291 | 1 |
| B | 0 | 15225 | 1 |
| C | 0 | 14249 | 1 |
| D | 0 | 15439 | 1 |
| Quadrant | Total seconds | Saturated seconds | Saturation percentage |
|---|---|---|---|
| A | 6908 | 74 | 1.071222% |
| B | 6908 | 213 | 3.083382% |
| C | 6909 | 112 | 1.621074% |
| D | 6909 | 128 | 1.852656% |
Noise dominated data is calculated using 1-second bins in cleaned event files. If a bin has >2000 counts, and if more than 50% of those come from <1% of pixels, then it is considered to be noise-dominated and hence unusable.
| Quadrant | # 1 sec bins | Bins with >0 counts | Bins with >2000 counts | High rate bins dominated by noise | Noise dominated (total time) | Noise dominated (detector-on time) | Marked lightcurve |
|---|---|---|---|---|---|---|---|
| A | 7273 | 6909 | 0 | 0 | 0.00% | 0.00% | 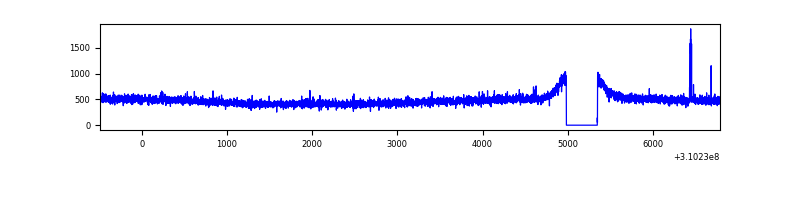 |
| B | 7273 | 6909 | 84 | 84 | 1.15% | 1.22% | 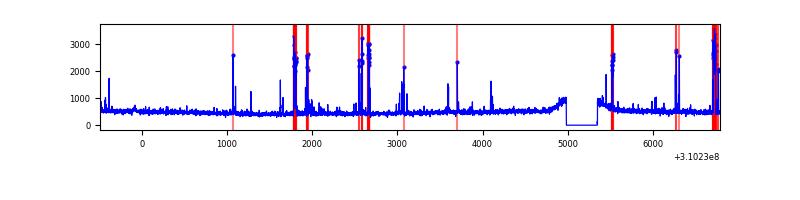 |
| C | 7274 | 6910 | 0 | 0 | 0.00% | 0.00% | 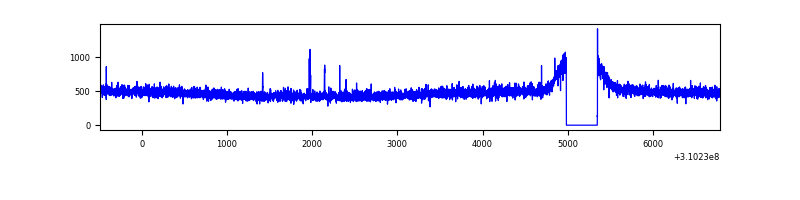 |
| D | 7274 | 6910 | 72 | 72 | 0.99% | 1.04% | 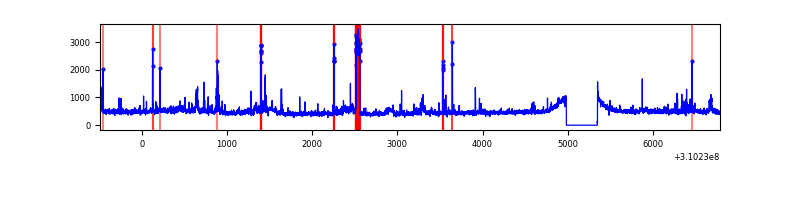 |
Top three noisy pixels from each quadrant. If the there are fewer than three noisy pixels in the level2.evt file, extra rows are filled as -1
| Pixel properties | Quadrant properties | ||||||
|---|---|---|---|---|---|---|---|
| Quadrant | DetID | PixID | Counts | Sigma | Mean | Median | Sigma |
| A | 5 | 16 | 15580 | 85.69 | 852 | 834 | 172.1 |
| A | 13 | 254 | 13139 | 71.5 | 852 | 834 | 172.1 |
| A | 3 | 137 | 7332 | 37.76 | 852 | 834 | 172.1 |
| B | 3 | 64 | 196658 | 1217.23 | 835 | 814 | 160.9 |
| B | 10 | 246 | 142006 | 877.55 | 835 | 814 | 160.9 |
| B | 0 | 230 | 21344 | 127.6 | 835 | 814 | 160.9 |
| C | 14 | 238 | 128472 | 670.31 | 814 | 820 | 190.4 |
| C | 10 | 22 | 18553 | 93.12 | 814 | 820 | 190.4 |
| C | 13 | 61 | 5706 | 25.66 | 814 | 820 | 190.4 |
| D | 1 | 52 | 307645 | 1549.65 | 826 | 803 | 198.0 |
| D | 2 | 133 | 127787 | 641.31 | 826 | 803 | 198.0 |
| D | 7 | 238 | 39189 | 193.86 | 826 | 803 | 198.0 |
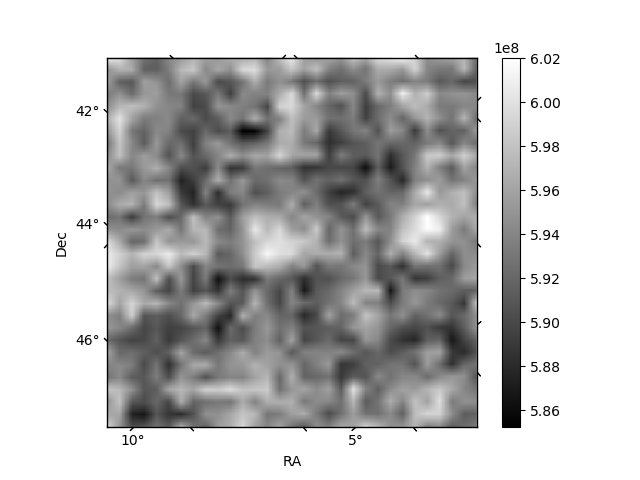
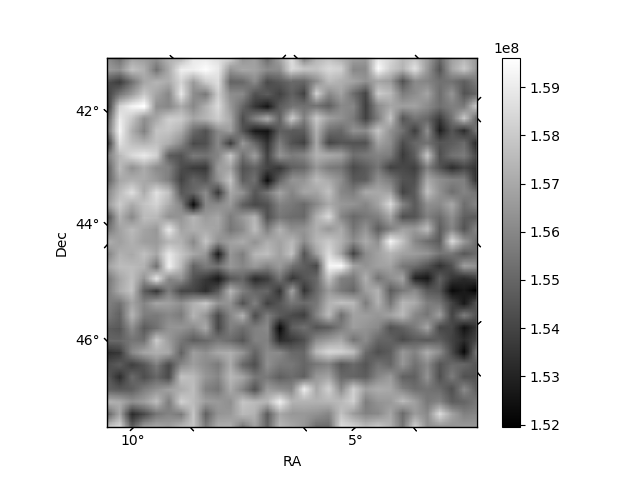
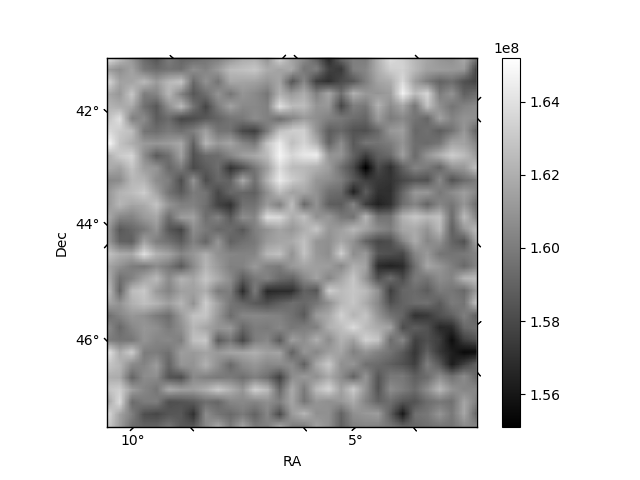
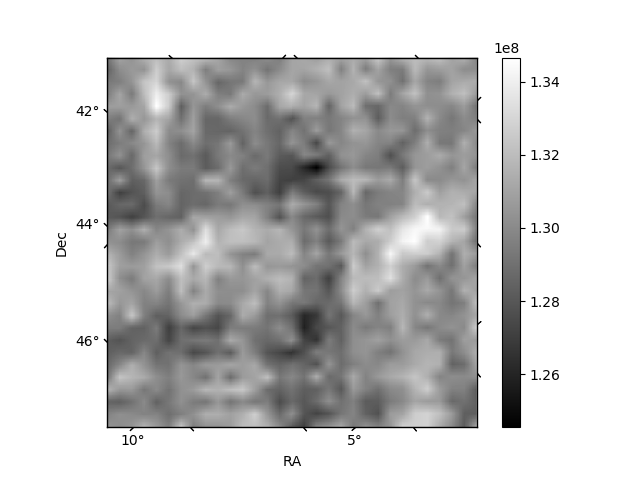
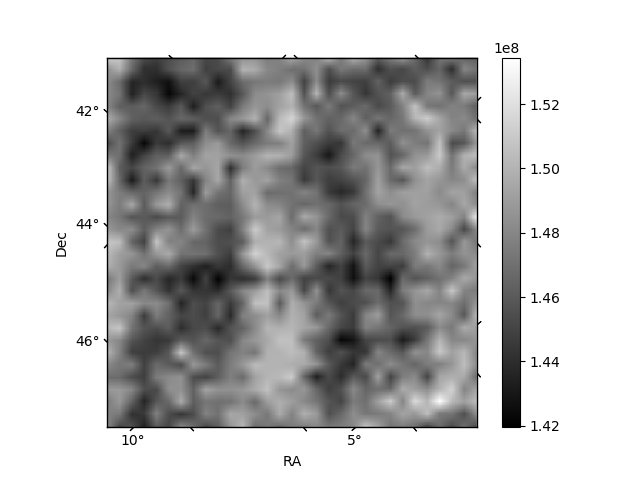
Histogram calculated using DETX and DETY for each event in the final _common_clean file
| Quadrant A | 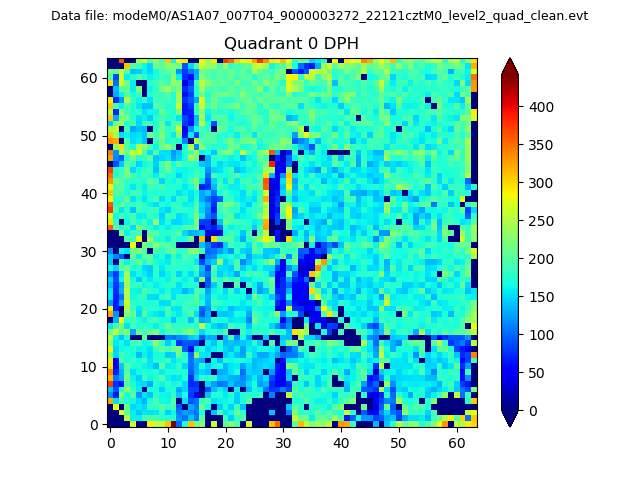 |
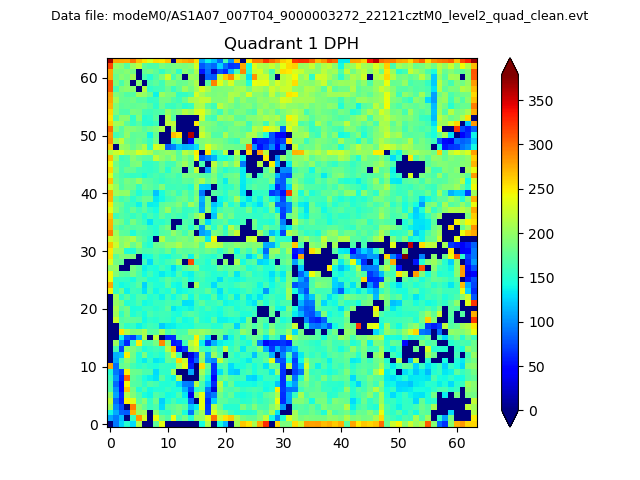 |
Quadrant B |
|---|---|---|---|
| Quadrant D |  |
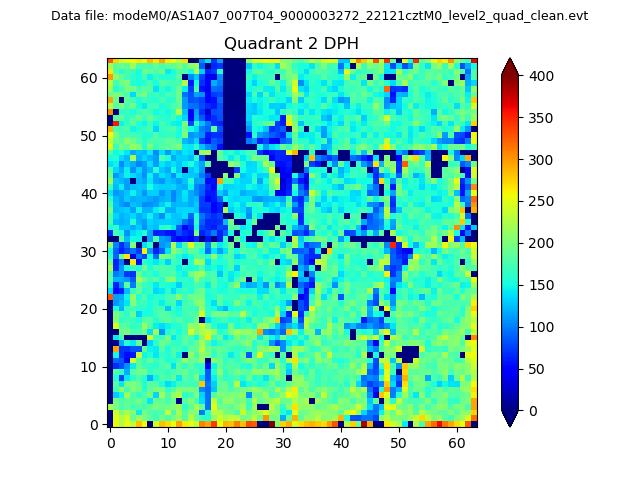 |
Quadrant C |
| Plot type | Count rate plots | Images |
|---|---|---|
| Comparison with Poisson distribution Blue bars denote a histogram of data divided into 1 sec bins. Red curve is a Poisson curve with rate = median count rate of data. |
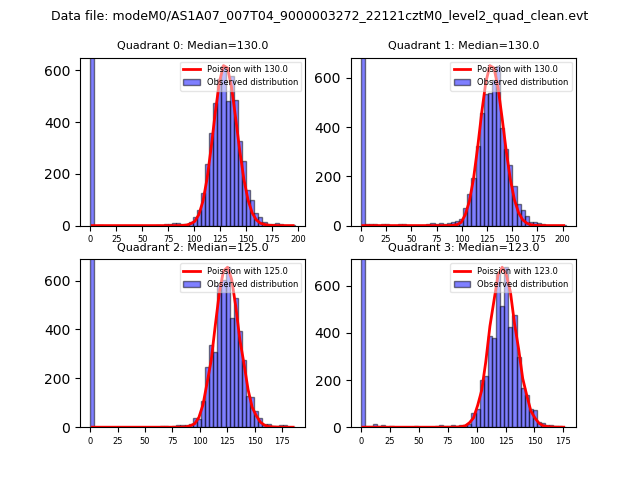 |
 |
| Quadrant-wise count rates Data is divided into 100 sec bins |
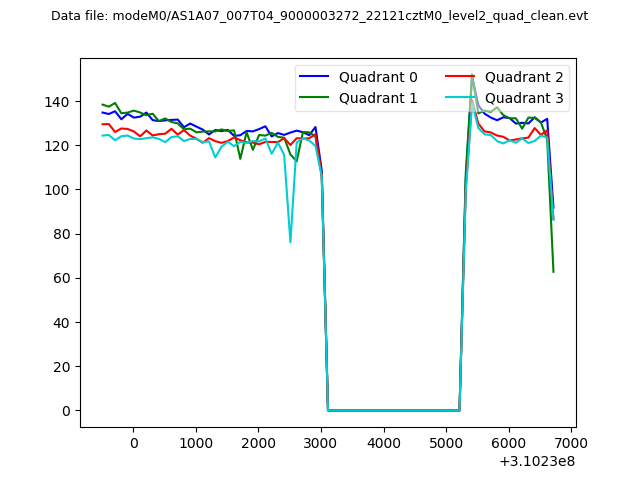 |
|
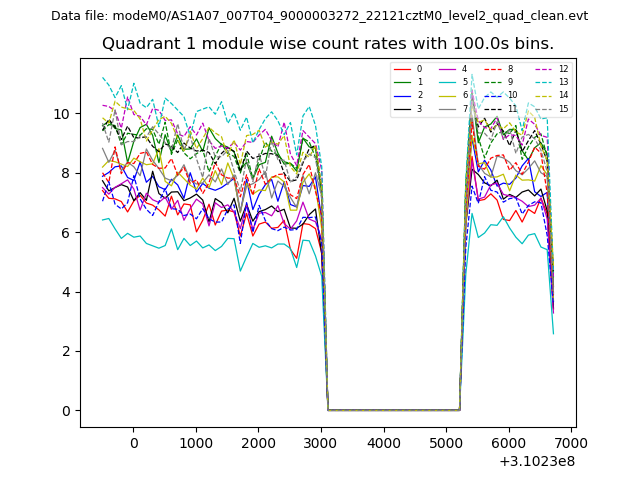
| Module-wise count rates for Quadrant A Data is divided into 100 sec bins |
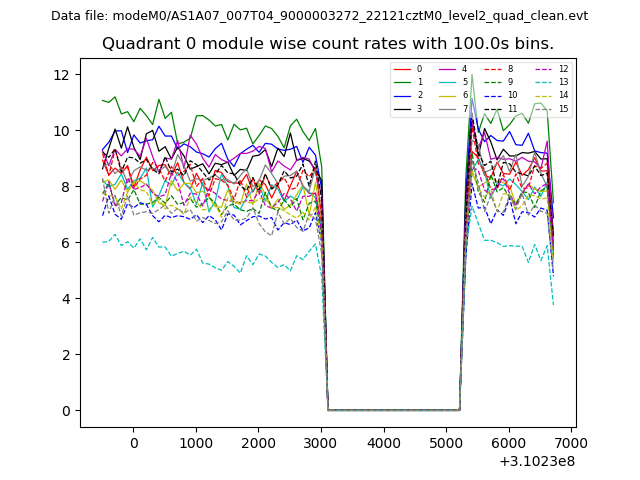 |
 |
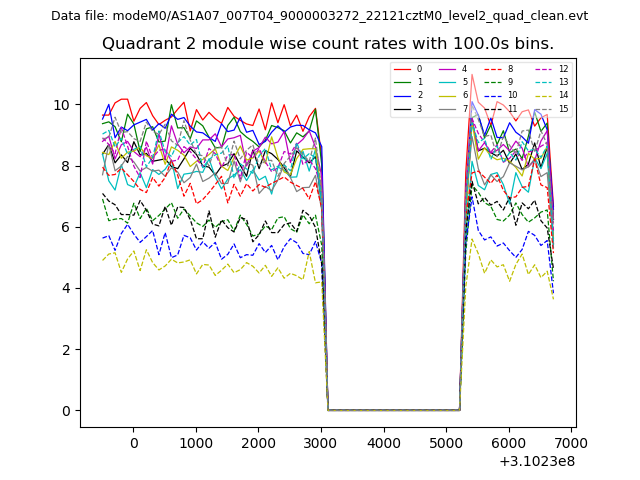
| Module-wise count rates for Quadrant B Data is divided into 100 sec bins |
 |
 |
| Module-wise count rates for Quadrant C Data is divided into 100 sec bins |
 |
 |
| Module-wise count rates for Quadrant D Data is divided into 100 sec bins |
 |
 |
| Parameter | Plot |
|---|---|
| CZT HV Monitor |  |
| D_VDD | 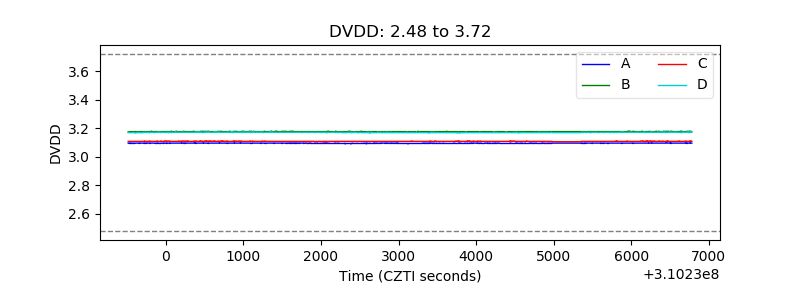 |
| Temperature 1 | 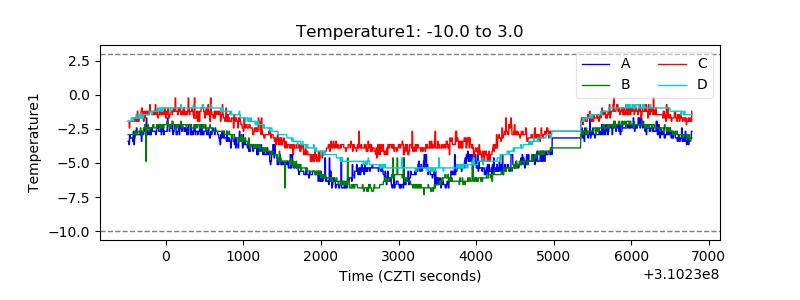 |
| Veto HV Monitor | 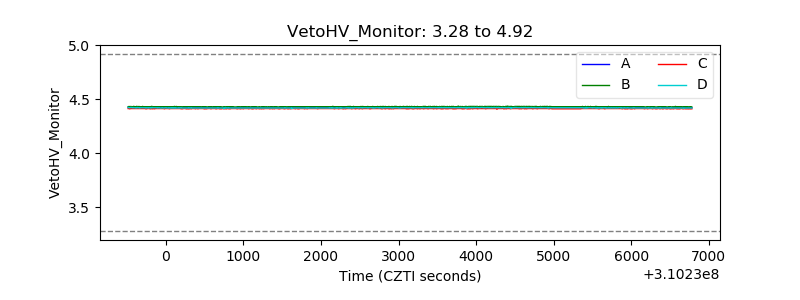 |
| Veto LLD | 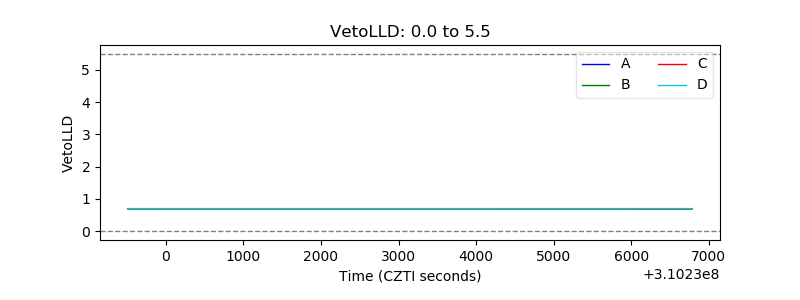 |
| Alpha Counter | 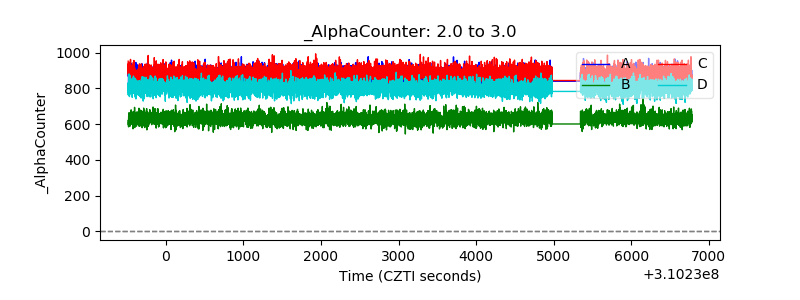 |
| _CPM_Rate | 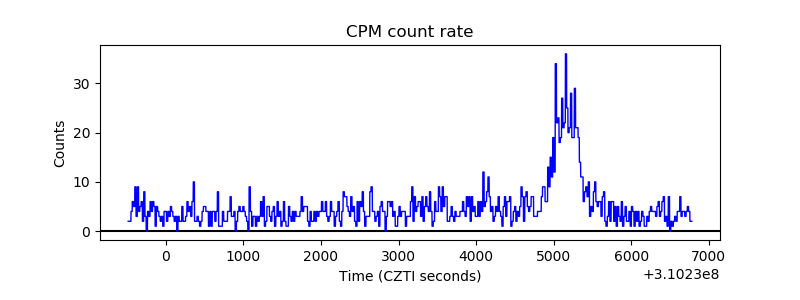 |
| CZT Counter | 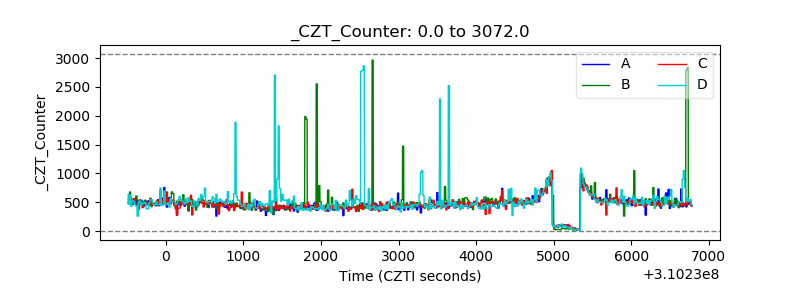 |
| +2.5 Volts monitor |  |
| +5 Volts monitor |  |
| _ROLL_ROT |  |
| _Roll_DEC | 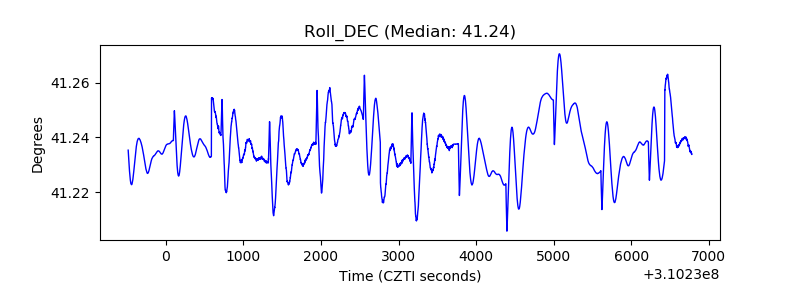 |
| _Roll_RA | 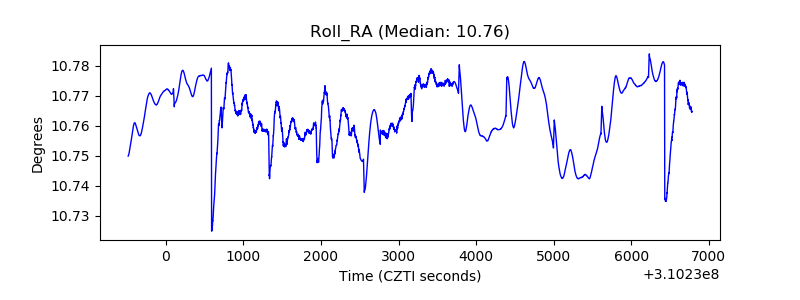 |
| Veto Counter | 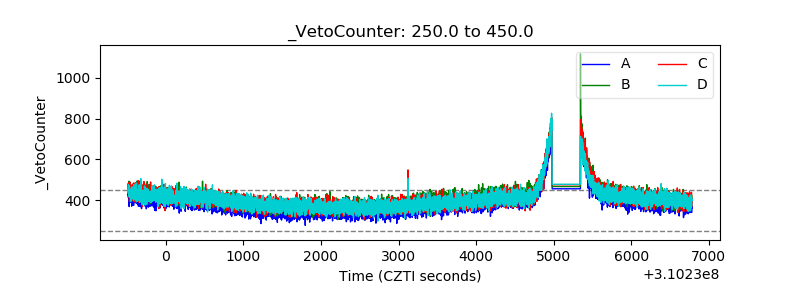 |