| Param | Original file | Final file |
|---|---|---|
| Filename | modeM0/AS1T03_145T01_9000003278cztM0_level2.fits | modeM0/AS1T03_145T01_9000003278cztM0_level2_quad_clean.evt |
| Size (bytes) | 1,938,611,520 | 1,654,994,880 |
| Size | 1.8 GB | 1.5 GB |
| Events in quadrant A | 12,142,816 | 9,789,156 |
| Events in quadrant B | 11,607,224 | 9,800,983 |
| Events in quadrant C | 11,840,456 | 9,279,901 |
| Events in quadrant D | 9,995,782 | 8,128,699 |
| Mode M0 | |||
|---|---|---|---|
| Quadrant | BADHDUFLAG | Total packets | Discarded packets |
| A | 0 | 399180 | 0 |
| B | 0 | 408718 | 0 |
| C | 0 | 407067 | 0 |
| D | 0 | 521495 | 0 |
| Mode SS | |||
|---|---|---|---|
| Quadrant | BADHDUFLAG | Total packets | Discarded packets |
| A | 0 | 3898 | 0 |
| B | 0 | 3898 | 0 |
| C | 0 | 3898 | 0 |
| D | 0 | 3898 | 0 |
| Mode M9 | |||
|---|---|---|---|
| Quadrant | BADHDUFLAG | Total packets | Discarded packets |
| A | 0 | 332 | 0 |
| B | 0 | 333 | 0 |
| C | 0 | 333 | 0 |
| D | 0 | 333 | 0 |
| Quadrant | Total seconds | Saturated seconds | Saturation percentage |
|---|---|---|---|
| A | 191569 | 2031 | 1.060192% |
| B | 191568 | 2845 | 1.485112% |
| C | 191568 | 3310 | 1.727846% |
| D | 191567 | 13284 | 6.934388% |
Noise dominated data is calculated using 1-second bins in cleaned event files. If a bin has >2000 counts, and if more than 50% of those come from <1% of pixels, then it is considered to be noise-dominated and hence unusable.
| Quadrant | # 1 sec bins | Bins with >0 counts | Bins with >2000 counts | High rate bins dominated by noise | Noise dominated (total time) | Noise dominated (detector-on time) | Marked lightcurve |
|---|---|---|---|---|---|---|---|
| A | 235152 | 191569 | 0 | 0 | 0.00% | 0.00% |  |
| B | 235151 | 191561 | 0 | 0 | 0.00% | 0.00% | 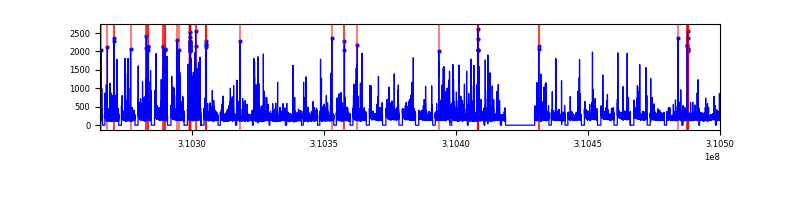 |
| C | 235151 | 191566 | 0 | 0 | 0.00% | 0.00% |  |
| D | 235150 | 190835 | 0 | 0 | 0.00% | 0.00% |  |
Top three noisy pixels from each quadrant. If the there are fewer than three noisy pixels in the level2.evt file, extra rows are filled as -1
| Pixel properties | Quadrant properties | ||||||
|---|---|---|---|---|---|---|---|
| Quadrant | DetID | PixID | Counts | Sigma | Mean | Median | Sigma |
| A | 0 | 29 | 11518 | 11.1 | 3162 | 2976 | 769.3 |
| A | 7 | 110 | 9650 | 8.68 | 3162 | 2976 | 769.3 |
| A | 0 | 30 | 9186 | 8.07 | 3162 | 2976 | 769.3 |
| B | 2 | 9 | 9372 | 10.83 | 3074 | 2942 | 593.8 |
| B | 2 | 8 | 7730 | 8.06 | 3074 | 2942 | 593.8 |
| B | 5 | 128 | 7644 | 7.92 | 3074 | 2942 | 593.8 |
| C | 1 | 81 | 8938 | 7.55 | 3126 | 2937 | 794.4 |
| C | 1 | 80 | 8923 | 7.54 | 3126 | 2937 | 794.4 |
| C | 3 | 234 | 8147 | 6.56 | 3126 | 2937 | 794.4 |
| D | 3 | 14 | 7279 | 6.24 | 2858 | 2620 | 746.0 |
| D | 10 | 189 | 7177 | 6.11 | 2858 | 2620 | 746.0 |
| D | 6 | 231 | 7076 | 5.97 | 2858 | 2620 | 746.0 |
Histogram calculated using DETX and DETY for each event in the final _common_clean file
| Quadrant A |  |
 |
Quadrant B |
|---|---|---|---|
| Quadrant D | 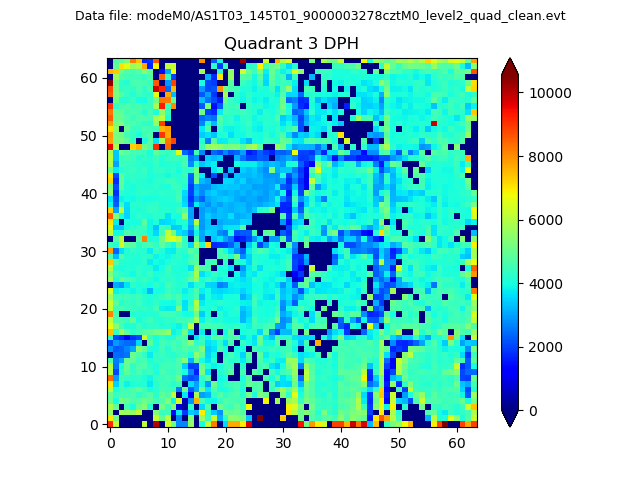 |
 |
Quadrant C |
| Plot type | Count rate plots | Images |
|---|---|---|
| Comparison with Poisson distribution Blue bars denote a histogram of data divided into 1 sec bins. Red curve is a Poisson curve with rate = median count rate of data. |
 |
 |
| Quadrant-wise count rates Data is divided into 100 sec bins |
 |
|
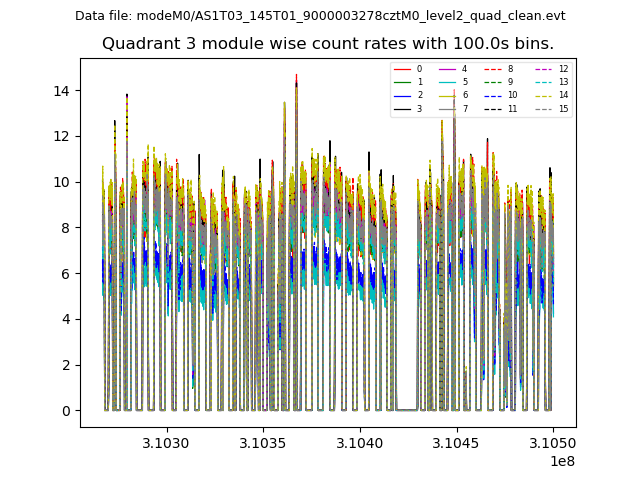
| Module-wise count rates for Quadrant A Data is divided into 100 sec bins |
 |
 |
| Module-wise count rates for Quadrant B Data is divided into 100 sec bins |
 |
 |
| Module-wise count rates for Quadrant C Data is divided into 100 sec bins |
 |
 |
| Module-wise count rates for Quadrant D Data is divided into 100 sec bins |
 |
 |
| Parameter | Plot |
|---|---|
| CZT HV Monitor | 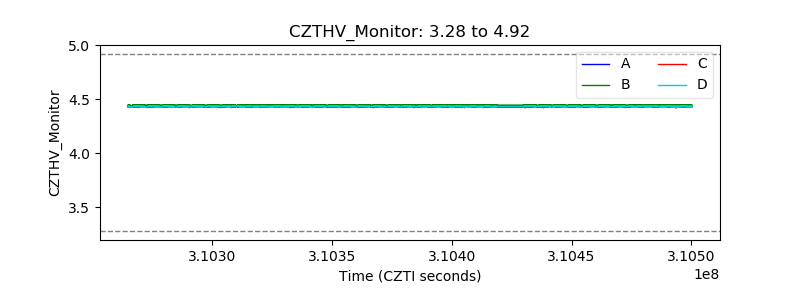 |
| D_VDD | 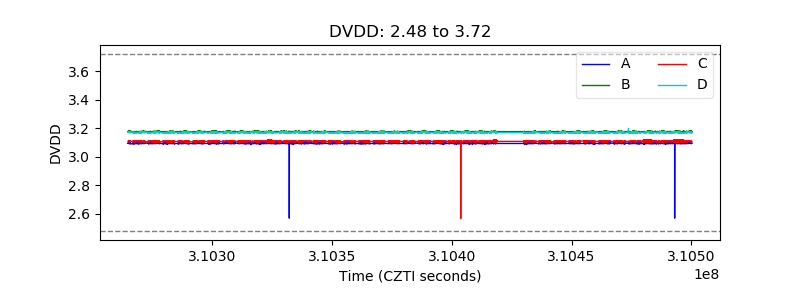 |
| Temperature 1 | 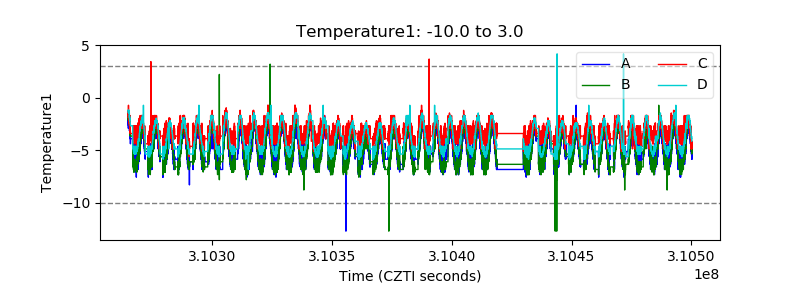 |
| Veto HV Monitor | 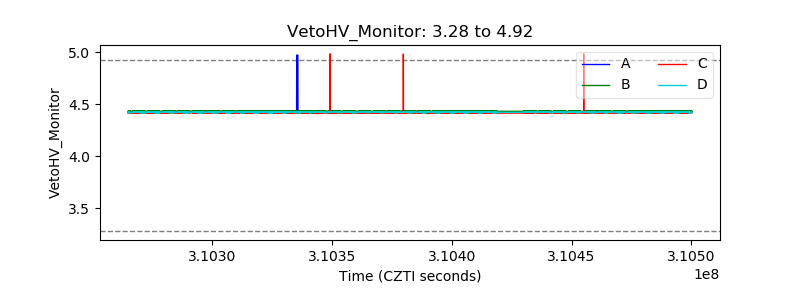 |
| Veto LLD |  |
| Alpha Counter | 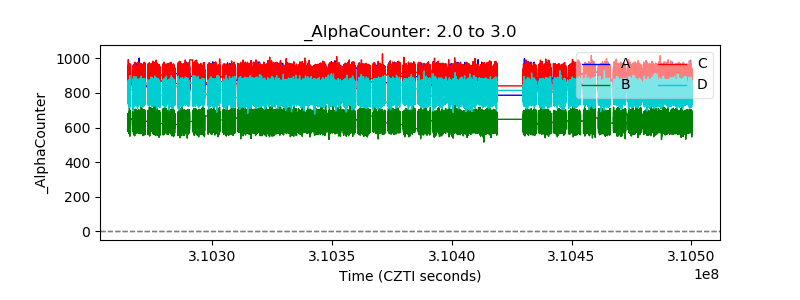 |
| _CPM_Rate |  |
| CZT Counter |  |
| +2.5 Volts monitor |  |
| +5 Volts monitor |  |
| _ROLL_ROT | 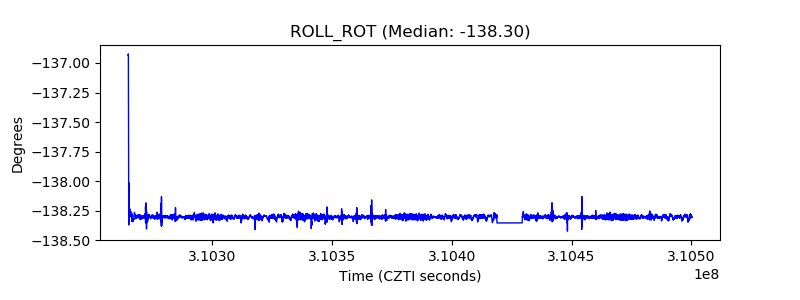 |
| _Roll_DEC |  |
| _Roll_RA | 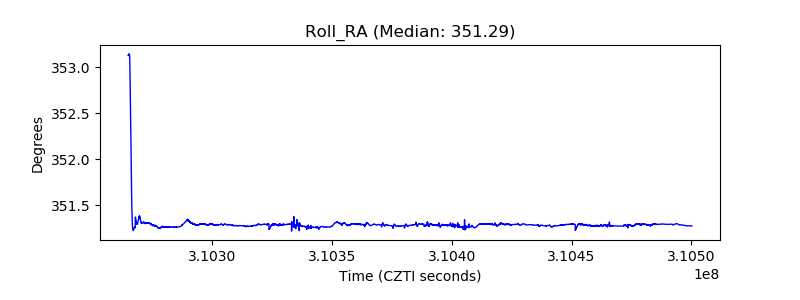 |
| Veto Counter |  |