| Param | Original file | Final file |
|---|---|---|
| Filename | modeM0/AS1T03_145T01_9000003278_22126cztM0_level2.evt | modeM0/AS1T03_145T01_9000003278_22126cztM0_level2_quad_clean.evt |
| Size (bytes) | 173,954,880 | 39,173,760 |
| Size | 165.9 MB | 37.4 MB |
| Events in quadrant A | 1,168,026 | 258,429 |
| Events in quadrant B | 1,294,105 | 263,009 |
| Events in quadrant C | 1,180,765 | 250,466 |
| Events in quadrant D | 1,459,137 | 240,487 |
| Mode M0 | |||
|---|---|---|---|
| Quadrant | BADHDUFLAG | Total packets | Discarded packets |
| A | 0 | 4937 | 1 |
| B | 0 | 5305 | 1 |
| C | 0 | 4945 | 1 |
| D | 0 | 5900 | 1 |
| Mode SS | |||
|---|---|---|---|
| Quadrant | BADHDUFLAG | Total packets | Discarded packets |
| A | 0 | 48 | 0 |
| B | 0 | 48 | 0 |
| C | 0 | 48 | 0 |
| D | 0 | 48 | 0 |
| Mode M9 | |||
|---|---|---|---|
| Quadrant | BADHDUFLAG | Total packets | Discarded packets |
| A | 0 | 10 | 0 |
| B | 0 | 10 | 0 |
| C | 0 | 10 | 0 |
| D | 0 | 10 | 0 |
| Quadrant | Total seconds | Saturated seconds | Saturation percentage |
|---|---|---|---|
| A | 2419 | 15 | 0.620091% |
| B | 2419 | 18 | 0.744109% |
| C | 2419 | 19 | 0.785449% |
| D | 2418 | 117 | 4.838710% |
Noise dominated data is calculated using 1-second bins in cleaned event files. If a bin has >2000 counts, and if more than 50% of those come from <1% of pixels, then it is considered to be noise-dominated and hence unusable.
| Quadrant | # 1 sec bins | Bins with >0 counts | Bins with >2000 counts | High rate bins dominated by noise | Noise dominated (total time) | Noise dominated (detector-on time) | Marked lightcurve |
|---|---|---|---|---|---|---|---|
| A | 3339 | 2420 | 0 | 0 | 0.00% | 0.00% | 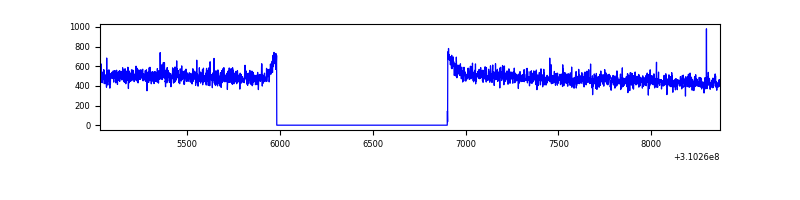 |
| B | 3339 | 2420 | 3 | 3 | 0.09% | 0.12% | 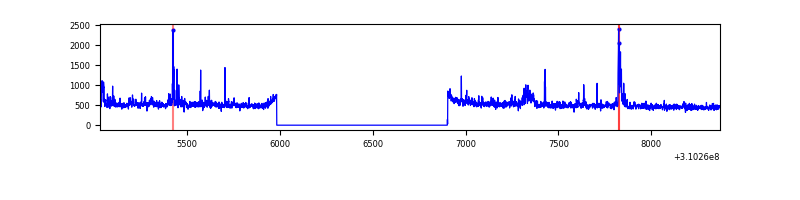 |
| C | 3339 | 2420 | 0 | 0 | 0.00% | 0.00% | 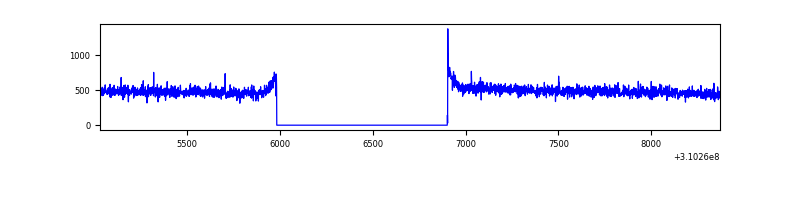 |
| D | 3338 | 2419 | 96 | 96 | 2.88% | 3.97% | 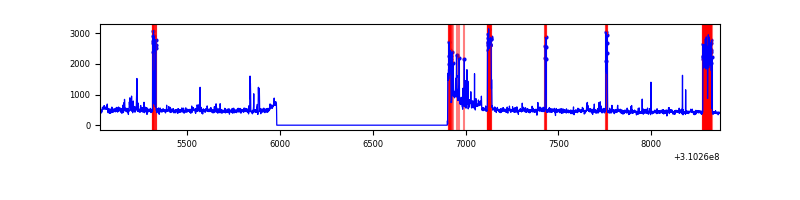 |
Top three noisy pixels from each quadrant. If the there are fewer than three noisy pixels in the level2.evt file, extra rows are filled as -1
| Pixel properties | Quadrant properties | ||||||
|---|---|---|---|---|---|---|---|
| Quadrant | DetID | PixID | Counts | Sigma | Mean | Median | Sigma |
| A | 13 | 254 | 4337 | 63.92 | 302 | 296 | 63.2 |
| A | 3 | 137 | 2630 | 36.92 | 302 | 296 | 63.2 |
| A | 0 | 226 | 2539 | 35.48 | 302 | 296 | 63.2 |
| B | 3 | 64 | 37886 | 627.74 | 304 | 296 | 59.9 |
| B | 0 | 230 | 24465 | 403.61 | 304 | 296 | 59.9 |
| B | 0 | 197 | 23661 | 390.18 | 304 | 296 | 59.9 |
| C | 14 | 238 | 46178 | 655.15 | 290 | 293 | 70.0 |
| C | 0 | 10 | 2702 | 34.4 | 290 | 293 | 70.0 |
| C | 13 | 61 | 2085 | 25.59 | 290 | 293 | 70.0 |
| D | 1 | 52 | 245517 | 3482.15 | 283 | 276 | 70.4 |
| D | 11 | 176 | 62203 | 879.29 | 283 | 276 | 70.4 |
| D | 13 | 172 | 32978 | 464.33 | 283 | 276 | 70.4 |
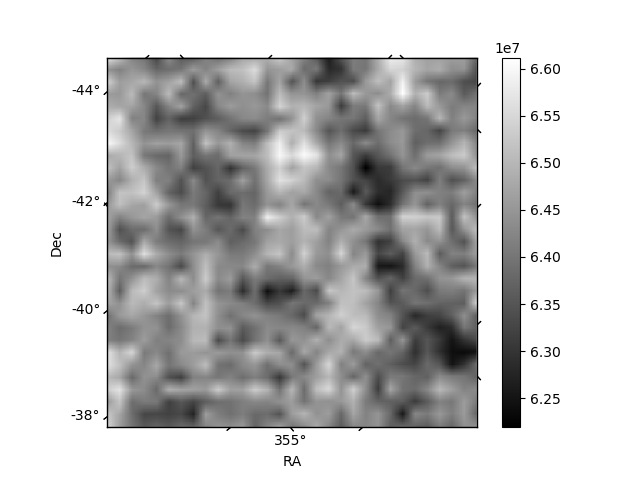
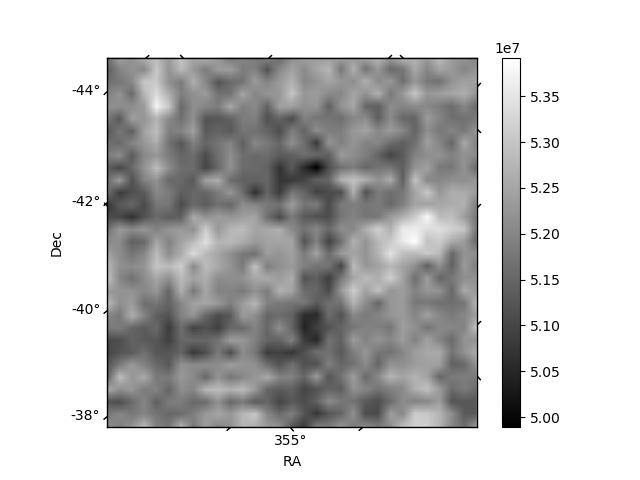
Histogram calculated using DETX and DETY for each event in the final _common_clean file
| Quadrant A | 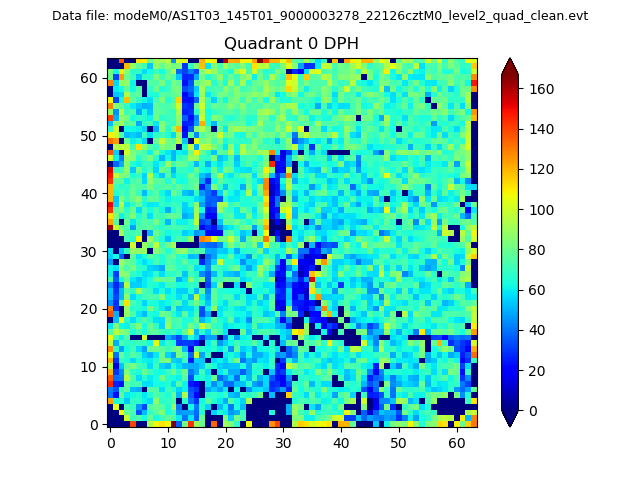 |
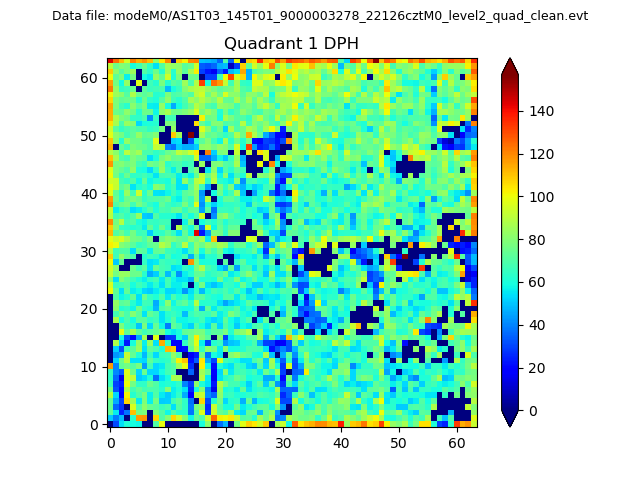 |
Quadrant B |
|---|---|---|---|
| Quadrant D | 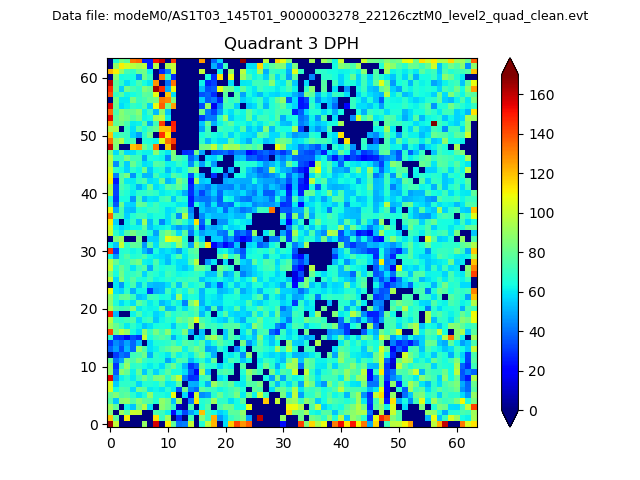 |
 |
Quadrant C |
| Plot type | Count rate plots | Images |
|---|---|---|
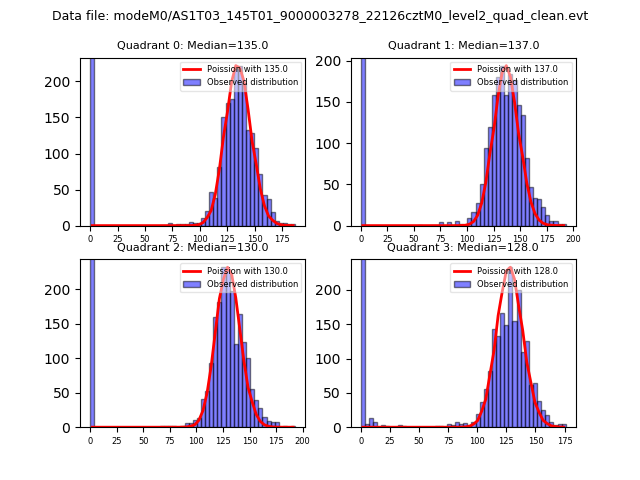
| Comparison with Poisson distribution Blue bars denote a histogram of data divided into 1 sec bins. Red curve is a Poisson curve with rate = median count rate of data. |
 |
 |
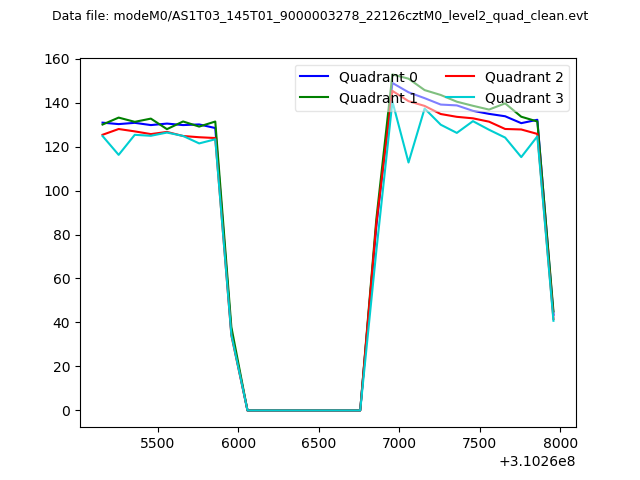
| Quadrant-wise count rates Data is divided into 100 sec bins |
 |
|
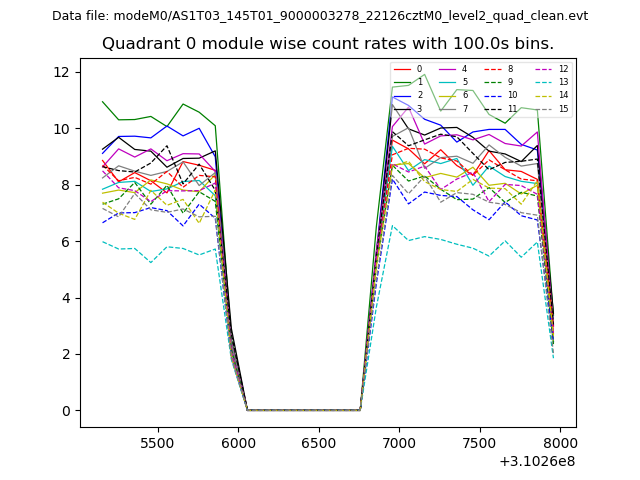
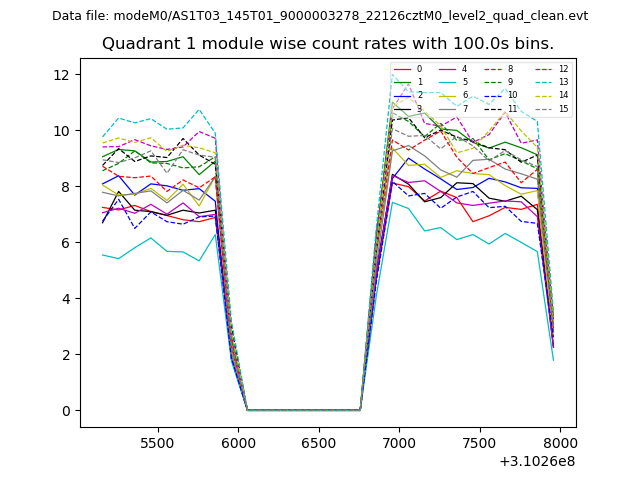
| Module-wise count rates for Quadrant A Data is divided into 100 sec bins |
 |
 |
| Module-wise count rates for Quadrant B Data is divided into 100 sec bins |
 |
 |
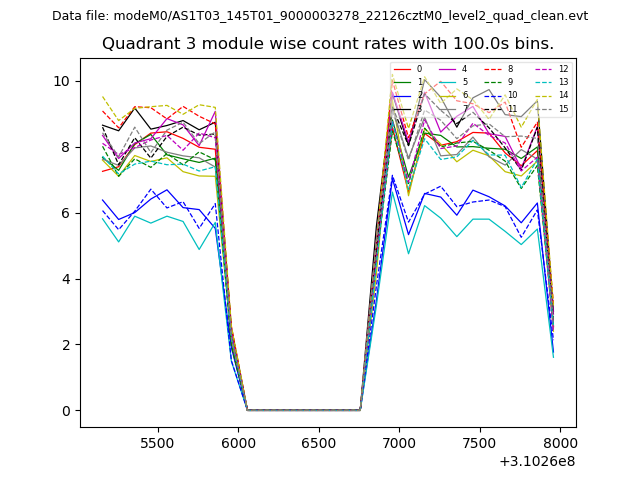
| Module-wise count rates for Quadrant C Data is divided into 100 sec bins |
 |
 |
| Module-wise count rates for Quadrant D Data is divided into 100 sec bins |
 |
 |
| Parameter | Plot |
|---|---|
| CZT HV Monitor | 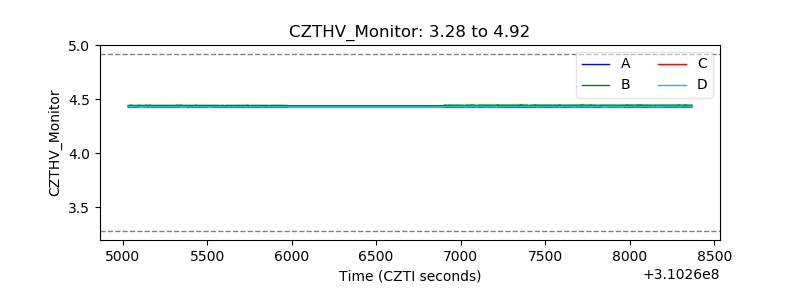 |
| D_VDD | 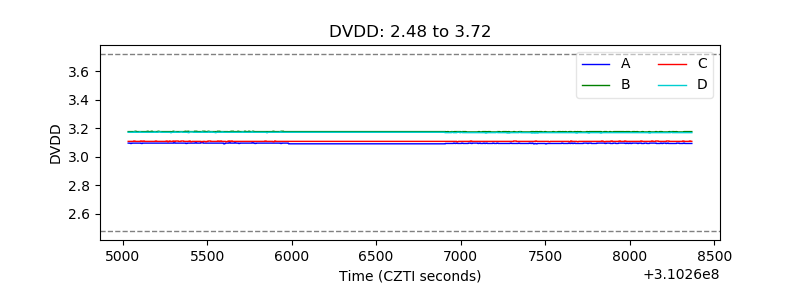 |
| Temperature 1 | 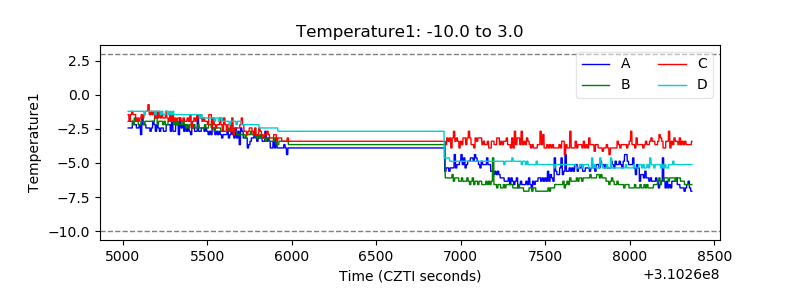 |
| Veto HV Monitor |  |
| Veto LLD | 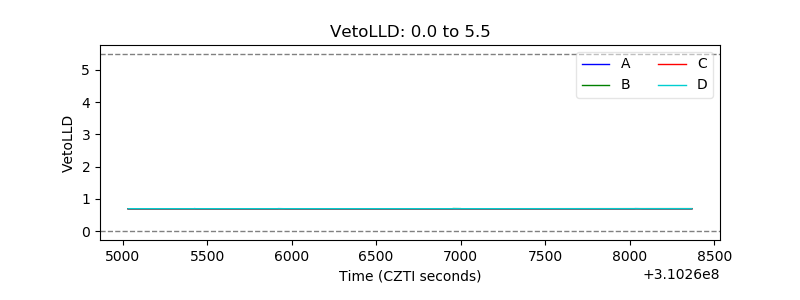 |
| Alpha Counter |  |
| _CPM_Rate | 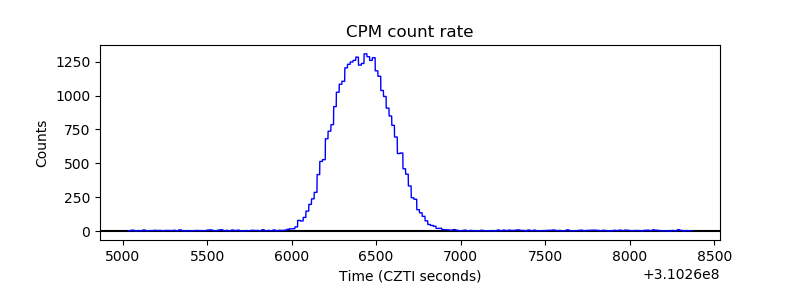 |
| CZT Counter |  |
| +2.5 Volts monitor |  |
| +5 Volts monitor |  |
| _ROLL_ROT | 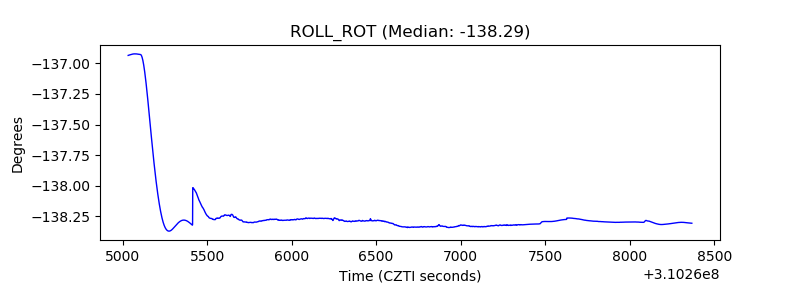 |
| _Roll_DEC | 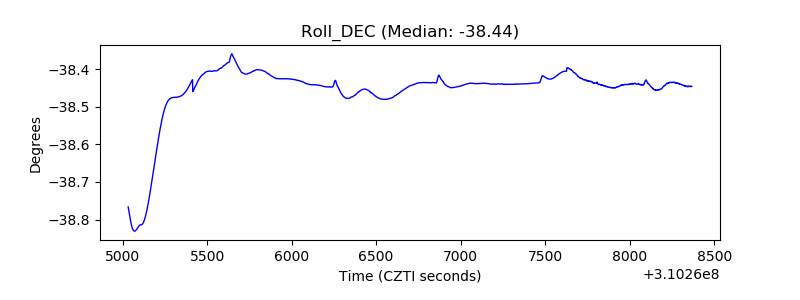 |
| _Roll_RA |  |
| Veto Counter | 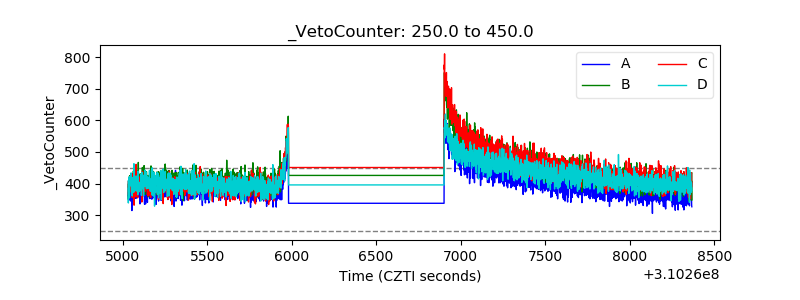 |