| Param | Original file | Final file |
|---|---|---|
| Filename | modeM0/AS1T03_145T01_9000003278_22127cztM0_level2.evt | modeM0/AS1T03_145T01_9000003278_22127cztM0_level2_quad_clean.evt |
| Size (bytes) | 432,682,560 | 79,614,720 |
| Size | 412.6 MB | 75.9 MB |
| Events in quadrant A | 3,038,838 | 498,805 |
| Events in quadrant B | 3,218,470 | 507,471 |
| Events in quadrant C | 3,100,345 | 485,691 |
| Events in quadrant D | 3,310,381 | 471,880 |
| Mode M0 | |||
|---|---|---|---|
| Quadrant | BADHDUFLAG | Total packets | Discarded packets |
| A | 0 | 13079 | 1 |
| B | 0 | 13534 | 9 |
| C | 0 | 13171 | 1 |
| D | 0 | 14092 | 1 |
| Mode SS | |||
|---|---|---|---|
| Quadrant | BADHDUFLAG | Total packets | Discarded packets |
| A | 0 | 132 | 0 |
| B | 0 | 132 | 0 |
| C | 0 | 132 | 0 |
| D | 0 | 132 | 0 |
| Mode M9 | |||
|---|---|---|---|
| Quadrant | BADHDUFLAG | Total packets | Discarded packets |
| A | 0 | 10 | 0 |
| B | 0 | 10 | 0 |
| C | 0 | 10 | 0 |
| D | 0 | 10 | 0 |
| Quadrant | Total seconds | Saturated seconds | Saturation percentage |
|---|---|---|---|
| A | 6400 | 24 | 0.375000% |
| B | 6400 | 37 | 0.578125% |
| C | 6400 | 45 | 0.703125% |
| D | 6400 | 120 | 1.875000% |
Noise dominated data is calculated using 1-second bins in cleaned event files. If a bin has >2000 counts, and if more than 50% of those come from <1% of pixels, then it is considered to be noise-dominated and hence unusable.
| Quadrant | # 1 sec bins | Bins with >0 counts | Bins with >2000 counts | High rate bins dominated by noise | Noise dominated (total time) | Noise dominated (detector-on time) | Marked lightcurve |
|---|---|---|---|---|---|---|---|
| A | 7435 | 6401 | 1 | 1 | 0.01% | 0.02% | 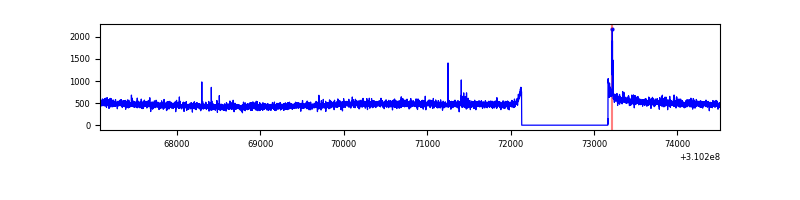 |
| B | 7435 | 6401 | 5 | 5 | 0.07% | 0.08% | 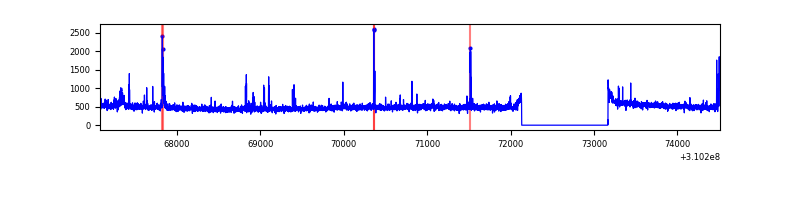 |
| C | 7435 | 6401 | 0 | 0 | 0.00% | 0.00% | 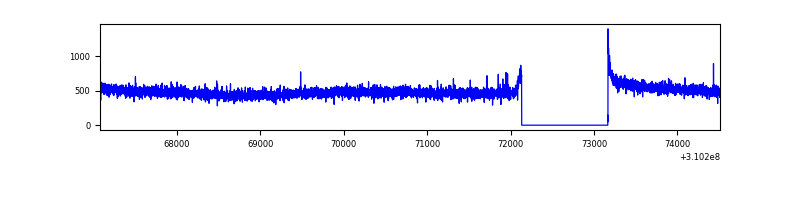 |
| D | 7435 | 6401 | 87 | 87 | 1.17% | 1.36% | 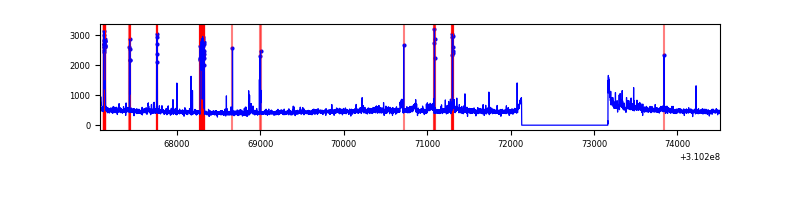 |
Top three noisy pixels from each quadrant. If the there are fewer than three noisy pixels in the level2.evt file, extra rows are filled as -1
| Pixel properties | Quadrant properties | ||||||
|---|---|---|---|---|---|---|---|
| Quadrant | DetID | PixID | Counts | Sigma | Mean | Median | Sigma |
| A | 5 | 16 | 15011 | 90.02 | 784 | 767 | 158.2 |
| A | 13 | 254 | 11027 | 64.84 | 784 | 767 | 158.2 |
| A | 3 | 137 | 6632 | 37.07 | 784 | 767 | 158.2 |
| B | 3 | 64 | 53902 | 357.39 | 785 | 766 | 148.7 |
| B | 10 | 246 | 49485 | 327.68 | 785 | 766 | 148.7 |
| B | 0 | 230 | 26036 | 169.97 | 785 | 766 | 148.7 |
| C | 14 | 238 | 120799 | 674.92 | 762 | 766 | 177.8 |
| C | 10 | 22 | 7219 | 36.28 | 762 | 766 | 177.8 |
| C | 13 | 61 | 5345 | 25.75 | 762 | 766 | 177.8 |
| D | 1 | 52 | 274183 | 1488.48 | 758 | 738 | 183.7 |
| D | 13 | 172 | 71248 | 383.82 | 758 | 738 | 183.7 |
| D | 2 | 133 | 31869 | 169.46 | 758 | 738 | 183.7 |
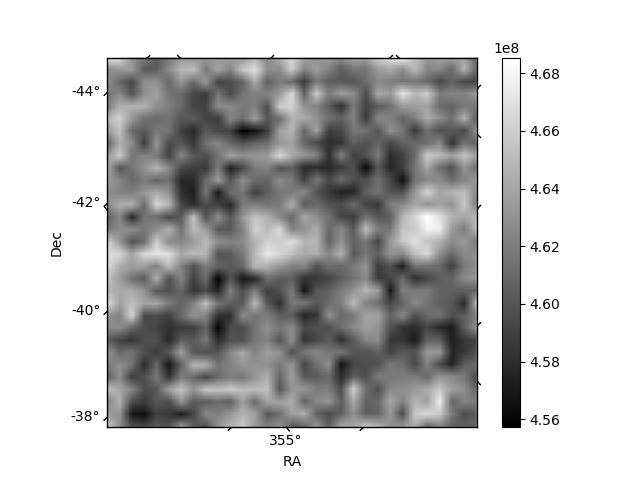
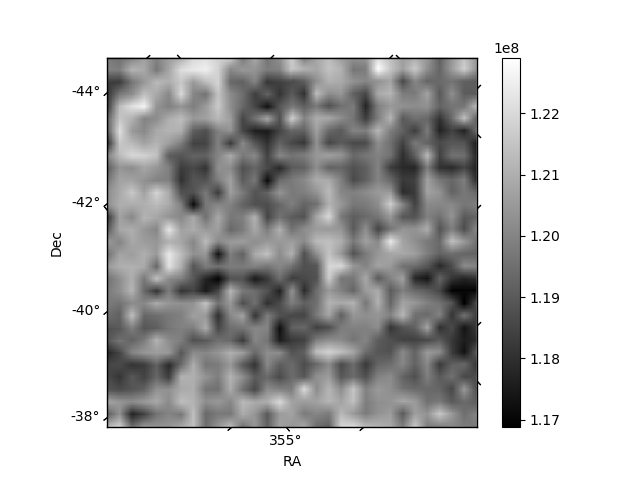
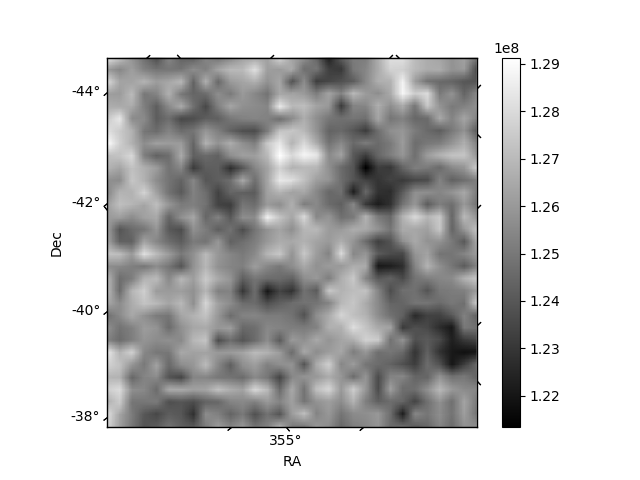
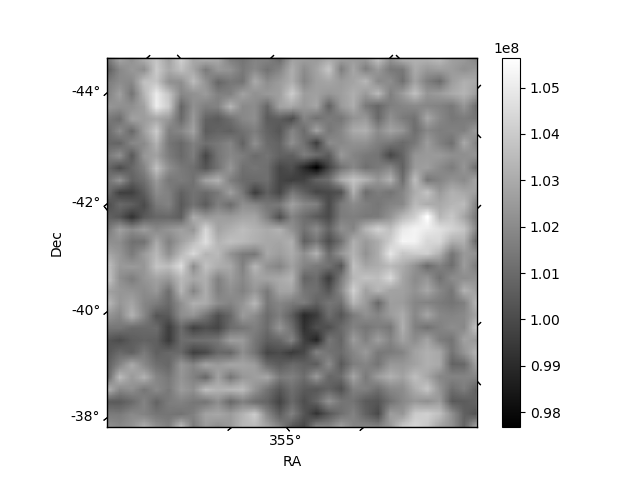
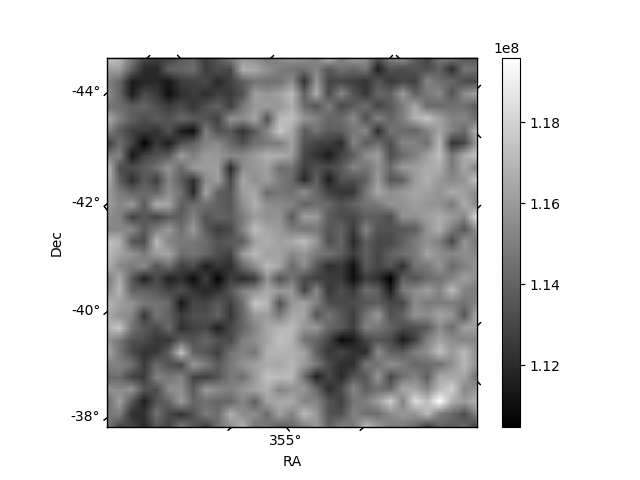
Histogram calculated using DETX and DETY for each event in the final _common_clean file
| Quadrant A | 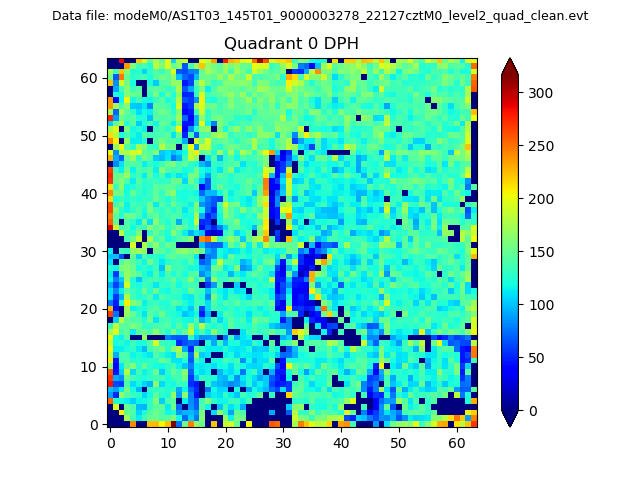 |
 |
Quadrant B |
|---|---|---|---|
| Quadrant D | 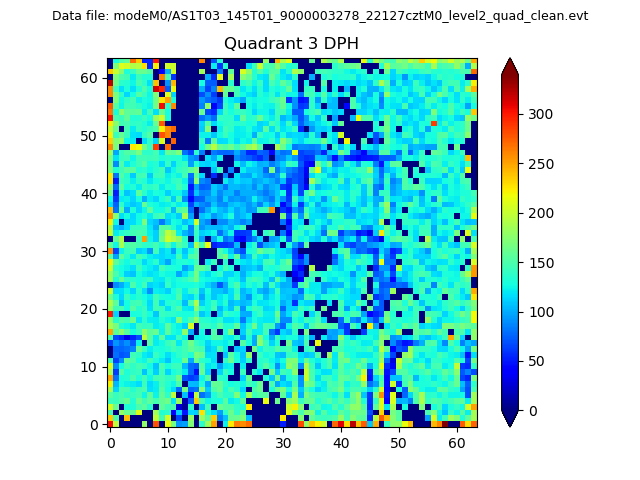 |
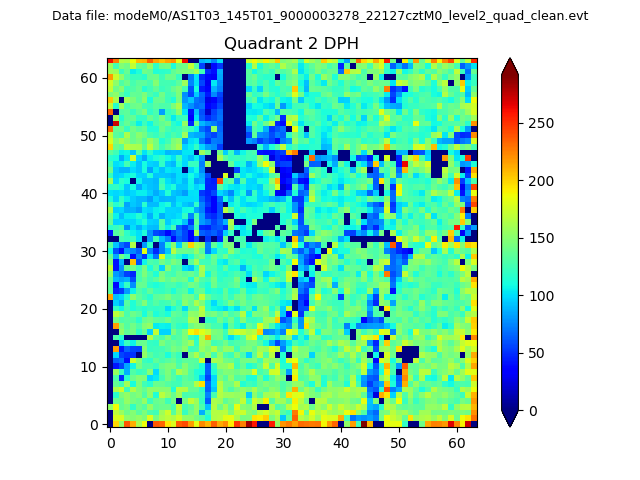 |
Quadrant C |
| Plot type | Count rate plots | Images |
|---|---|---|
| Comparison with Poisson distribution Blue bars denote a histogram of data divided into 1 sec bins. Red curve is a Poisson curve with rate = median count rate of data. |
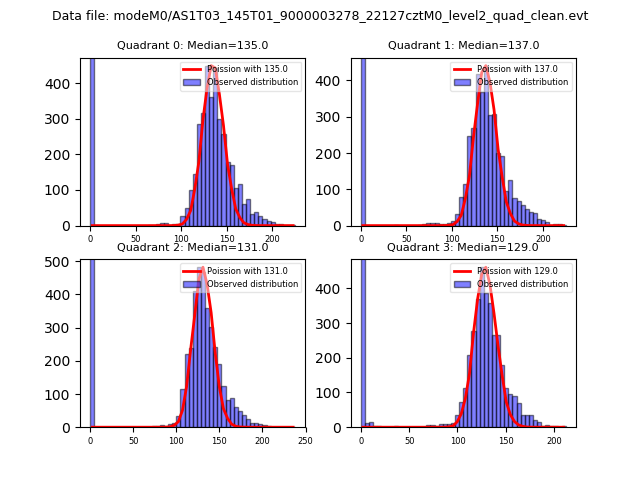 |
 |
| Quadrant-wise count rates Data is divided into 100 sec bins |
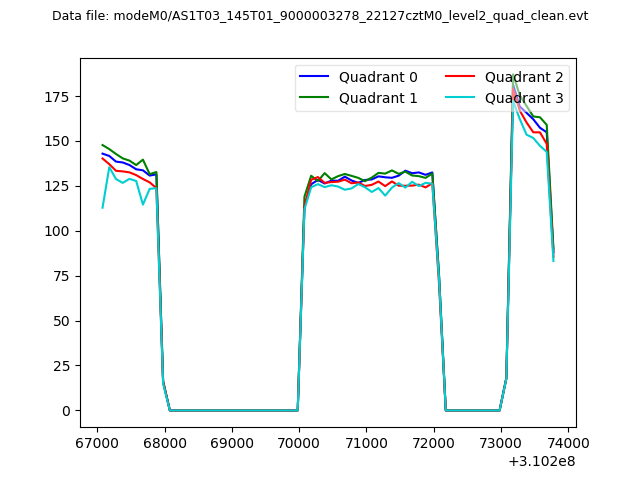 |
|
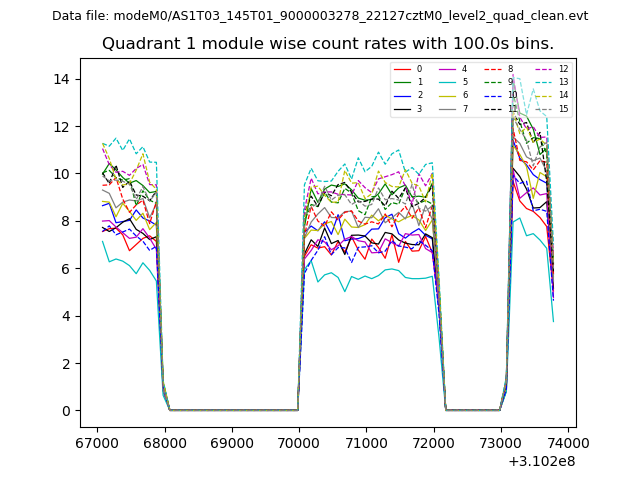
| Module-wise count rates for Quadrant A Data is divided into 100 sec bins |
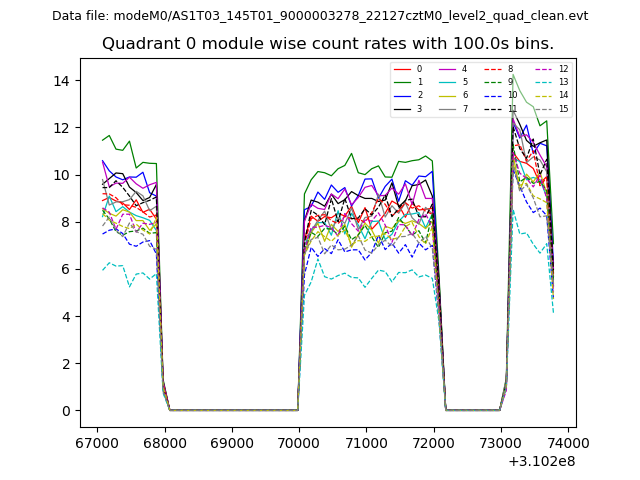 |
 |
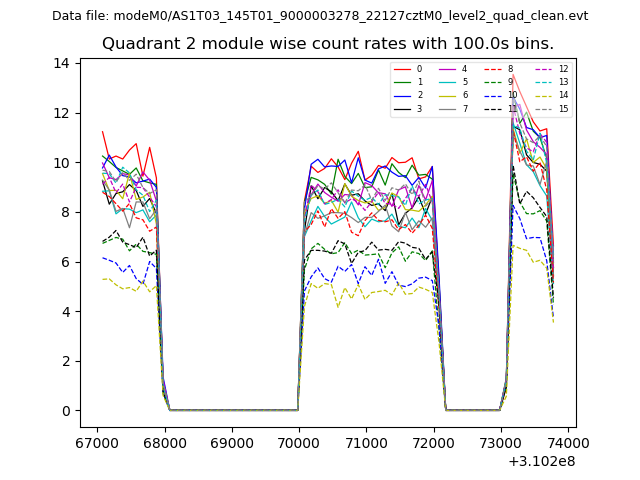
| Module-wise count rates for Quadrant B Data is divided into 100 sec bins |
 |
 |
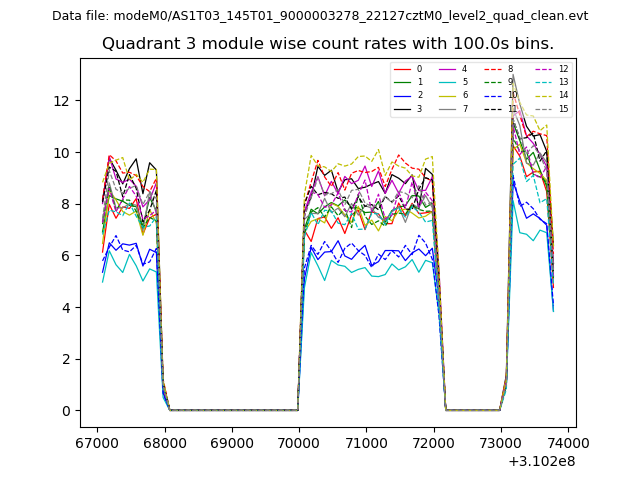
| Module-wise count rates for Quadrant C Data is divided into 100 sec bins |
 |
 |
| Module-wise count rates for Quadrant D Data is divided into 100 sec bins |
 |
 |
| Parameter | Plot |
|---|---|
| CZT HV Monitor | 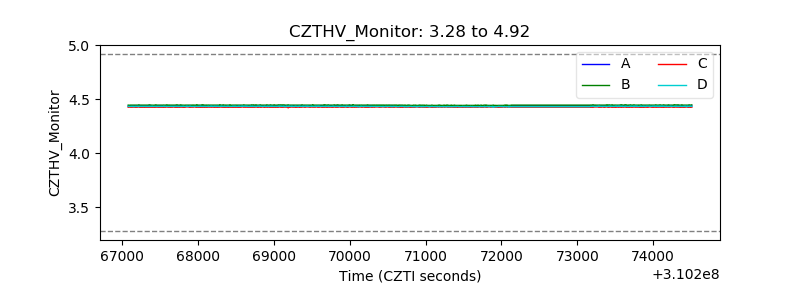 |
| D_VDD | 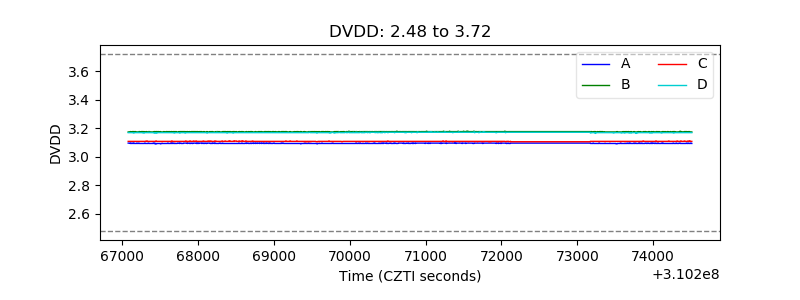 |
| Temperature 1 | 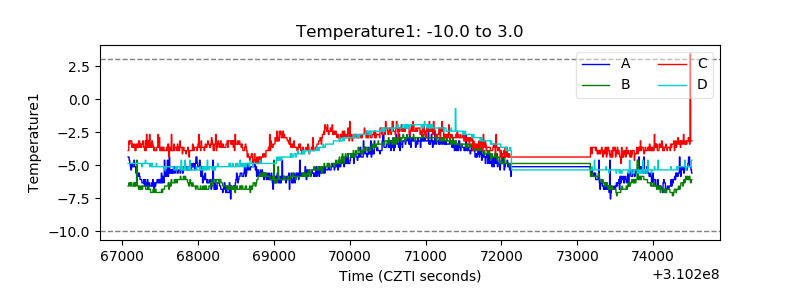 |
| Veto HV Monitor | 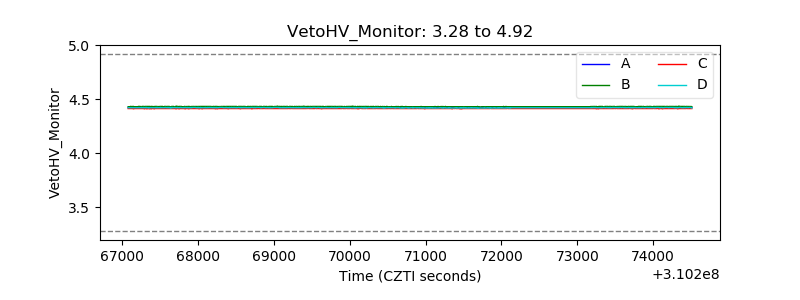 |
| Veto LLD | 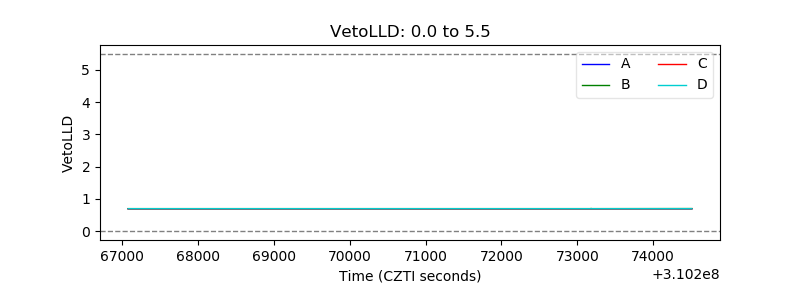 |
| Alpha Counter | 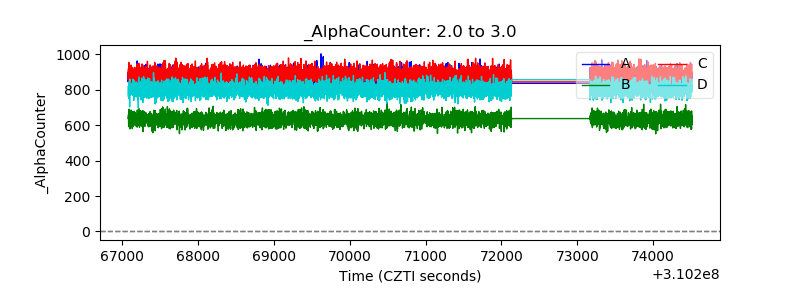 |
| _CPM_Rate | 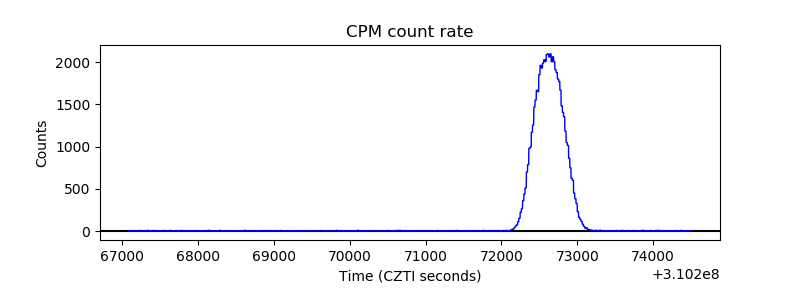 |
| CZT Counter |  |
| +2.5 Volts monitor |  |
| +5 Volts monitor |  |
| _ROLL_ROT | 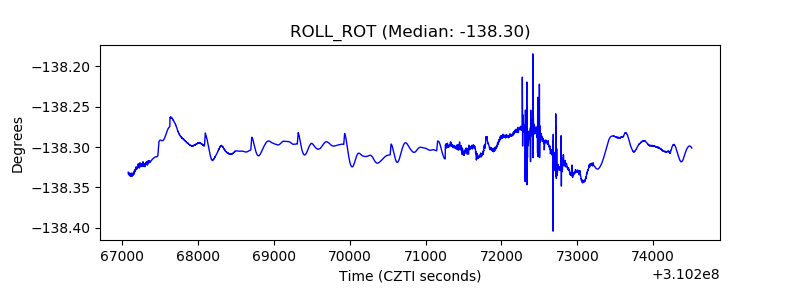 |
| _Roll_DEC | 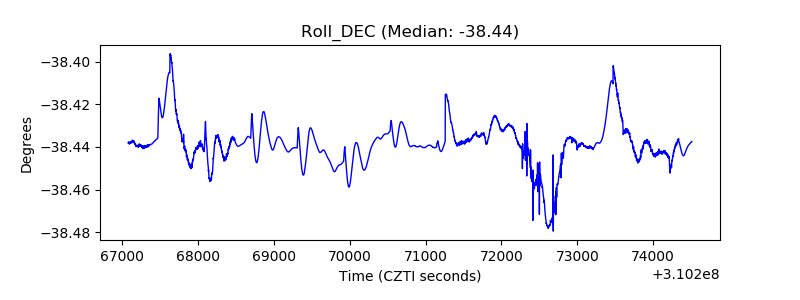 |
| _Roll_RA |  |
| Veto Counter | 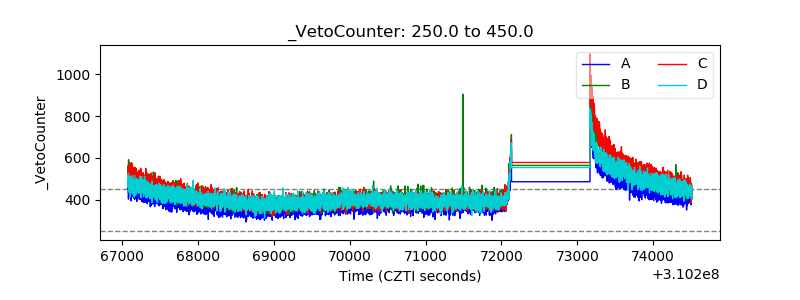 |