| Param | Original file | Final file |
|---|---|---|
| Filename | modeM0/AS1T03_145T01_9000003278_22129cztM0_level2.evt | modeM0/AS1T03_145T01_9000003278_22129cztM0_level2_quad_clean.evt |
| Size (bytes) | 497,093,760 | 76,665,600 |
| Size | 474.1 MB | 73.1 MB |
| Events in quadrant A | 3,280,690 | 474,531 |
| Events in quadrant B | 3,534,297 | 484,577 |
| Events in quadrant C | 3,387,145 | 464,250 |
| Events in quadrant D | 4,407,688 | 441,000 |
| Mode M0 | |||
|---|---|---|---|
| Quadrant | BADHDUFLAG | Total packets | Discarded packets |
| A | 0 | 13744 | 2 |
| B | 0 | 14507 | 3 |
| C | 0 | 14125 | 2 |
| D | 0 | 17413 | 2 |
| Mode SS | |||
|---|---|---|---|
| Quadrant | BADHDUFLAG | Total packets | Discarded packets |
| A | 0 | 138 | 0 |
| B | 0 | 138 | 0 |
| C | 0 | 138 | 0 |
| D | 0 | 138 | 0 |
| Mode M9 | |||
|---|---|---|---|
| Quadrant | BADHDUFLAG | Total packets | Discarded packets |
| A | 0 | 21 | 0 |
| B | 0 | 21 | 0 |
| C | 0 | 21 | 0 |
| D | 0 | 21 | 0 |
| Quadrant | Total seconds | Saturated seconds | Saturation percentage |
|---|---|---|---|
| A | 6542 | 47 | 0.718435% |
| B | 6542 | 85 | 1.299297% |
| C | 6542 | 98 | 1.498013% |
| D | 6542 | 265 | 4.050749% |
Noise dominated data is calculated using 1-second bins in cleaned event files. If a bin has >2000 counts, and if more than 50% of those come from <1% of pixels, then it is considered to be noise-dominated and hence unusable.
| Quadrant | # 1 sec bins | Bins with >0 counts | Bins with >2000 counts | High rate bins dominated by noise | Noise dominated (total time) | Noise dominated (detector-on time) | Marked lightcurve |
|---|---|---|---|---|---|---|---|
| A | 8737 | 6544 | 1 | 1 | 0.01% | 0.02% | 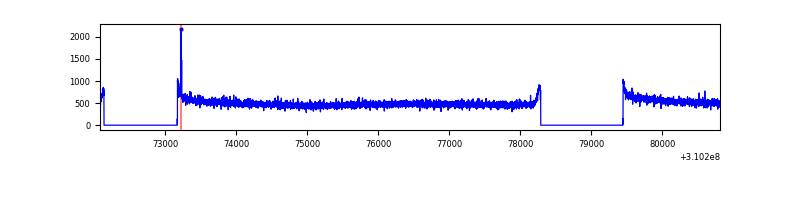 |
| B | 8737 | 6544 | 11 | 11 | 0.13% | 0.17% | 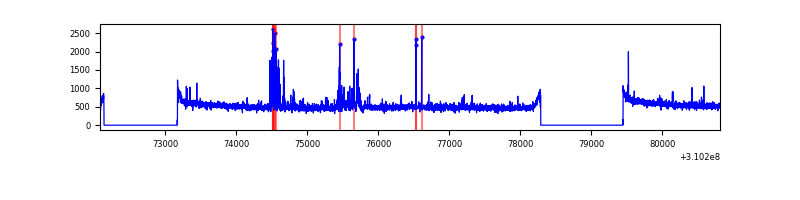 |
| C | 8737 | 6544 | 0 | 0 | 0.00% | 0.00% | 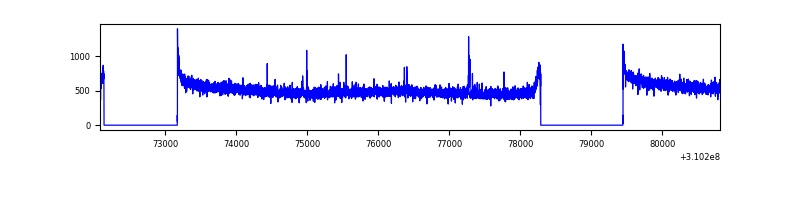 |
| D | 8737 | 6544 | 186 | 186 | 2.13% | 2.84% | 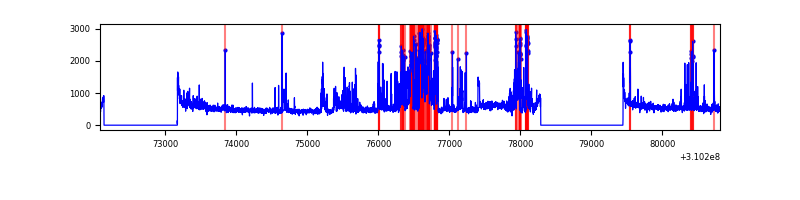 |
Top three noisy pixels from each quadrant. If the there are fewer than three noisy pixels in the level2.evt file, extra rows are filled as -1
| Pixel properties | Quadrant properties | ||||||
|---|---|---|---|---|---|---|---|
| Quadrant | DetID | PixID | Counts | Sigma | Mean | Median | Sigma |
| A | 13 | 254 | 11172 | 60.91 | 849 | 834 | 169.7 |
| A | 5 | 16 | 9833 | 53.02 | 849 | 834 | 169.7 |
| A | 0 | 226 | 7094 | 36.88 | 849 | 834 | 169.7 |
| B | 3 | 64 | 105561 | 664.65 | 850 | 831 | 157.6 |
| B | 10 | 246 | 84295 | 529.69 | 850 | 831 | 157.6 |
| B | 12 | 111 | 19198 | 116.56 | 850 | 831 | 157.6 |
| C | 14 | 238 | 131625 | 686.13 | 827 | 835 | 190.6 |
| C | 10 | 22 | 22092 | 111.51 | 827 | 835 | 190.6 |
| C | 9 | 54 | 7056 | 32.64 | 827 | 835 | 190.6 |
| D | 11 | 176 | 616510 | 3127.35 | 821 | 799 | 196.9 |
| D | 2 | 133 | 258992 | 1311.43 | 821 | 799 | 196.9 |
| D | 1 | 52 | 109003 | 549.59 | 821 | 799 | 196.9 |
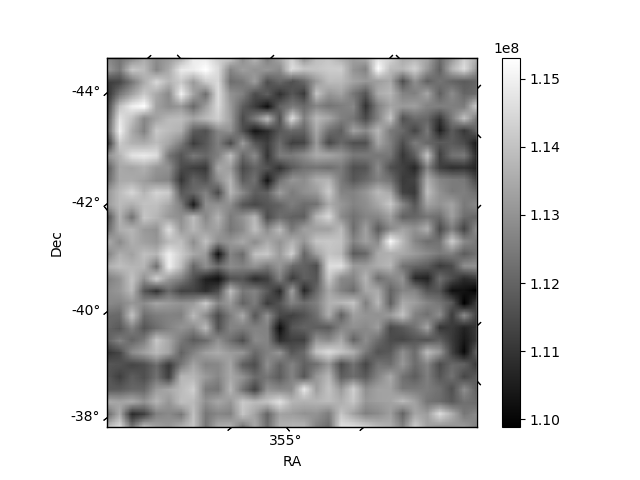
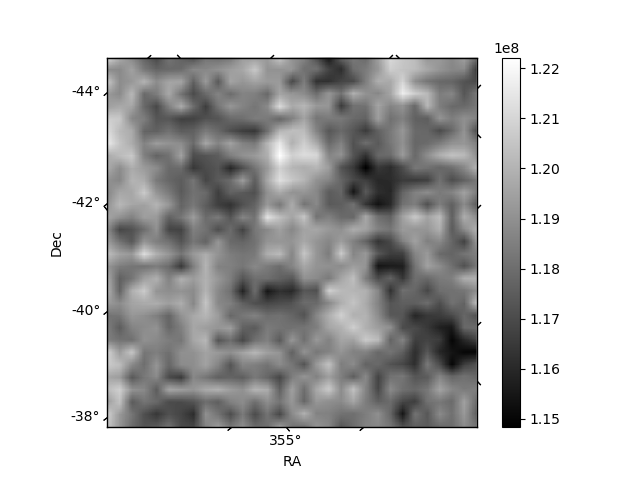
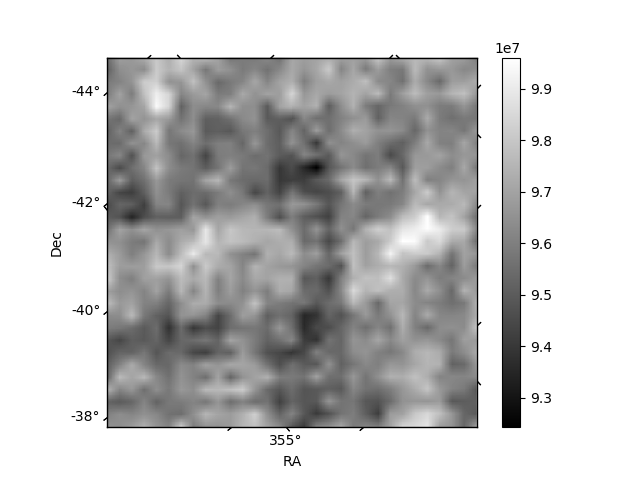
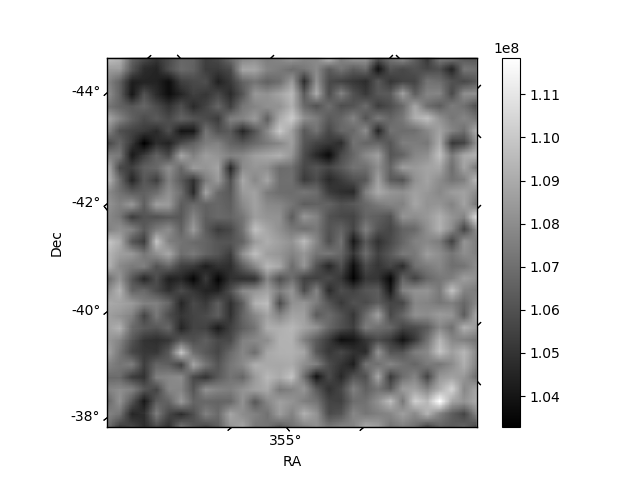
Histogram calculated using DETX and DETY for each event in the final _common_clean file
| Quadrant A | 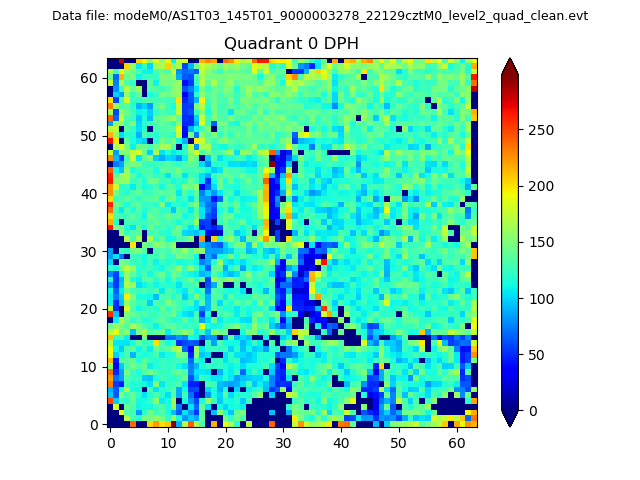 |
 |
Quadrant B |
|---|---|---|---|
| Quadrant D | 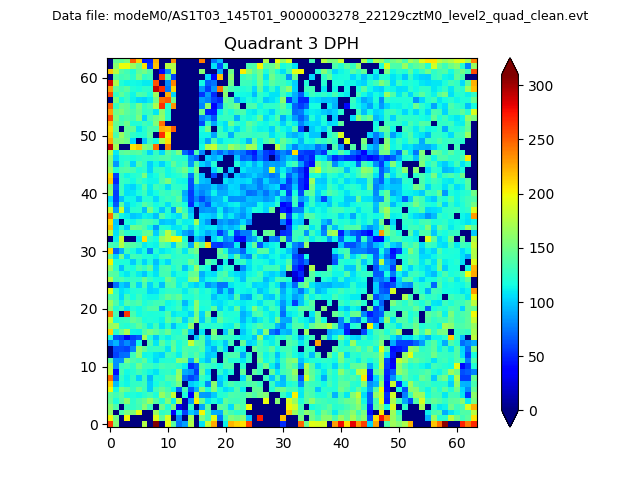 |
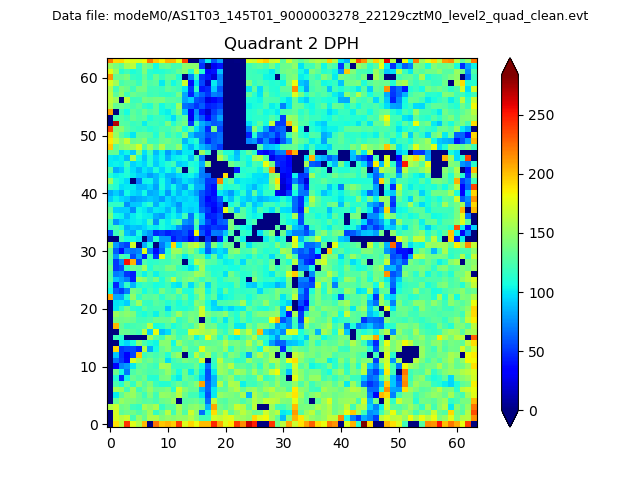 |
Quadrant C |
| Plot type | Count rate plots | Images |
|---|---|---|
| Comparison with Poisson distribution Blue bars denote a histogram of data divided into 1 sec bins. Red curve is a Poisson curve with rate = median count rate of data. |
 |
 |
| Quadrant-wise count rates Data is divided into 100 sec bins |
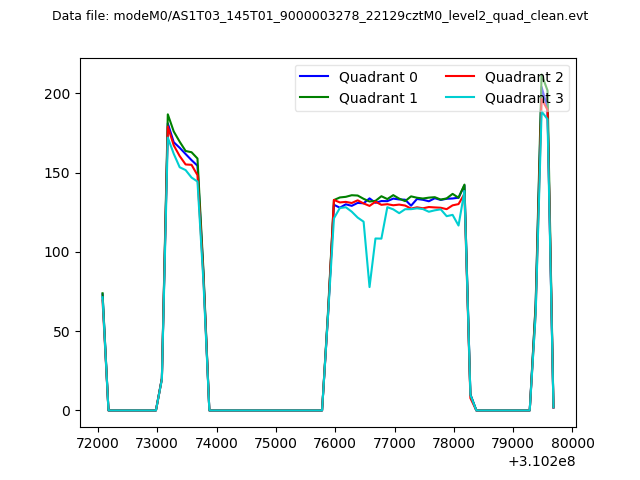 |
|
| Module-wise count rates for Quadrant A Data is divided into 100 sec bins |
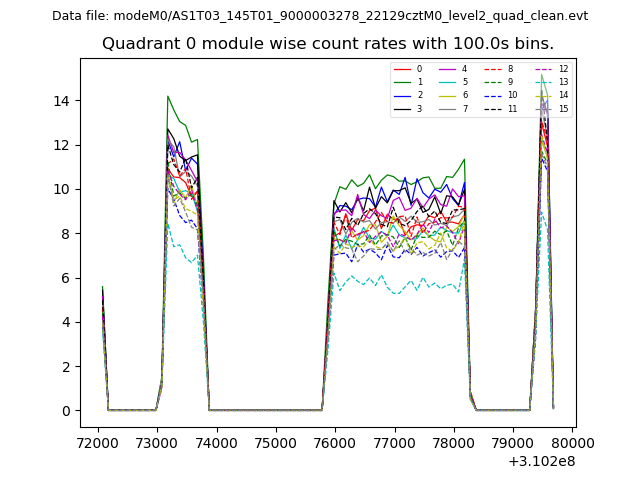 |
 |
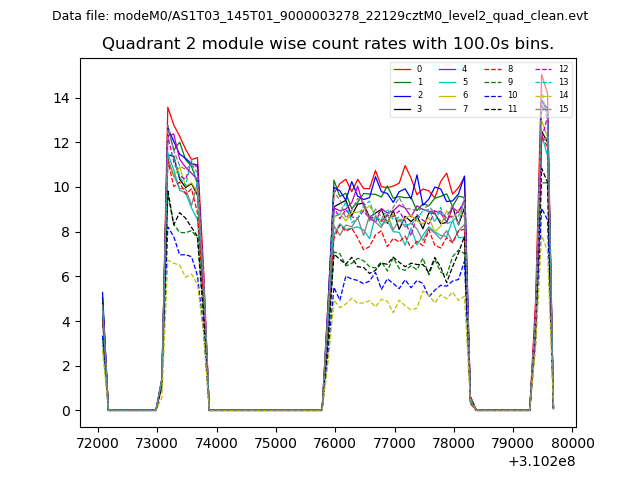
| Module-wise count rates for Quadrant B Data is divided into 100 sec bins |
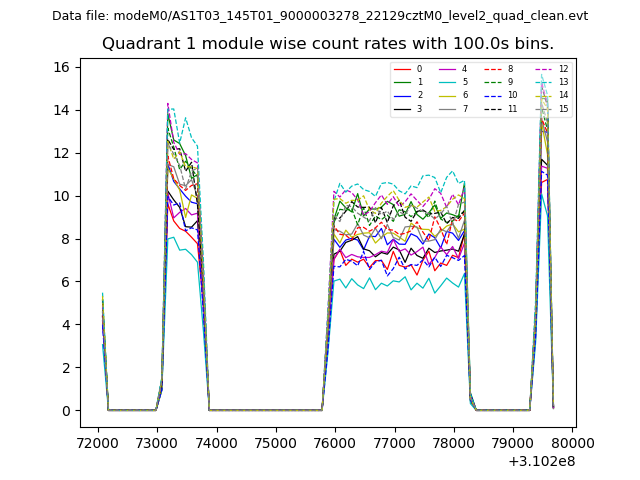 |
 |
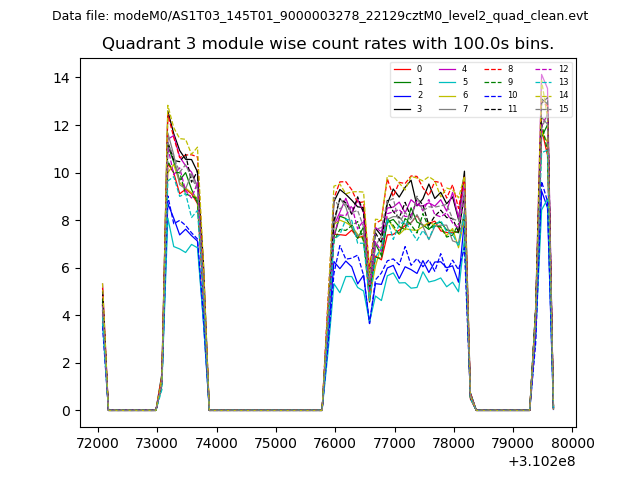
| Module-wise count rates for Quadrant C Data is divided into 100 sec bins |
 |
 |
| Module-wise count rates for Quadrant D Data is divided into 100 sec bins |
 |
 |
| Parameter | Plot |
|---|---|
| CZT HV Monitor | 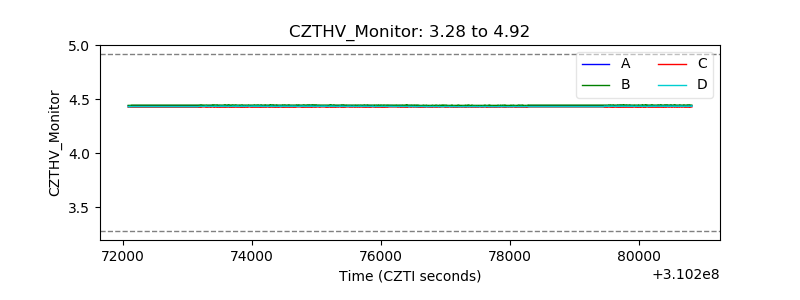 |
| D_VDD | 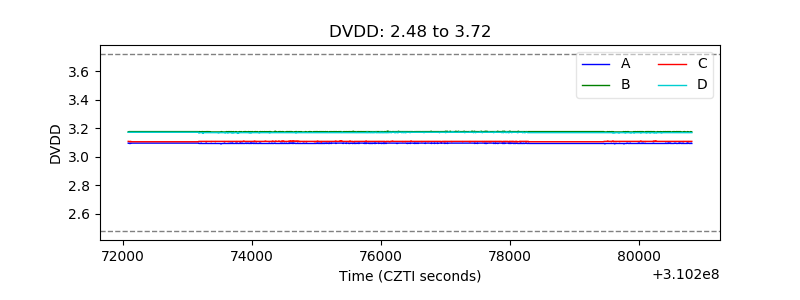 |
| Temperature 1 | 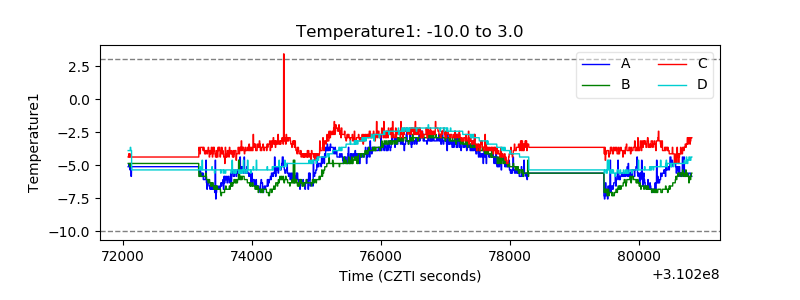 |
| Veto HV Monitor | 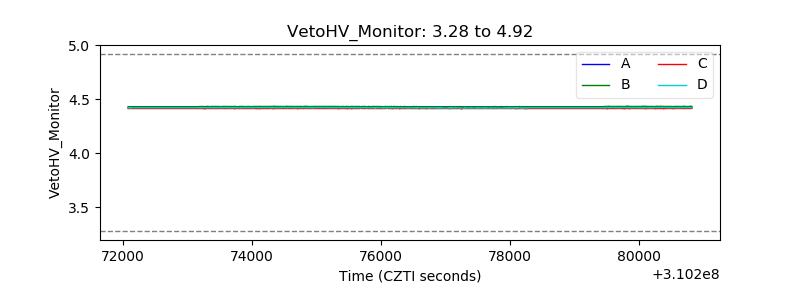 |
| Veto LLD | 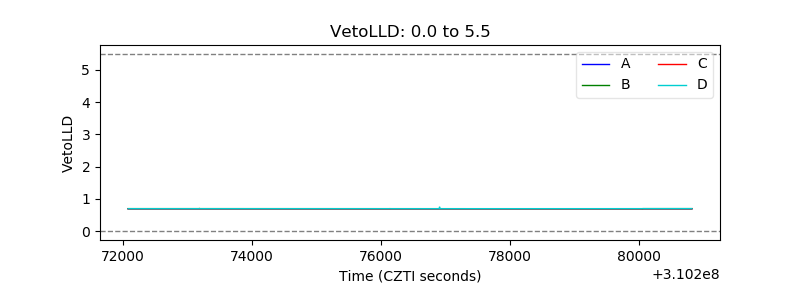 |
| Alpha Counter | 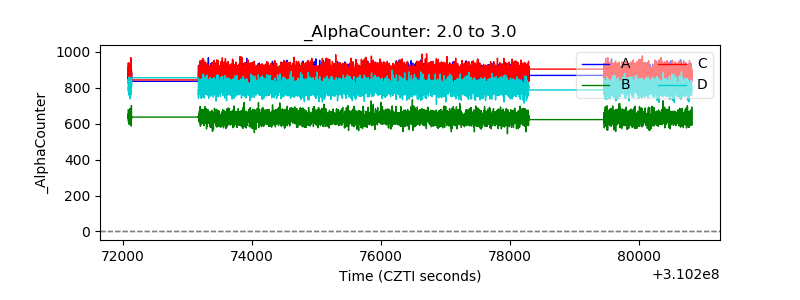 |
| _CPM_Rate | 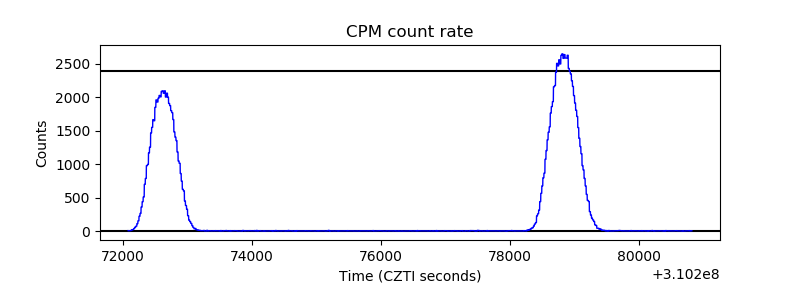 |
| CZT Counter | 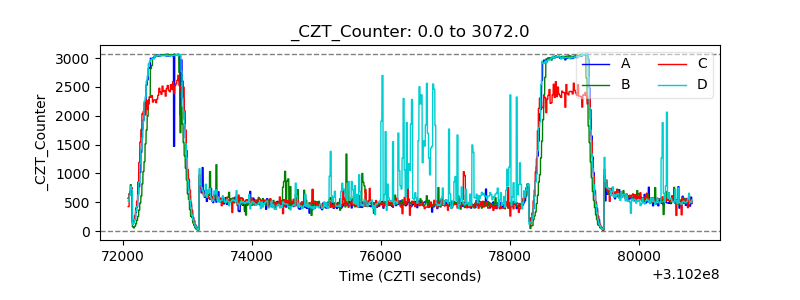 |
| +2.5 Volts monitor | 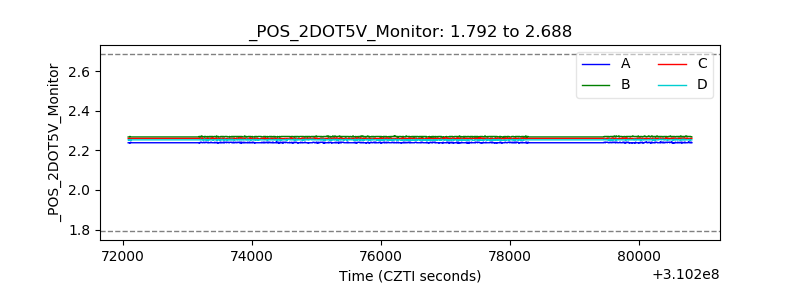 |
| +5 Volts monitor |  |
| _ROLL_ROT | 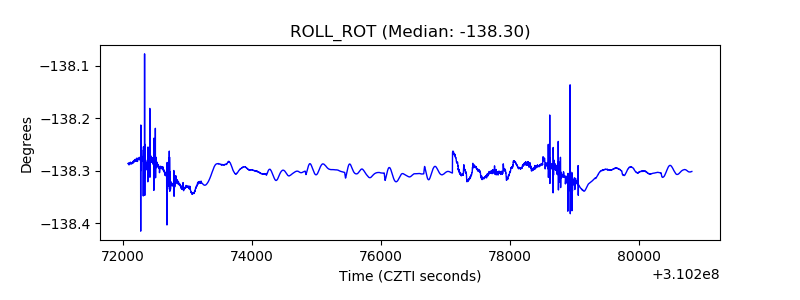 |
| _Roll_DEC | 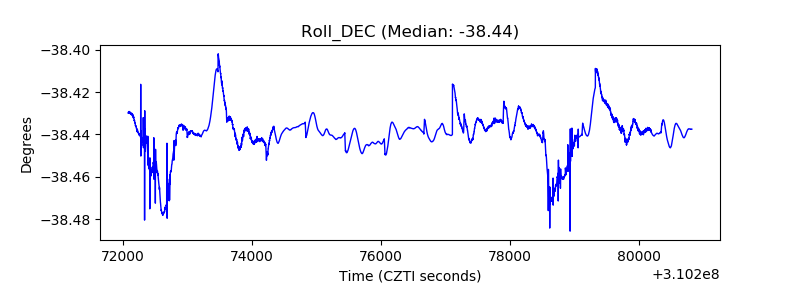 |
| _Roll_RA | 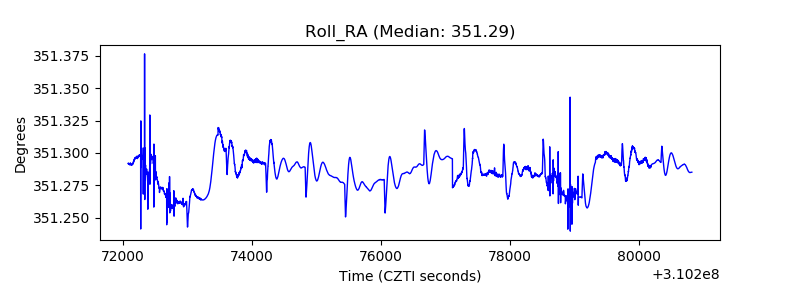 |
| Veto Counter | 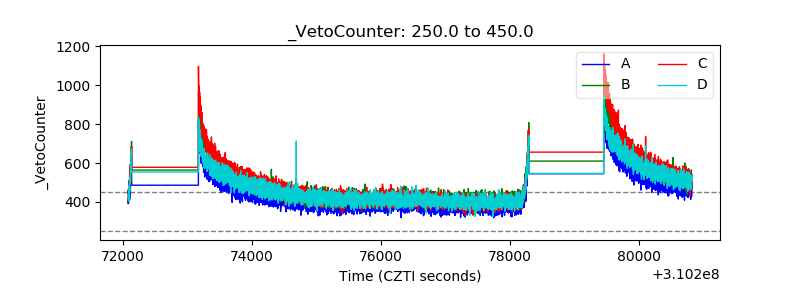 |