| Param | Original file | Final file |
|---|---|---|
| Filename | modeM0/AS1T03_145T01_9000003278_22131cztM0_level2.evt | modeM0/AS1T03_145T01_9000003278_22131cztM0_level2_quad_clean.evt |
| Size (bytes) | 504,648,000 | 71,161,920 |
| Size | 481.3 MB | 67.9 MB |
| Events in quadrant A | 3,412,108 | 434,965 |
| Events in quadrant B | 3,707,112 | 441,745 |
| Events in quadrant C | 3,503,156 | 425,990 |
| Events in quadrant D | 4,237,265 | 415,925 |
| Mode M0 | |||
|---|---|---|---|
| Quadrant | BADHDUFLAG | Total packets | Discarded packets |
| A | 0 | 13966 | 2 |
| B | 0 | 14925 | 2 |
| C | 0 | 14403 | 2 |
| D | 0 | 16672 | 2 |
| Mode SS | |||
|---|---|---|---|
| Quadrant | BADHDUFLAG | Total packets | Discarded packets |
| A | 0 | 126 | 0 |
| B | 0 | 126 | 0 |
| C | 0 | 126 | 0 |
| D | 0 | 126 | 0 |
| Mode M9 | |||
|---|---|---|---|
| Quadrant | BADHDUFLAG | Total packets | Discarded packets |
| A | 0 | 22 | 0 |
| B | 0 | 23 | 0 |
| C | 0 | 23 | 0 |
| D | 0 | 23 | 0 |
| Quadrant | Total seconds | Saturated seconds | Saturation percentage |
|---|---|---|---|
| A | 6252 | 71 | 1.135637% |
| B | 6252 | 122 | 1.951376% |
| C | 6252 | 148 | 2.367242% |
| D | 6252 | 109 | 1.743442% |
Noise dominated data is calculated using 1-second bins in cleaned event files. If a bin has >2000 counts, and if more than 50% of those come from <1% of pixels, then it is considered to be noise-dominated and hence unusable.
| Quadrant | # 1 sec bins | Bins with >0 counts | Bins with >2000 counts | High rate bins dominated by noise | Noise dominated (total time) | Noise dominated (detector-on time) | Marked lightcurve |
|---|---|---|---|---|---|---|---|
| A | 7552 | 6253 | 0 | 0 | 0.00% | 0.00% | 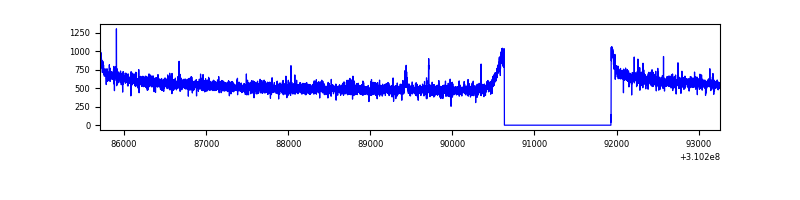 |
| B | 7552 | 6253 | 33 | 33 | 0.44% | 0.53% | 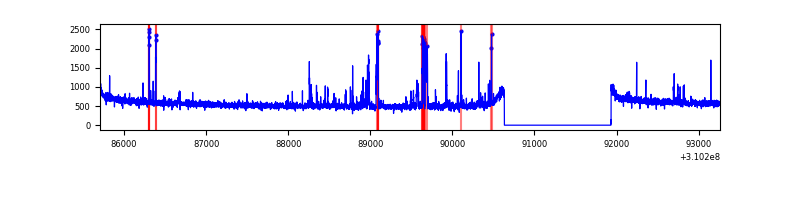 |
| C | 7552 | 6253 | 1 | 1 | 0.01% | 0.02% | 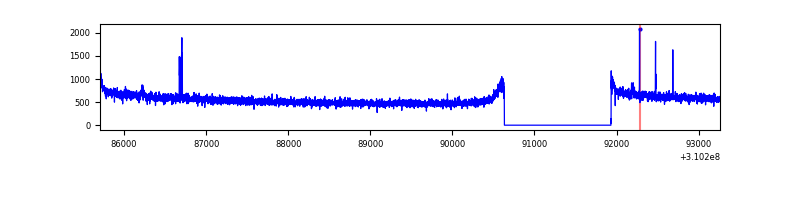 |
| D | 7552 | 6253 | 24 | 24 | 0.32% | 0.38% | 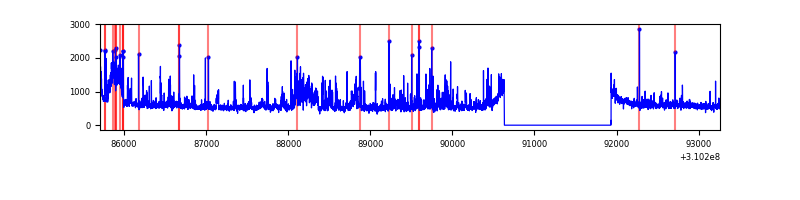 |
Top three noisy pixels from each quadrant. If the there are fewer than three noisy pixels in the level2.evt file, extra rows are filled as -1
| Pixel properties | Quadrant properties | ||||||
|---|---|---|---|---|---|---|---|
| Quadrant | DetID | PixID | Counts | Sigma | Mean | Median | Sigma |
| A | 13 | 254 | 11199 | 59.34 | 883 | 869 | 174.1 |
| A | 0 | 226 | 7554 | 38.4 | 883 | 869 | 174.1 |
| A | 3 | 137 | 6821 | 34.19 | 883 | 869 | 174.1 |
| B | 3 | 64 | 146061 | 897.18 | 877 | 861 | 161.8 |
| B | 10 | 246 | 103079 | 631.6 | 877 | 861 | 161.8 |
| B | 11 | 51 | 21850 | 129.69 | 877 | 861 | 161.8 |
| C | 14 | 238 | 138078 | 705.49 | 850 | 858 | 194.5 |
| C | 10 | 22 | 32806 | 164.25 | 850 | 858 | 194.5 |
| C | 9 | 54 | 13152 | 63.21 | 850 | 858 | 194.5 |
| D | 1 | 52 | 416702 | 2010.91 | 862 | 841 | 206.8 |
| D | 5 | 222 | 305425 | 1472.82 | 862 | 841 | 206.8 |
| D | 11 | 176 | 90320 | 432.68 | 862 | 841 | 206.8 |
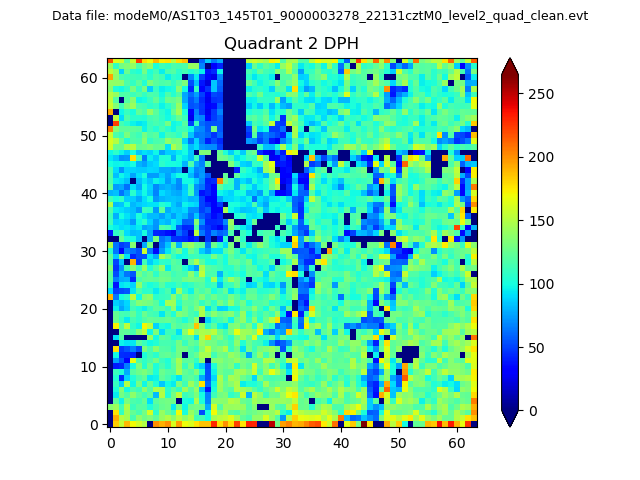
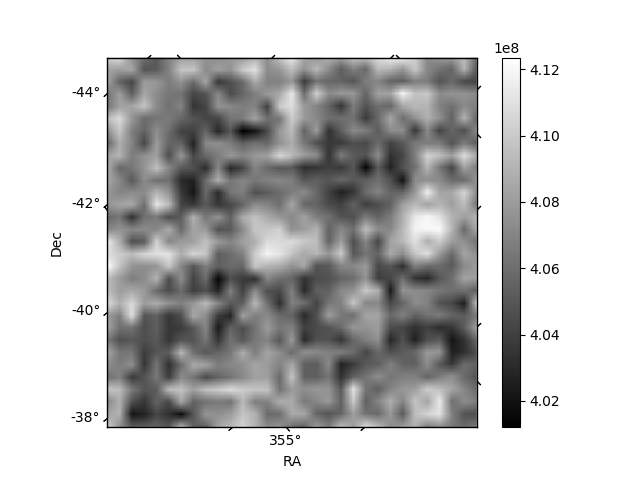
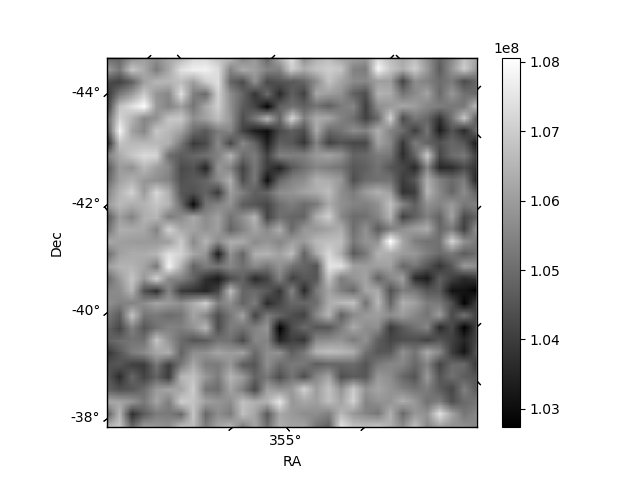
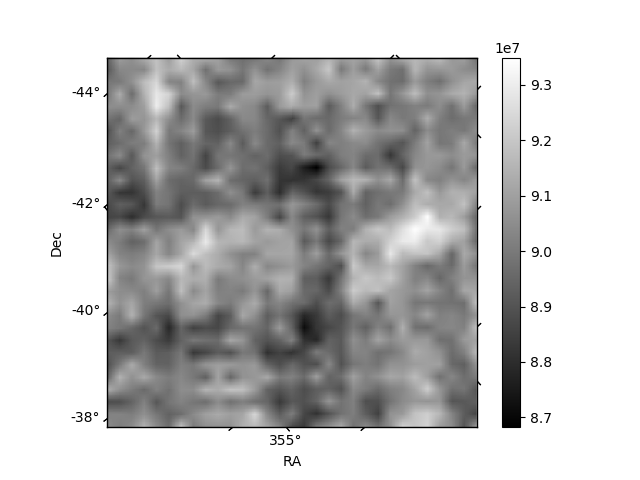
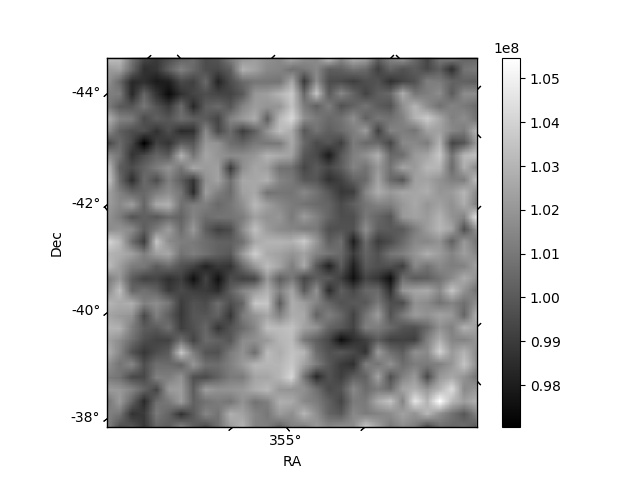
Histogram calculated using DETX and DETY for each event in the final _common_clean file
| Quadrant A | 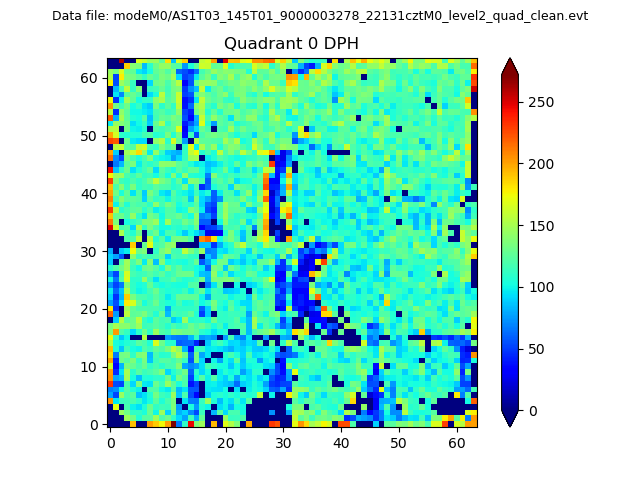 |
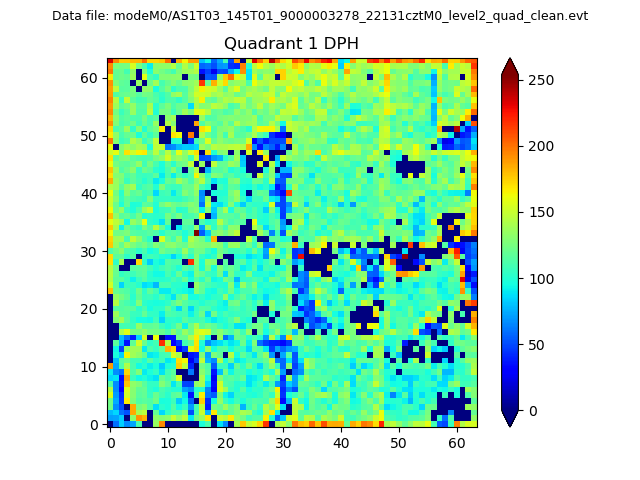 |
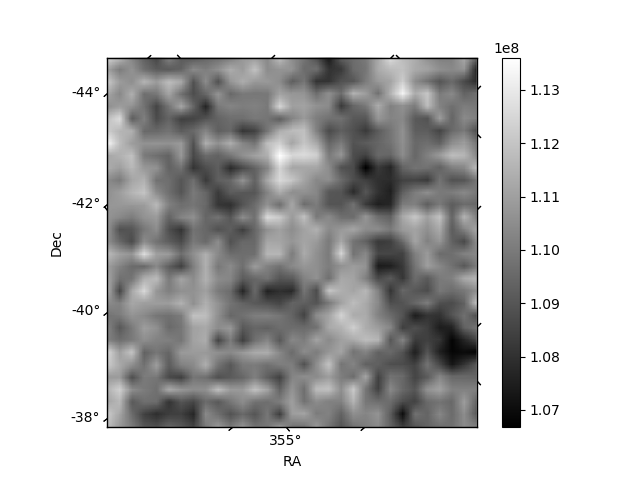
Quadrant B |
|---|---|---|---|
| Quadrant D | 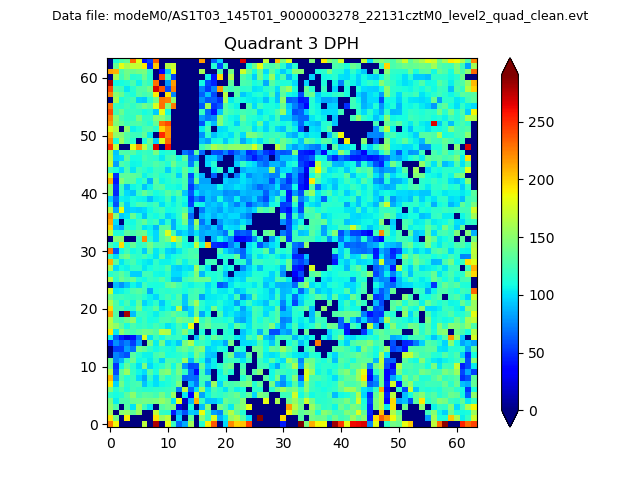 |
 |
Quadrant C |
| Plot type | Count rate plots | Images |
|---|---|---|
| Comparison with Poisson distribution Blue bars denote a histogram of data divided into 1 sec bins. Red curve is a Poisson curve with rate = median count rate of data. |
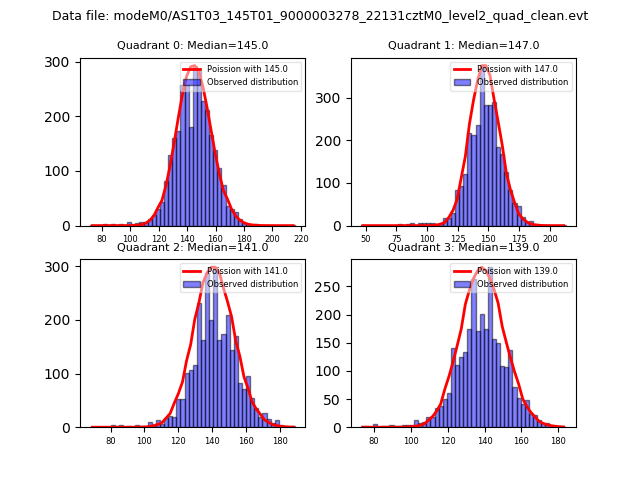 |
 |
| Quadrant-wise count rates Data is divided into 100 sec bins |
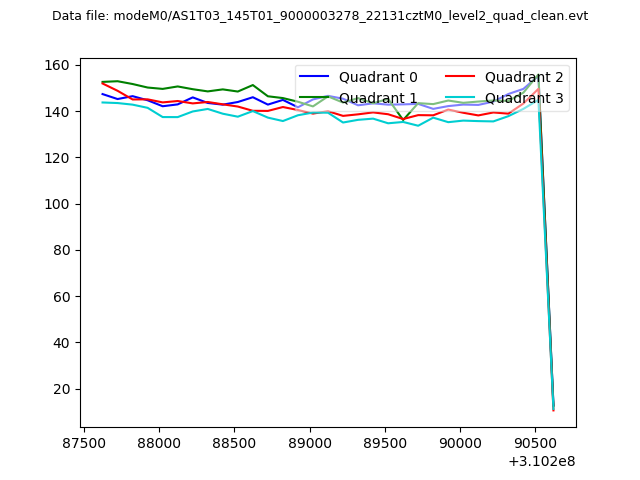 |
|
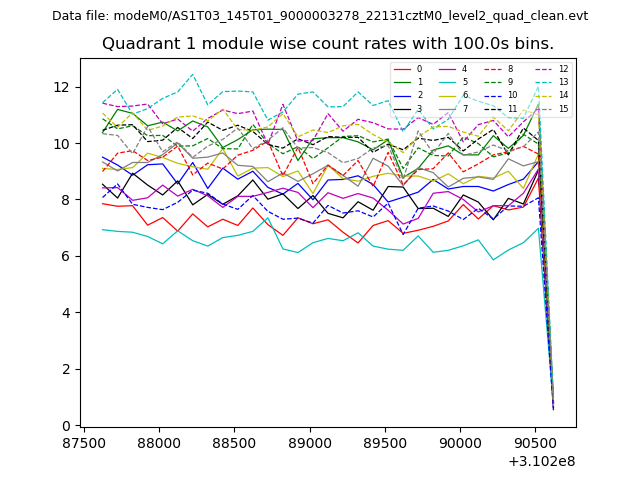
| Module-wise count rates for Quadrant A Data is divided into 100 sec bins |
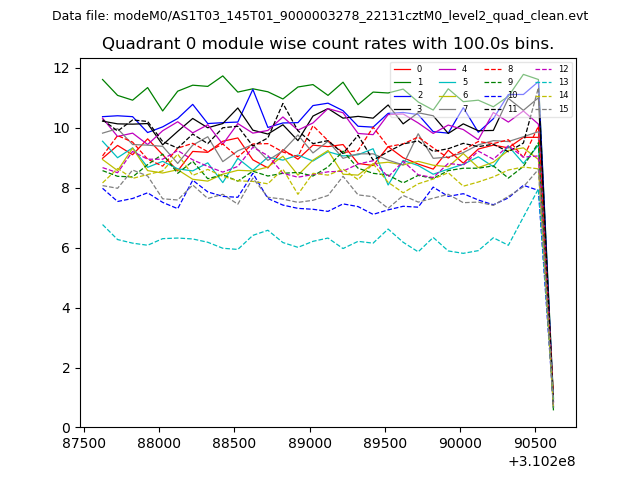 |
 |
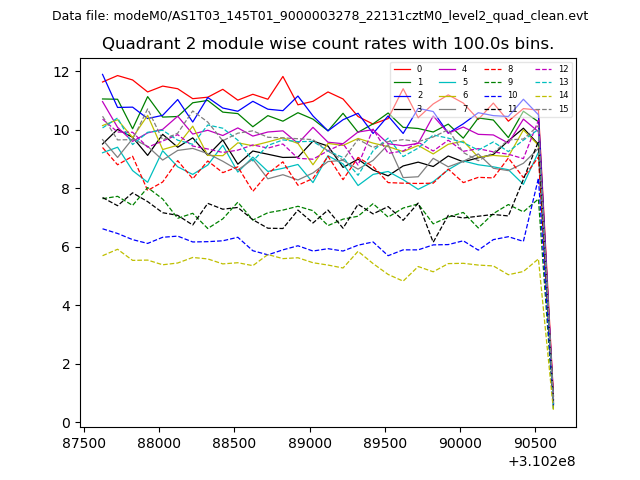
| Module-wise count rates for Quadrant B Data is divided into 100 sec bins |
 |
 |
| Module-wise count rates for Quadrant C Data is divided into 100 sec bins |
 |
 |
| Module-wise count rates for Quadrant D Data is divided into 100 sec bins |
 |
 |
| Parameter | Plot |
|---|---|
| CZT HV Monitor | 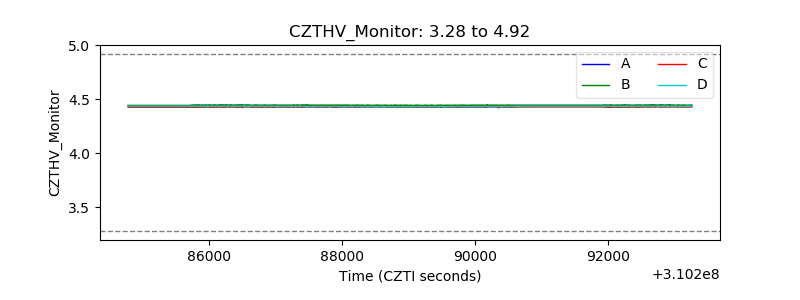 |
| D_VDD | 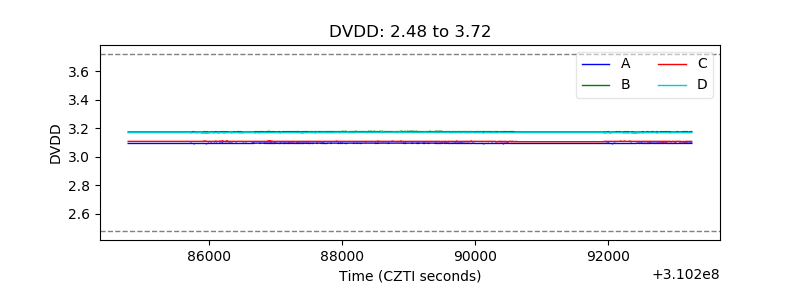 |
| Temperature 1 | 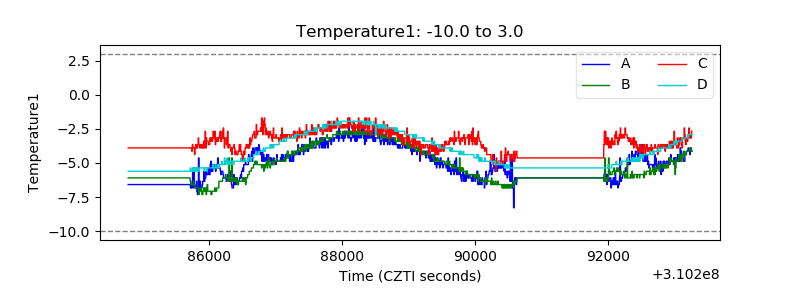 |
| Veto HV Monitor | 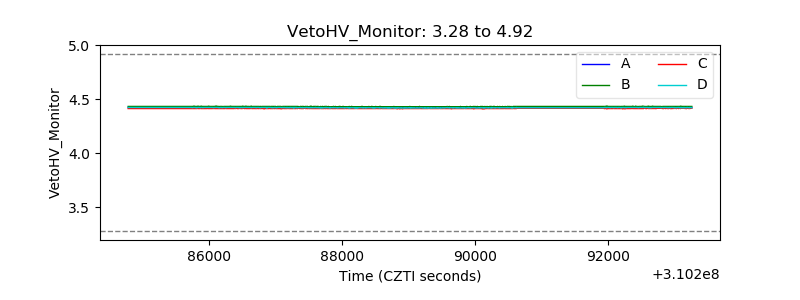 |
| Veto LLD | 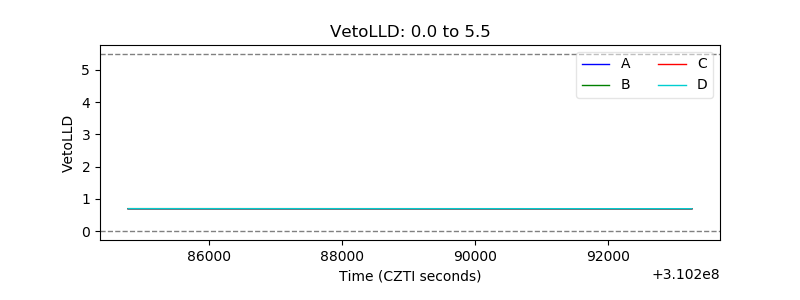 |
| Alpha Counter | 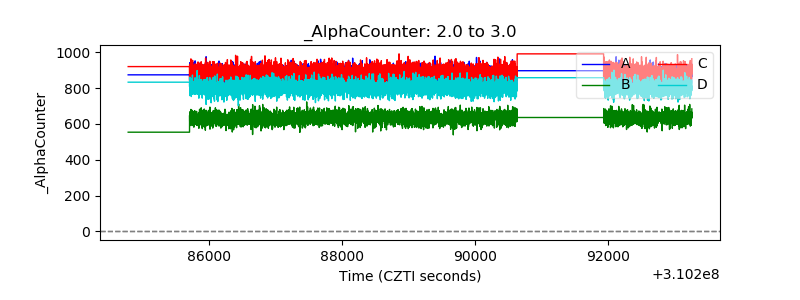 |
| _CPM_Rate | 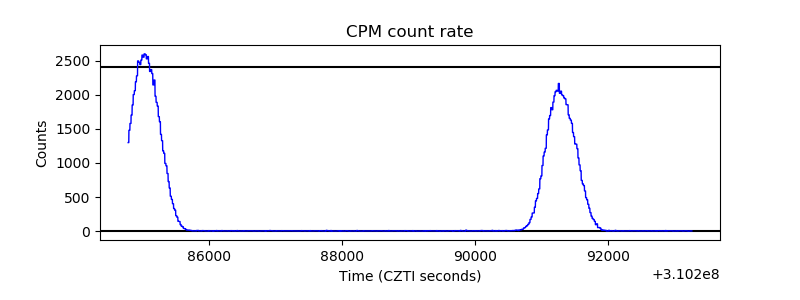 |
| CZT Counter | 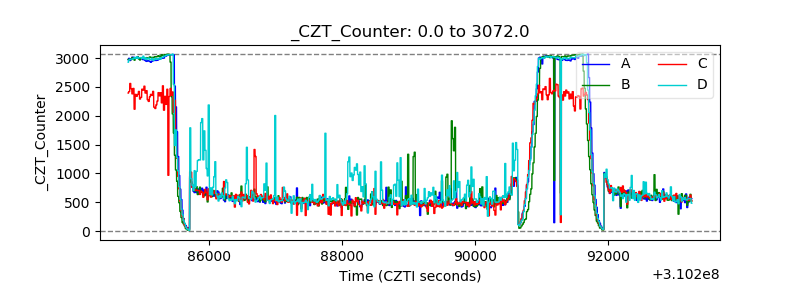 |
| +2.5 Volts monitor | 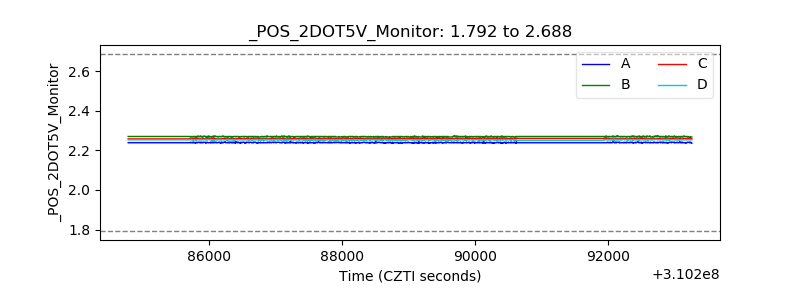 |
| +5 Volts monitor |  |
| _ROLL_ROT | 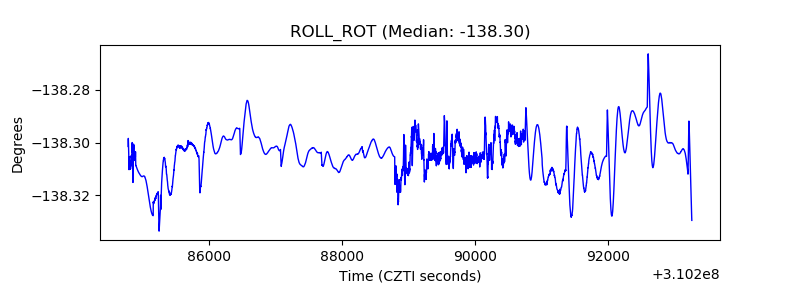 |
| _Roll_DEC | 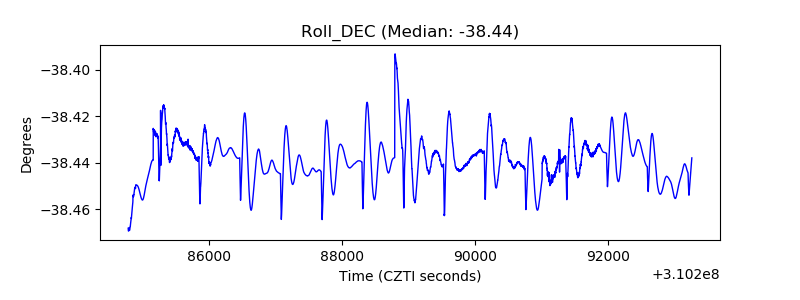 |
| _Roll_RA | 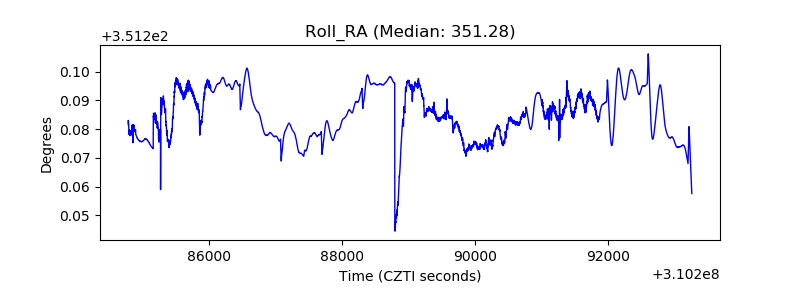 |
| Veto Counter | 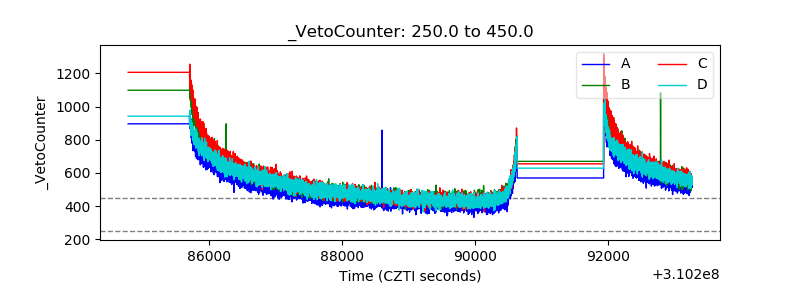 |