| Param | Original file | Final file |
|---|---|---|
| Filename | modeM0/AS1T03_145T01_9000003278_22132cztM0_level2.evt | modeM0/AS1T03_145T01_9000003278_22132cztM0_level2_quad_clean.evt |
| Size (bytes) | 495,705,600 | 85,636,800 |
| Size | 472.7 MB | 81.7 MB |
| Events in quadrant A | 3,477,694 | 546,066 |
| Events in quadrant B | 3,707,315 | 553,988 |
| Events in quadrant C | 3,506,693 | 529,580 |
| Events in quadrant D | 3,889,793 | 520,553 |
| Mode M0 | |||
|---|---|---|---|
| Quadrant | BADHDUFLAG | Total packets | Discarded packets |
| A | 0 | 14205 | 2 |
| B | 0 | 14992 | 4 |
| C | 0 | 14507 | 2 |
| D | 0 | 15764 | 2 |
| Mode SS | |||
|---|---|---|---|
| Quadrant | BADHDUFLAG | Total packets | Discarded packets |
| A | 0 | 128 | 0 |
| B | 0 | 128 | 0 |
| C | 0 | 128 | 0 |
| D | 0 | 128 | 0 |
| Mode M9 | |||
|---|---|---|---|
| Quadrant | BADHDUFLAG | Total packets | Discarded packets |
| A | 0 | 22 | 0 |
| B | 0 | 23 | 0 |
| C | 0 | 23 | 0 |
| D | 0 | 23 | 0 |
| Quadrant | Total seconds | Saturated seconds | Saturation percentage |
|---|---|---|---|
| A | 6354 | 124 | 1.951527% |
| B | 6353 | 192 | 3.022194% |
| C | 6353 | 202 | 3.179600% |
| D | 6353 | 145 | 2.282386% |
Noise dominated data is calculated using 1-second bins in cleaned event files. If a bin has >2000 counts, and if more than 50% of those come from <1% of pixels, then it is considered to be noise-dominated and hence unusable.
| Quadrant | # 1 sec bins | Bins with >0 counts | Bins with >2000 counts | High rate bins dominated by noise | Noise dominated (total time) | Noise dominated (detector-on time) | Marked lightcurve |
|---|---|---|---|---|---|---|---|
| A | 7644 | 6355 | 0 | 0 | 0.00% | 0.00% | 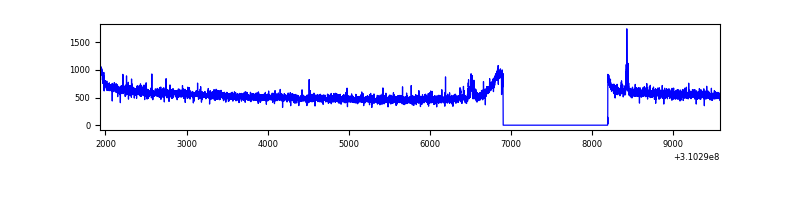 |
| B | 7643 | 6354 | 46 | 46 | 0.60% | 0.72% | 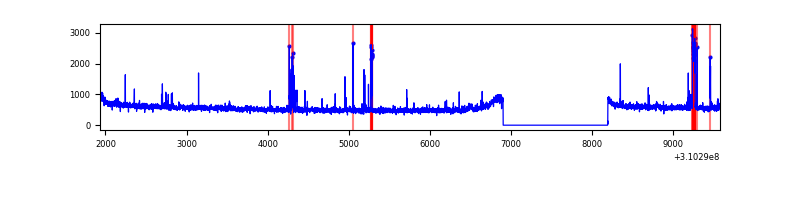 |
| C | 7643 | 6354 | 1 | 1 | 0.01% | 0.02% | 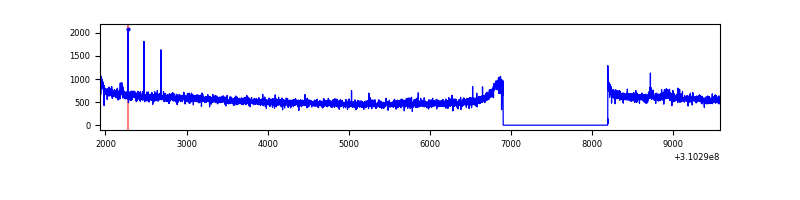 |
| D | 7643 | 6354 | 35 | 35 | 0.46% | 0.55% | 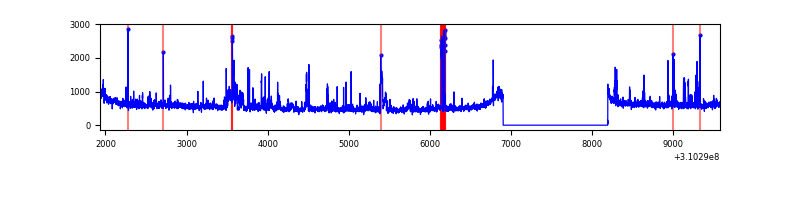 |
Top three noisy pixels from each quadrant. If the there are fewer than three noisy pixels in the level2.evt file, extra rows are filled as -1
| Pixel properties | Quadrant properties | ||||||
|---|---|---|---|---|---|---|---|
| Quadrant | DetID | PixID | Counts | Sigma | Mean | Median | Sigma |
| A | 4 | 2 | 29415 | 160.83 | 894 | 880 | 177.4 |
| A | 13 | 254 | 11454 | 59.6 | 894 | 880 | 177.4 |
| A | 0 | 226 | 7741 | 38.67 | 894 | 880 | 177.4 |
| B | 3 | 64 | 131063 | 792.26 | 883 | 865 | 164.3 |
| B | 10 | 246 | 51670 | 309.15 | 883 | 865 | 164.3 |
| B | 6 | 36 | 40292 | 239.92 | 883 | 865 | 164.3 |
| C | 14 | 238 | 138373 | 702.37 | 854 | 863 | 195.8 |
| C | 10 | 22 | 33866 | 168.57 | 854 | 863 | 195.8 |
| C | 13 | 61 | 6152 | 27.01 | 854 | 863 | 195.8 |
| D | 1 | 52 | 410671 | 1985.89 | 871 | 848 | 206.4 |
| D | 11 | 176 | 88968 | 427.01 | 871 | 848 | 206.4 |
| D | 13 | 172 | 47228 | 224.74 | 871 | 848 | 206.4 |
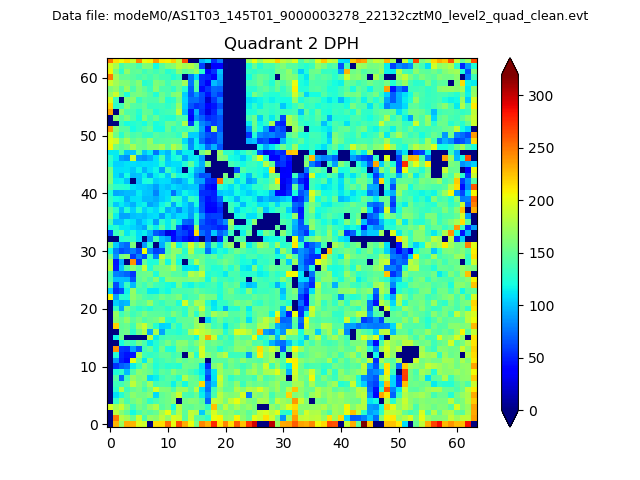
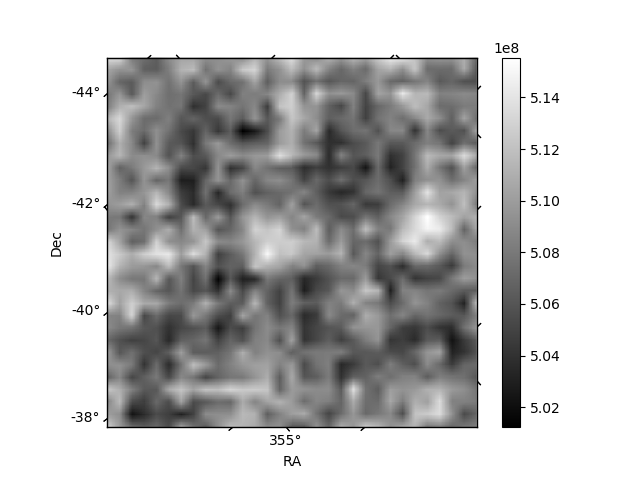
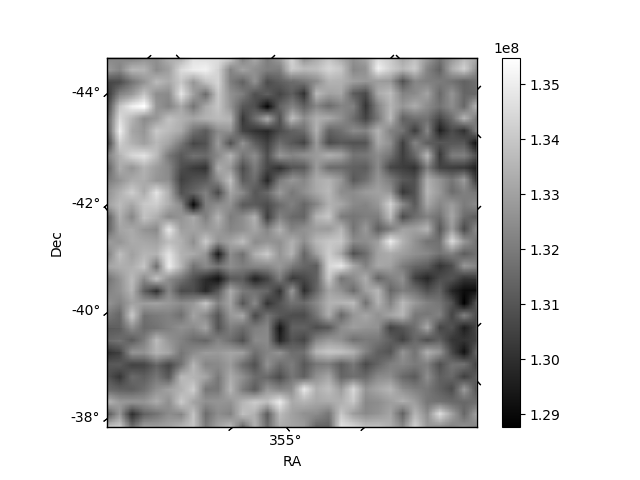
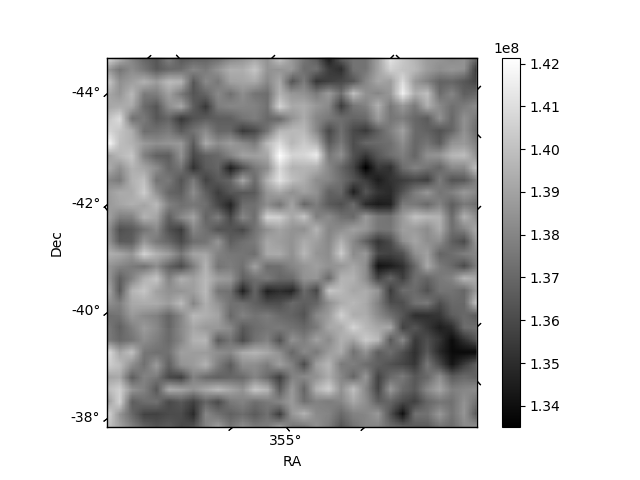
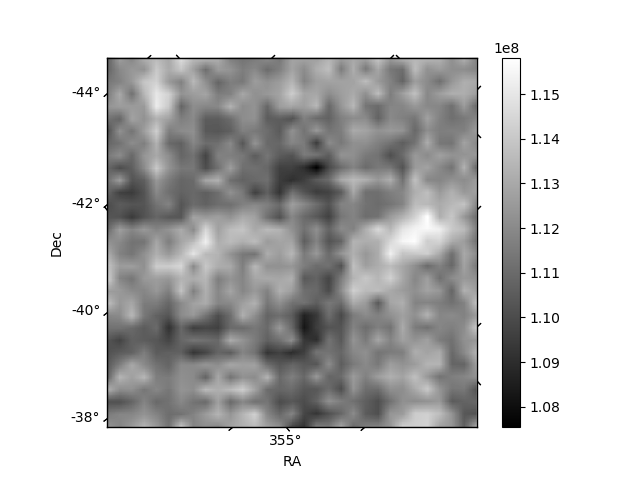
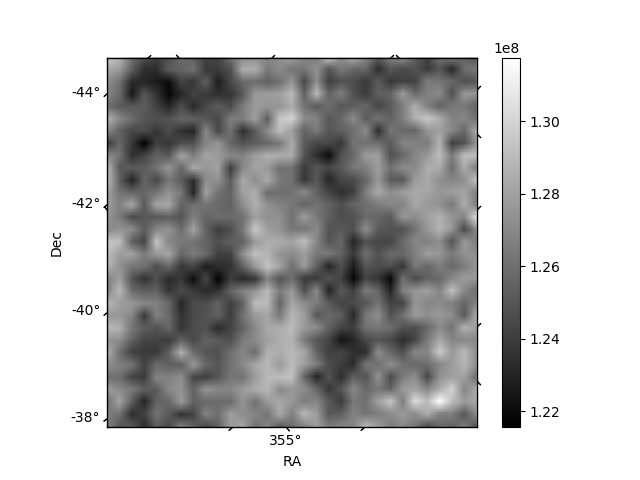
Histogram calculated using DETX and DETY for each event in the final _common_clean file
| Quadrant A | 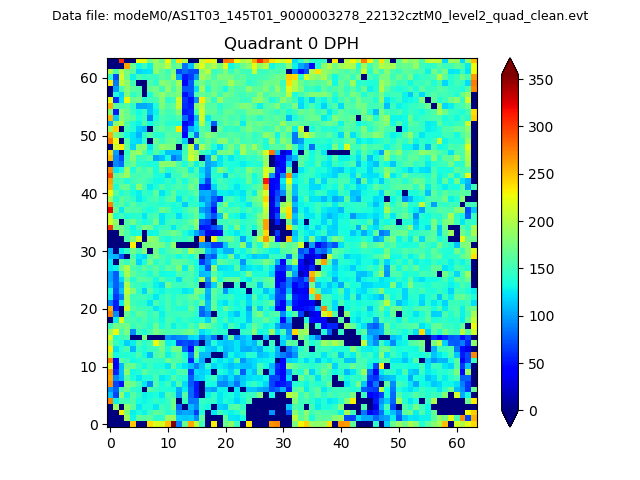 |
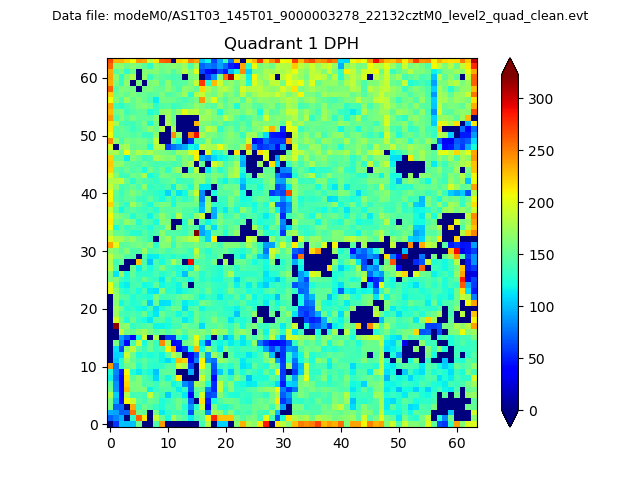 |
Quadrant B |
|---|---|---|---|
| Quadrant D | 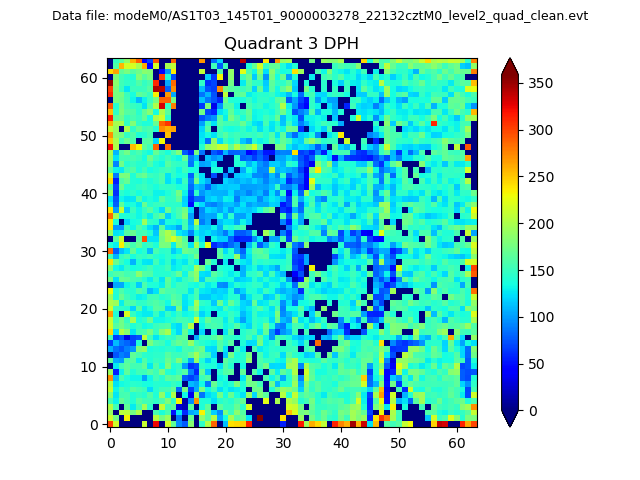 |
 |
Quadrant C |
| Plot type | Count rate plots | Images |
|---|---|---|
| Comparison with Poisson distribution Blue bars denote a histogram of data divided into 1 sec bins. Red curve is a Poisson curve with rate = median count rate of data. |
 |
 |
| Quadrant-wise count rates Data is divided into 100 sec bins |
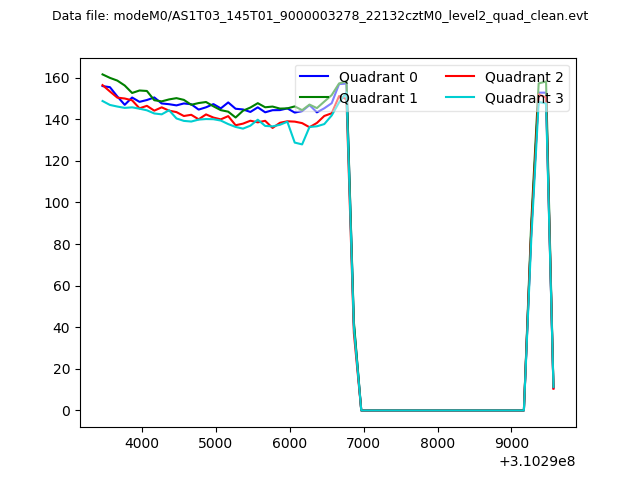 |
|
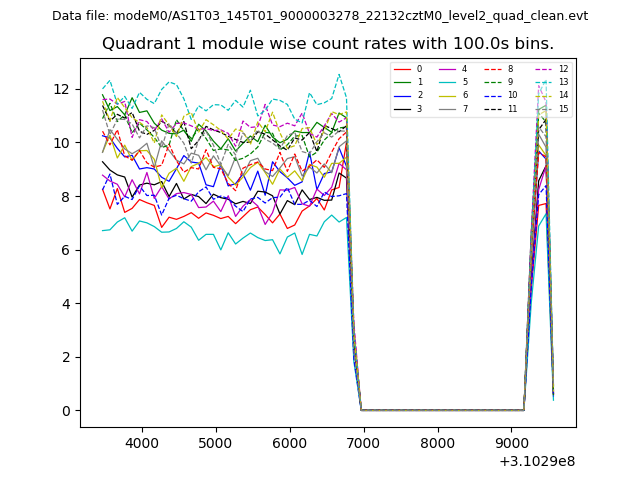
| Module-wise count rates for Quadrant A Data is divided into 100 sec bins |
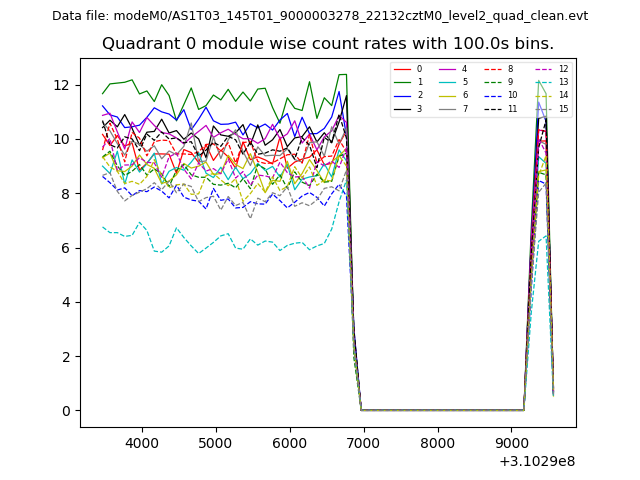 |
 |
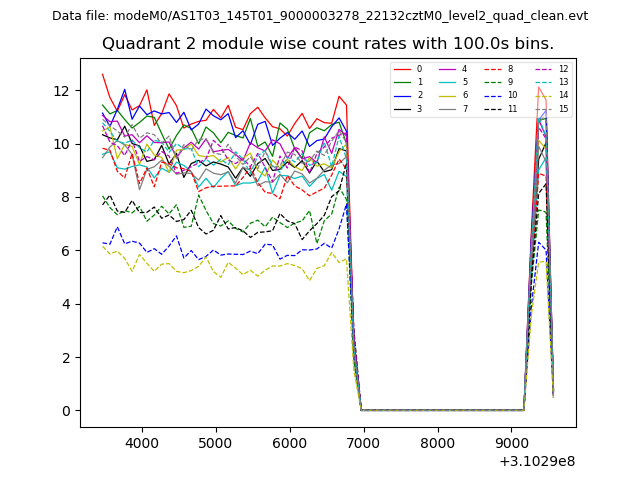
| Module-wise count rates for Quadrant B Data is divided into 100 sec bins |
 |
 |
| Module-wise count rates for Quadrant C Data is divided into 100 sec bins |
 |
 |
| Module-wise count rates for Quadrant D Data is divided into 100 sec bins |
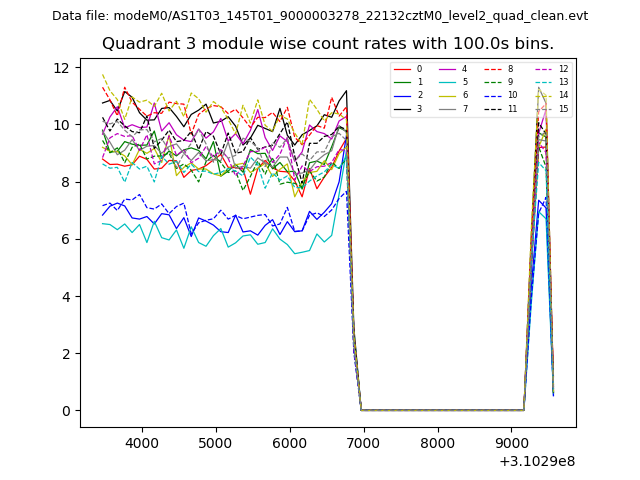 |
 |
| Parameter | Plot |
|---|---|
| CZT HV Monitor | 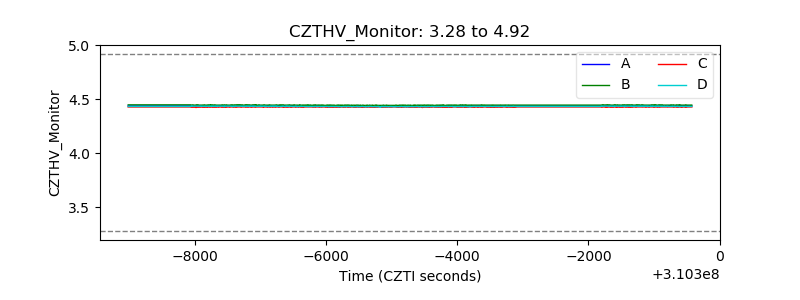 |
| D_VDD | 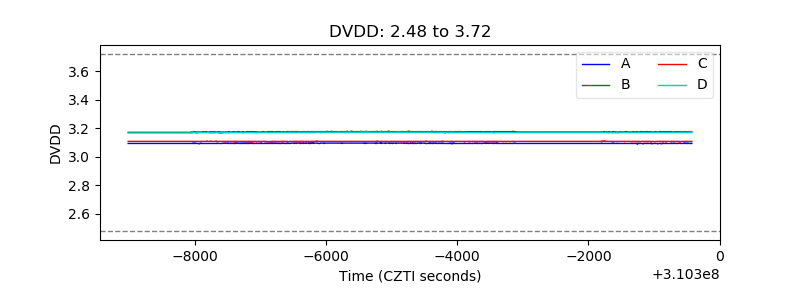 |
| Temperature 1 | 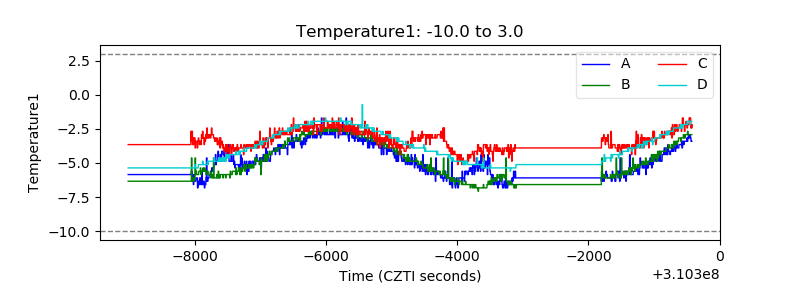 |
| Veto HV Monitor | 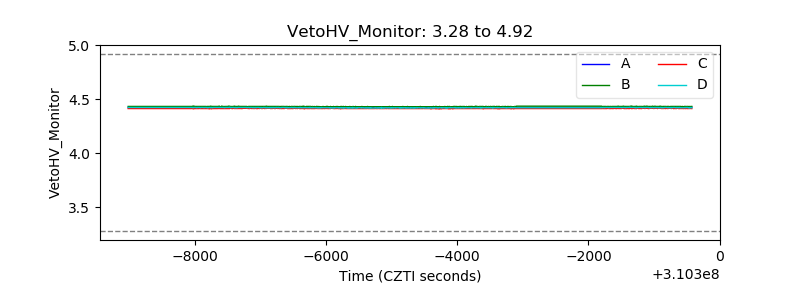 |
| Veto LLD | 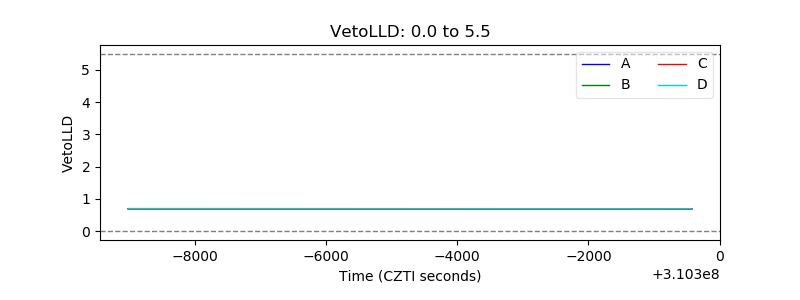 |
| Alpha Counter | 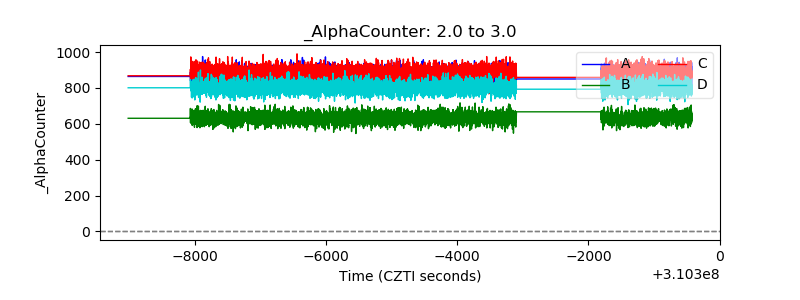 |
| _CPM_Rate | 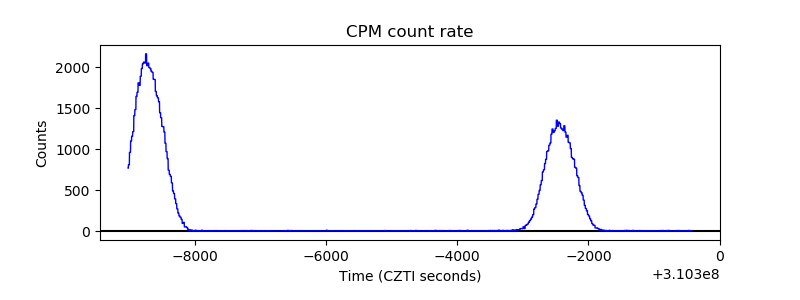 |
| CZT Counter | 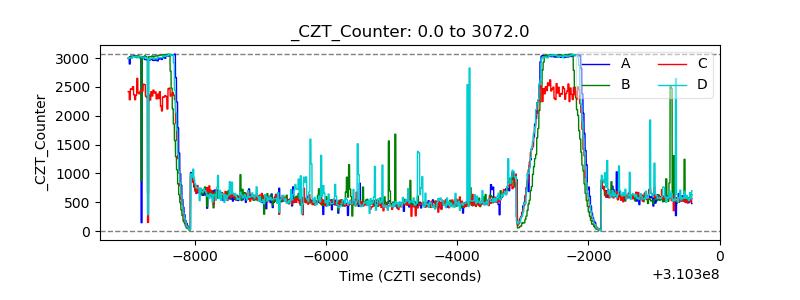 |
| +2.5 Volts monitor |  |
| +5 Volts monitor | 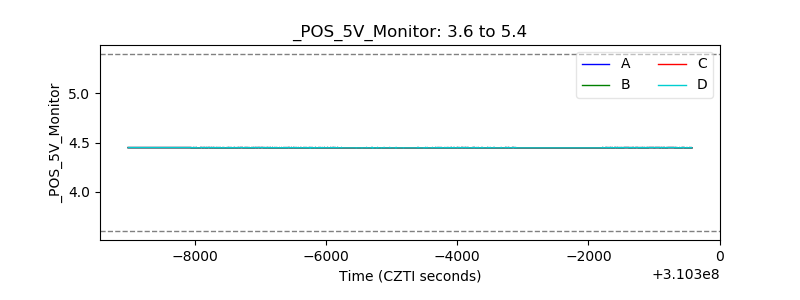 |
| _ROLL_ROT | 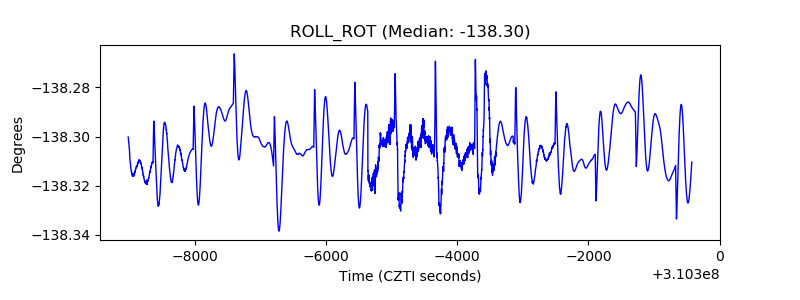 |
| _Roll_DEC | 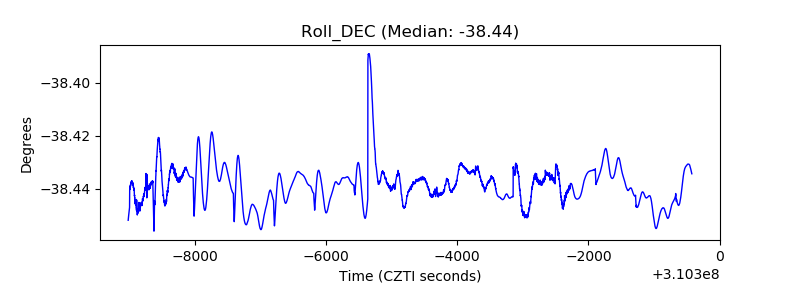 |
| _Roll_RA | 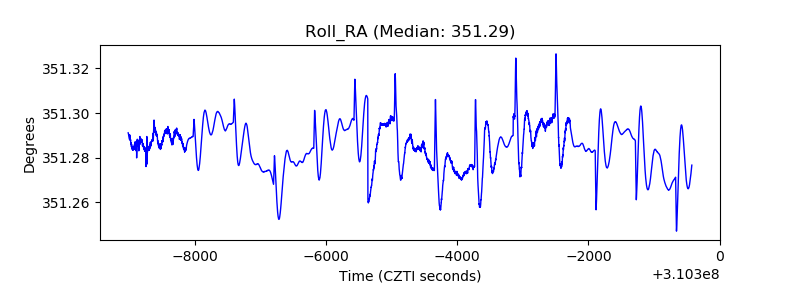 |
| Veto Counter | 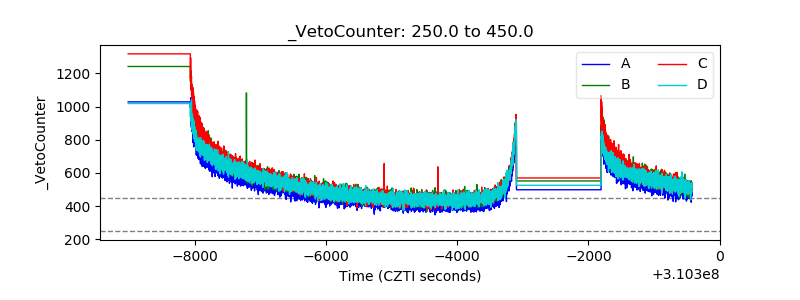 |