| Param | Original file | Final file |
|---|---|---|
| Filename | modeM0/AS1T03_145T01_9000003278_22133cztM0_level2.evt | modeM0/AS1T03_145T01_9000003278_22133cztM0_level2_quad_clean.evt |
| Size (bytes) | 485,712,000 | 96,189,120 |
| Size | 463.2 MB | 91.7 MB |
| Events in quadrant A | 3,348,708 | 629,629 |
| Events in quadrant B | 3,665,734 | 635,313 |
| Events in quadrant C | 3,373,566 | 606,951 |
| Events in quadrant D | 3,888,049 | 595,491 |
| Mode M0 | |||
|---|---|---|---|
| Quadrant | BADHDUFLAG | Total packets | Discarded packets |
| A | 0 | 13818 | 2 |
| B | 0 | 14806 | 2 |
| C | 0 | 14056 | 2 |
| D | 0 | 15599 | 2 |
| Mode SS | |||
|---|---|---|---|
| Quadrant | BADHDUFLAG | Total packets | Discarded packets |
| A | 0 | 128 | 0 |
| B | 0 | 128 | 0 |
| C | 0 | 128 | 0 |
| D | 0 | 128 | 0 |
| Mode M9 | |||
|---|---|---|---|
| Quadrant | BADHDUFLAG | Total packets | Discarded packets |
| A | 0 | 19 | 0 |
| B | 0 | 20 | 0 |
| C | 0 | 20 | 0 |
| D | 0 | 20 | 0 |
| Quadrant | Total seconds | Saturated seconds | Saturation percentage |
|---|---|---|---|
| A | 6394 | 111 | 1.736003% |
| B | 6393 | 203 | 3.175348% |
| C | 6393 | 171 | 2.674801% |
| D | 6393 | 183 | 2.862506% |
Noise dominated data is calculated using 1-second bins in cleaned event files. If a bin has >2000 counts, and if more than 50% of those come from <1% of pixels, then it is considered to be noise-dominated and hence unusable.
| Quadrant | # 1 sec bins | Bins with >0 counts | Bins with >2000 counts | High rate bins dominated by noise | Noise dominated (total time) | Noise dominated (detector-on time) | Marked lightcurve |
|---|---|---|---|---|---|---|---|
| A | 7589 | 6396 | 1 | 1 | 0.01% | 0.02% | 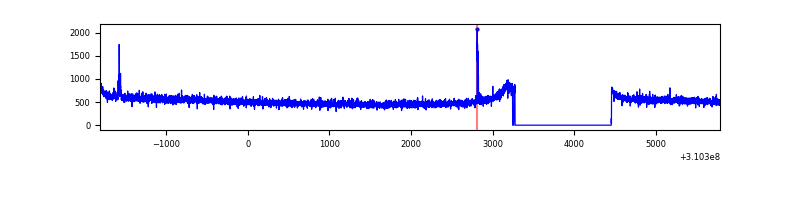 |
| B | 7588 | 6395 | 65 | 65 | 0.86% | 1.02% | 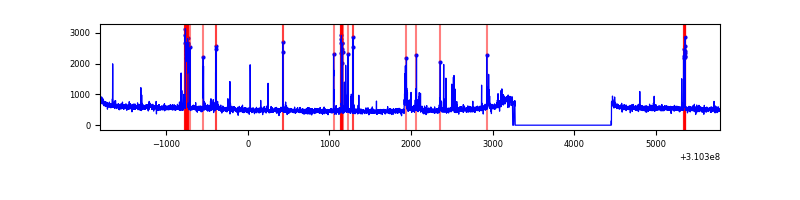 |
| C | 7588 | 6395 | 0 | 0 | 0.00% | 0.00% | 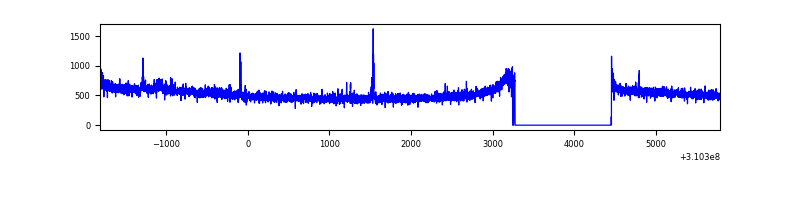 |
| D | 7588 | 6395 | 81 | 81 | 1.07% | 1.27% | 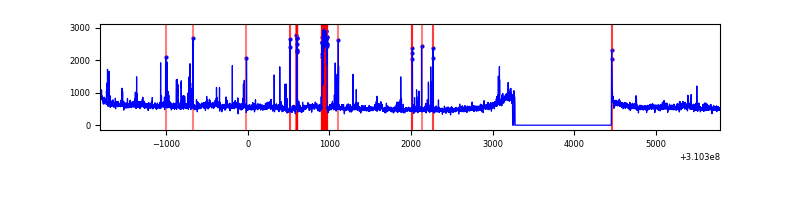 |
Top three noisy pixels from each quadrant. If the there are fewer than three noisy pixels in the level2.evt file, extra rows are filled as -1
| Pixel properties | Quadrant properties | ||||||
|---|---|---|---|---|---|---|---|
| Quadrant | DetID | PixID | Counts | Sigma | Mean | Median | Sigma |
| A | 5 | 16 | 17651 | 98.46 | 862 | 847 | 170.7 |
| A | 13 | 254 | 11497 | 62.4 | 862 | 847 | 170.7 |
| A | 4 | 2 | 10589 | 57.08 | 862 | 847 | 170.7 |
| B | 3 | 64 | 234538 | 1464.32 | 849 | 830 | 159.6 |
| B | 0 | 230 | 50206 | 309.37 | 849 | 830 | 159.6 |
| B | 11 | 51 | 23357 | 141.14 | 849 | 830 | 159.6 |
| C | 14 | 238 | 130424 | 689.6 | 818 | 825 | 187.9 |
| C | 10 | 22 | 47016 | 245.78 | 818 | 825 | 187.9 |
| C | 0 | 10 | 6392 | 29.62 | 818 | 825 | 187.9 |
| D | 1 | 52 | 368288 | 1835.24 | 834 | 810 | 200.2 |
| D | 11 | 176 | 229634 | 1142.78 | 834 | 810 | 200.2 |
| D | 2 | 133 | 56723 | 279.24 | 834 | 810 | 200.2 |
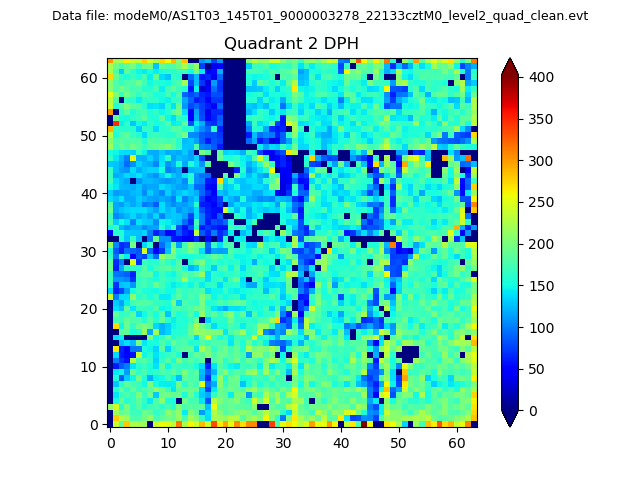
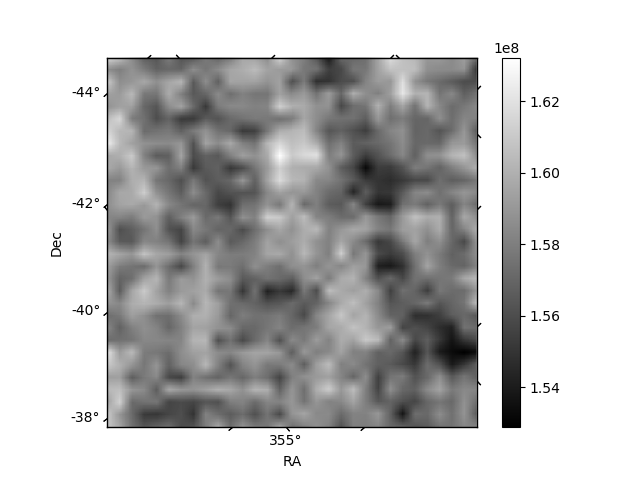
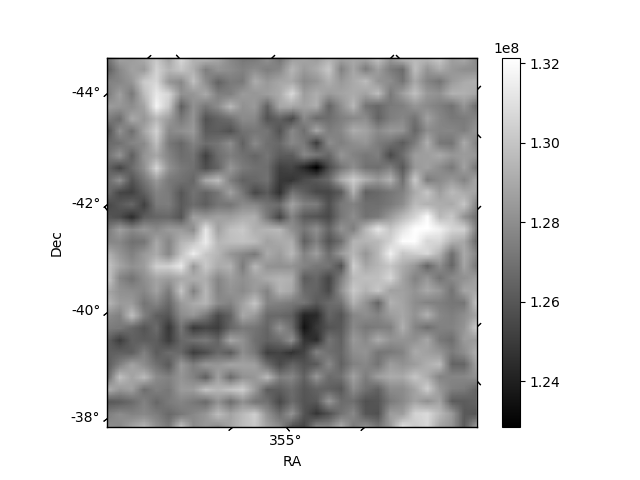
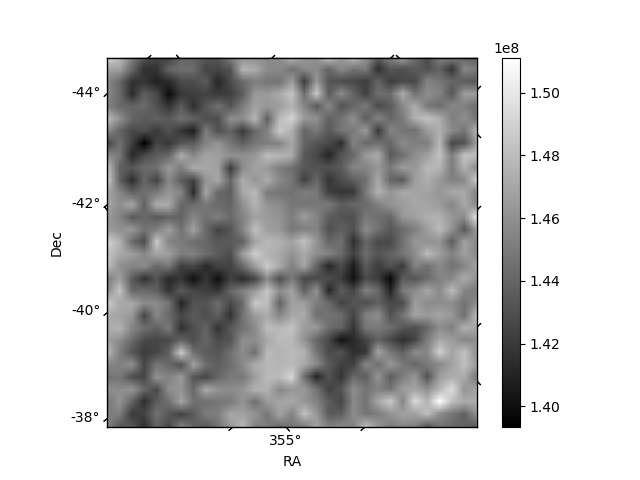
Histogram calculated using DETX and DETY for each event in the final _common_clean file
| Quadrant A | 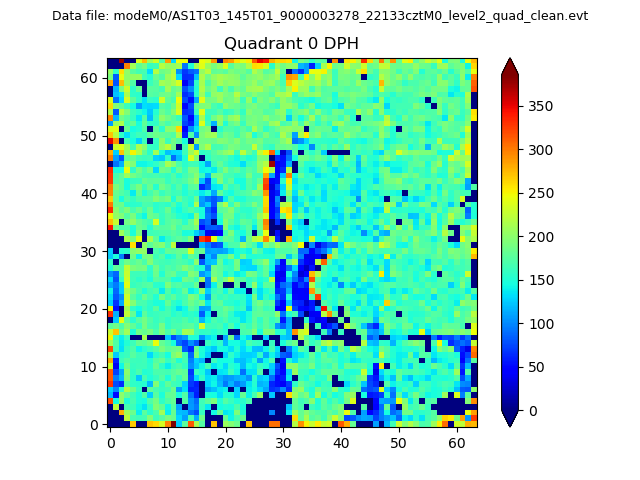 |
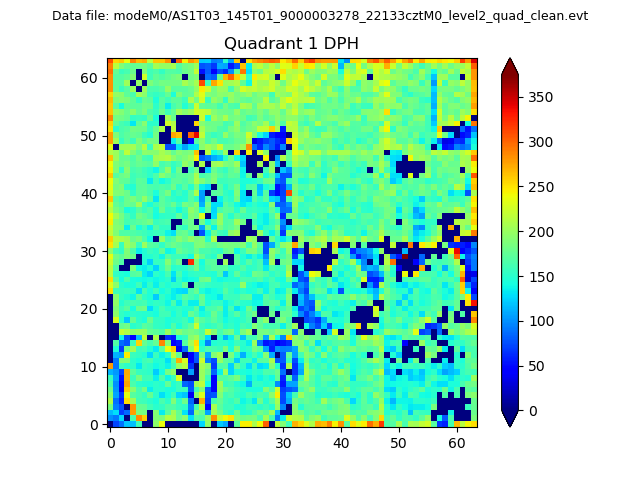 |
Quadrant B |
|---|---|---|---|
| Quadrant D | 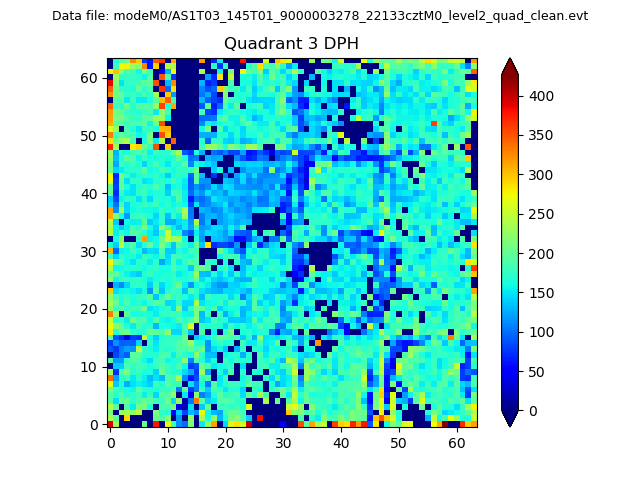 |
 |
Quadrant C |
| Plot type | Count rate plots | Images |
|---|---|---|
| Comparison with Poisson distribution Blue bars denote a histogram of data divided into 1 sec bins. Red curve is a Poisson curve with rate = median count rate of data. |
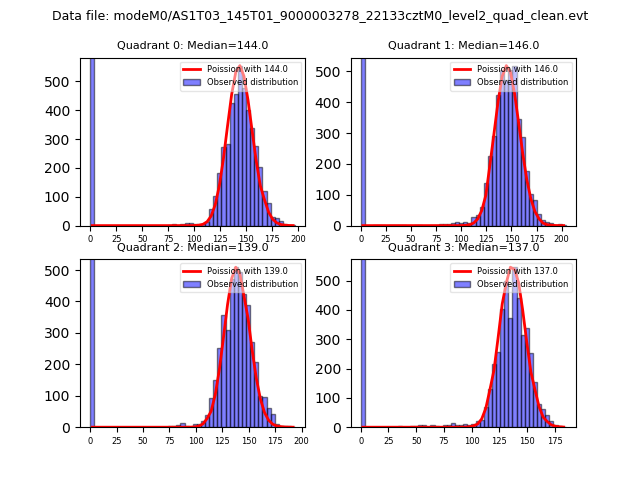 |
 |
| Quadrant-wise count rates Data is divided into 100 sec bins |
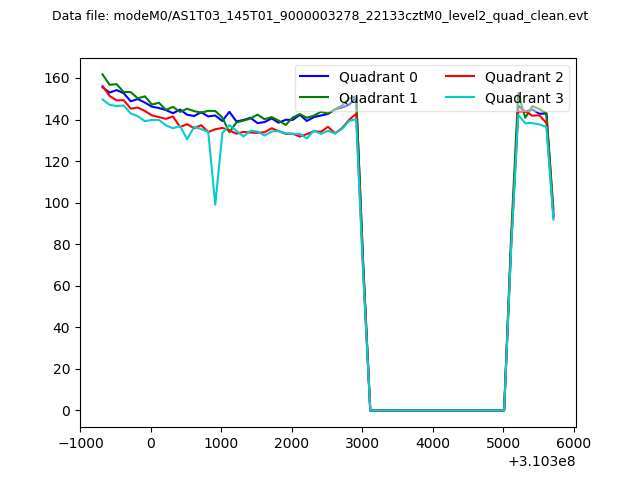 |
|
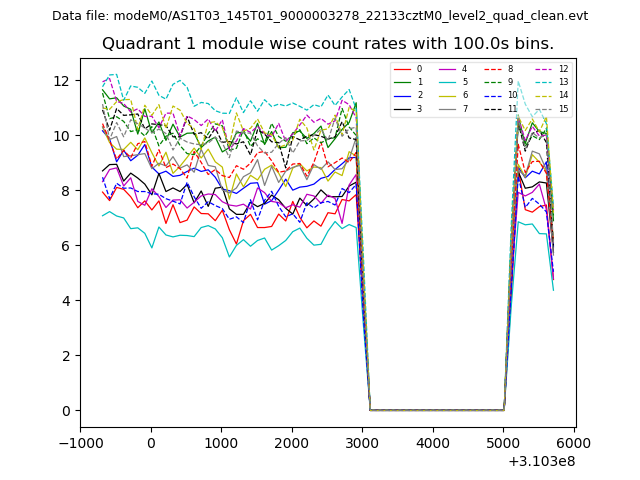
| Module-wise count rates for Quadrant A Data is divided into 100 sec bins |
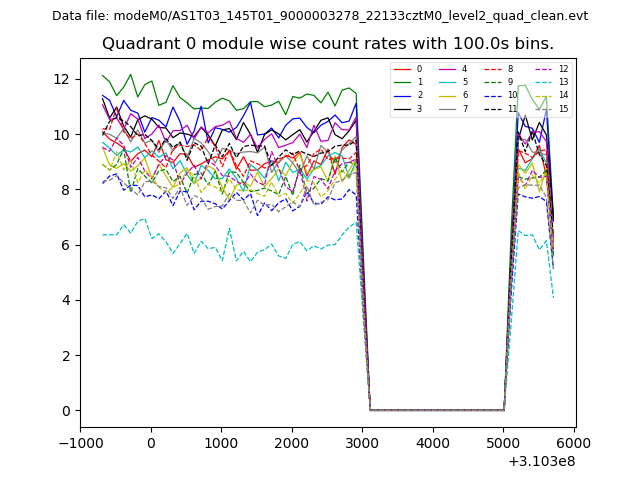 |
 |
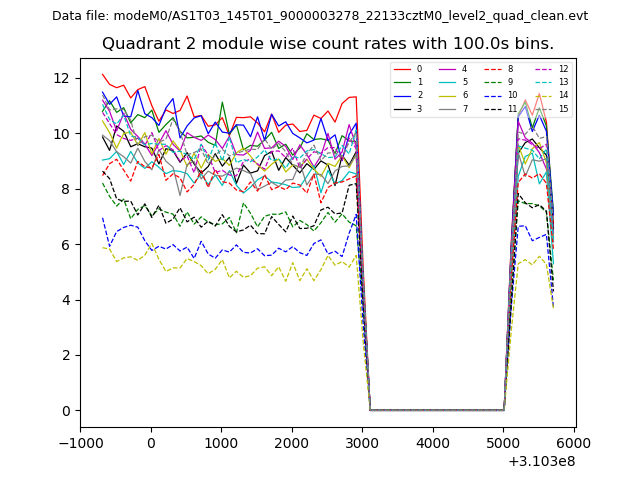
| Module-wise count rates for Quadrant B Data is divided into 100 sec bins |
 |
 |
| Module-wise count rates for Quadrant C Data is divided into 100 sec bins |
 |
 |
| Module-wise count rates for Quadrant D Data is divided into 100 sec bins |
 |
 |
| Parameter | Plot |
|---|---|
| CZT HV Monitor | 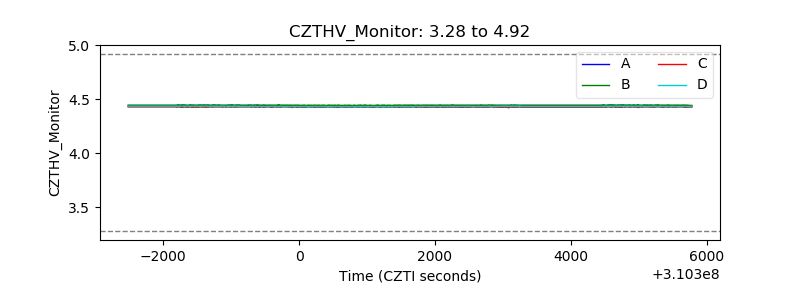 |
| D_VDD | 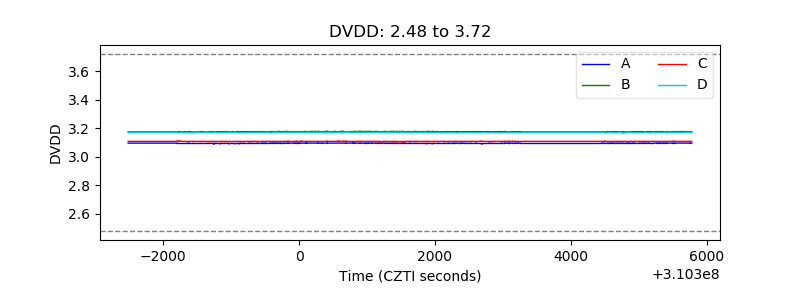 |
| Temperature 1 | 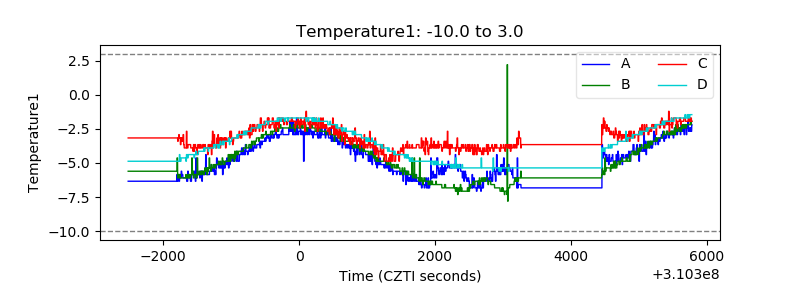 |
| Veto HV Monitor | 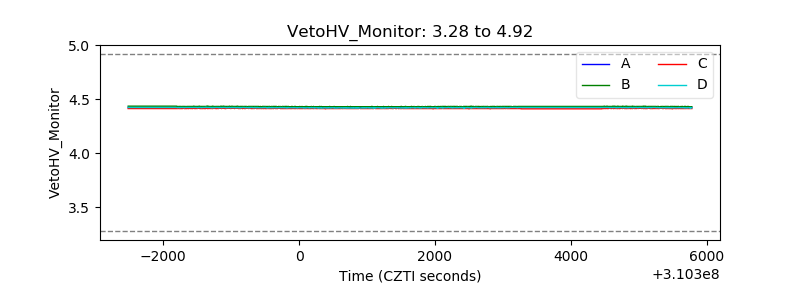 |
| Veto LLD | 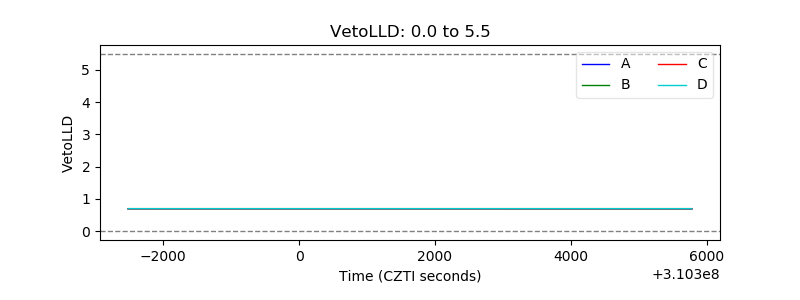 |
| Alpha Counter | 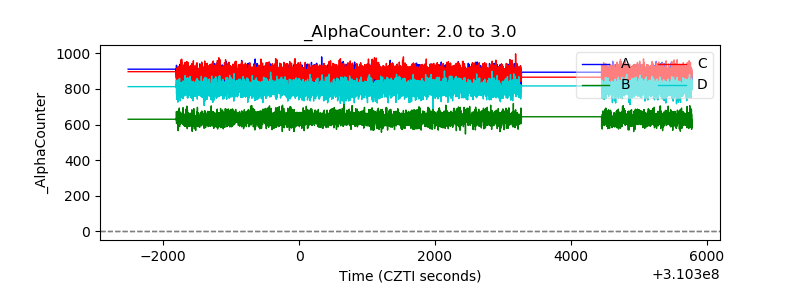 |
| _CPM_Rate | 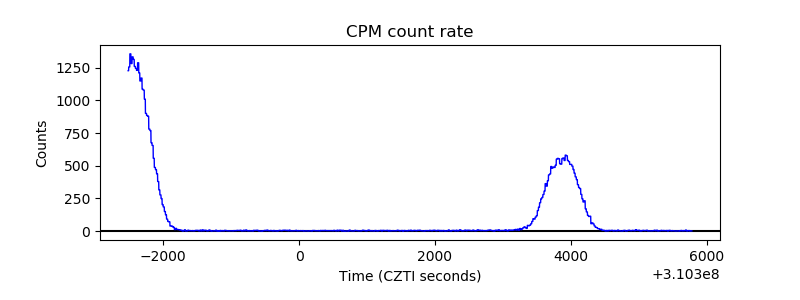 |
| CZT Counter |  |
| +2.5 Volts monitor |  |
| +5 Volts monitor |  |
| _ROLL_ROT |  |
| _Roll_DEC |  |
| _Roll_RA |  |
| Veto Counter | 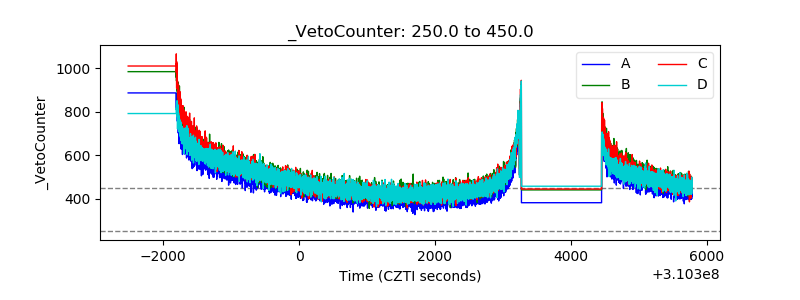 |