| Param | Original file | Final file |
|---|---|---|
| Filename | modeM0/AS1T03_145T01_9000003278_22134cztM0_level2.evt | modeM0/AS1T03_145T01_9000003278_22134cztM0_level2_quad_clean.evt |
| Size (bytes) | 439,004,160 | 98,472,960 |
| Size | 418.7 MB | 93.9 MB |
| Events in quadrant A | 3,015,437 | 651,526 |
| Events in quadrant B | 3,105,779 | 657,890 |
| Events in quadrant C | 3,096,981 | 627,174 |
| Events in quadrant D | 3,656,358 | 613,563 |
| Mode M0 | |||
|---|---|---|---|
| Quadrant | BADHDUFLAG | Total packets | Discarded packets |
| A | 0 | 12813 | 1 |
| B | 0 | 13045 | 1 |
| C | 0 | 13130 | 1 |
| D | 0 | 14603 | 1 |
| Mode SS | |||
|---|---|---|---|
| Quadrant | BADHDUFLAG | Total packets | Discarded packets |
| A | 0 | 126 | 0 |
| B | 0 | 126 | 0 |
| C | 0 | 126 | 0 |
| D | 0 | 126 | 0 |
| Mode M9 | |||
|---|---|---|---|
| Quadrant | BADHDUFLAG | Total packets | Discarded packets |
| A | 0 | 9 | 0 |
| B | 0 | 9 | 0 |
| C | 0 | 9 | 0 |
| D | 0 | 9 | 0 |
| Quadrant | Total seconds | Saturated seconds | Saturation percentage |
|---|---|---|---|
| A | 6188 | 71 | 1.147382% |
| B | 6189 | 111 | 1.793505% |
| C | 6189 | 96 | 1.551139% |
| D | 6189 | 153 | 2.472128% |
Noise dominated data is calculated using 1-second bins in cleaned event files. If a bin has >2000 counts, and if more than 50% of those come from <1% of pixels, then it is considered to be noise-dominated and hence unusable.
| Quadrant | # 1 sec bins | Bins with >0 counts | Bins with >2000 counts | High rate bins dominated by noise | Noise dominated (total time) | Noise dominated (detector-on time) | Marked lightcurve |
|---|---|---|---|---|---|---|---|
| A | 7118 | 6189 | 1 | 1 | 0.01% | 0.02% | 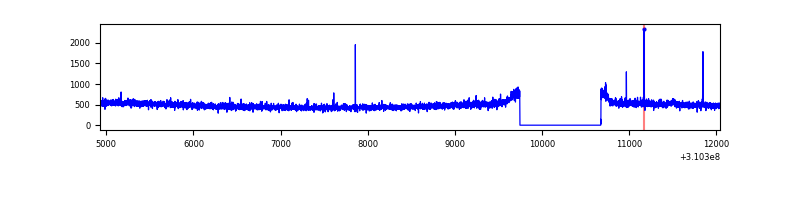 |
| B | 7119 | 6190 | 9 | 9 | 0.13% | 0.15% | 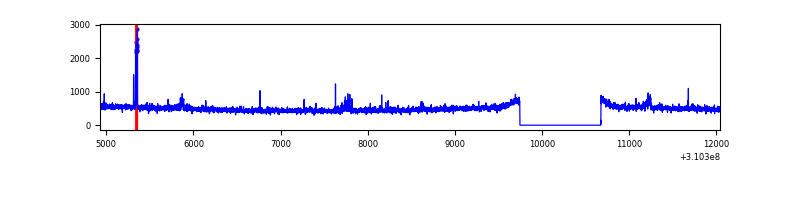 |
| C | 7119 | 6190 | 0 | 0 | 0.00% | 0.00% | 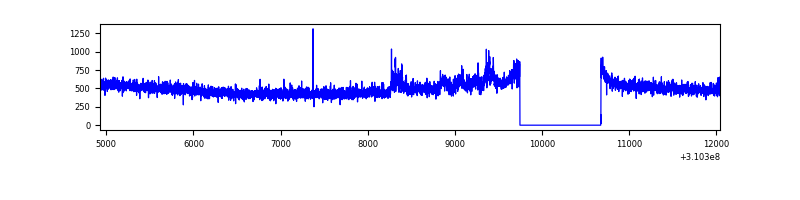 |
| D | 7119 | 6190 | 87 | 87 | 1.22% | 1.41% | 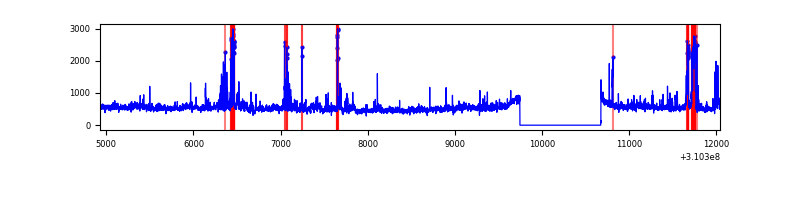 |
Top three noisy pixels from each quadrant. If the there are fewer than three noisy pixels in the level2.evt file, extra rows are filled as -1
| Pixel properties | Quadrant properties | ||||||
|---|---|---|---|---|---|---|---|
| Quadrant | DetID | PixID | Counts | Sigma | Mean | Median | Sigma |
| A | 5 | 16 | 24665 | 154.04 | 776 | 763 | 155.2 |
| A | 13 | 254 | 11546 | 69.49 | 776 | 763 | 155.2 |
| A | 0 | 226 | 6545 | 37.26 | 776 | 763 | 155.2 |
| B | 3 | 64 | 52195 | 354.93 | 770 | 753 | 144.9 |
| B | 4 | 216 | 18090 | 119.62 | 770 | 753 | 144.9 |
| B | 12 | 111 | 17700 | 116.93 | 770 | 753 | 144.9 |
| C | 14 | 238 | 115733 | 667.89 | 737 | 741 | 172.2 |
| C | 9 | 54 | 104365 | 601.87 | 737 | 741 | 172.2 |
| C | 13 | 61 | 5048 | 25.02 | 737 | 741 | 172.2 |
| D | 1 | 52 | 419520 | 2319.87 | 750 | 731 | 180.5 |
| D | 11 | 176 | 185864 | 1025.54 | 750 | 731 | 180.5 |
| D | 13 | 172 | 109647 | 603.34 | 750 | 731 | 180.5 |
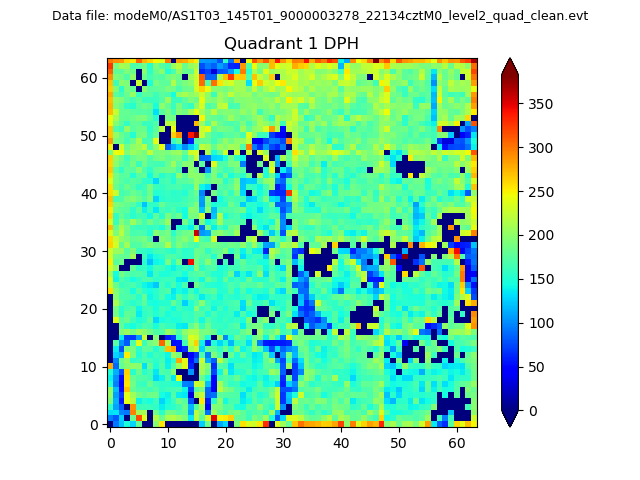
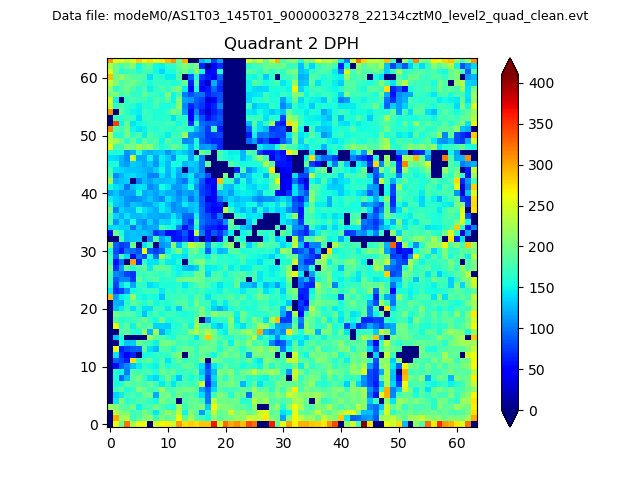
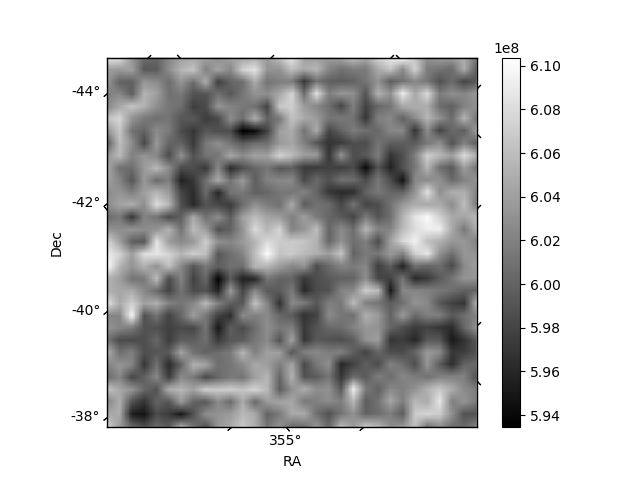
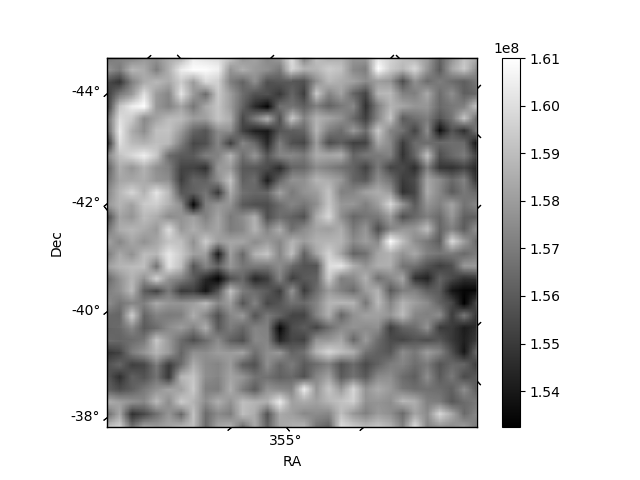
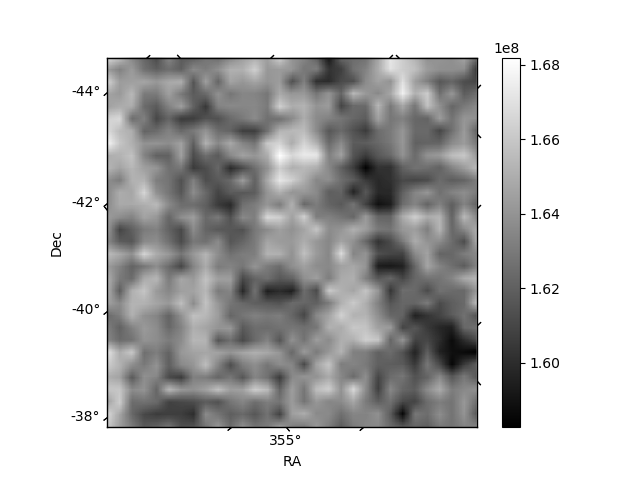
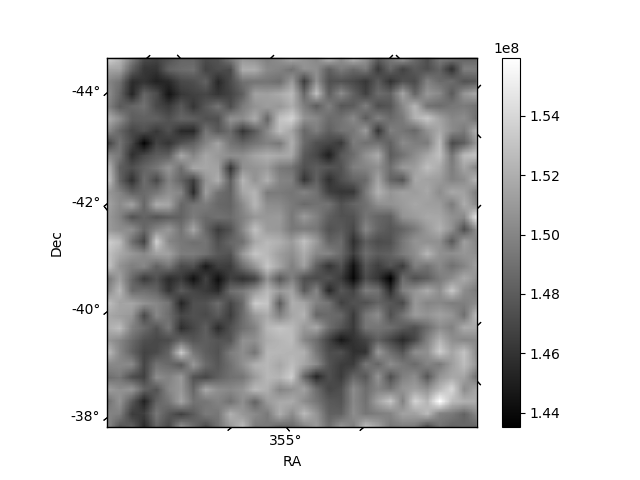
Histogram calculated using DETX and DETY for each event in the final _common_clean file
| Quadrant A |  |
 |
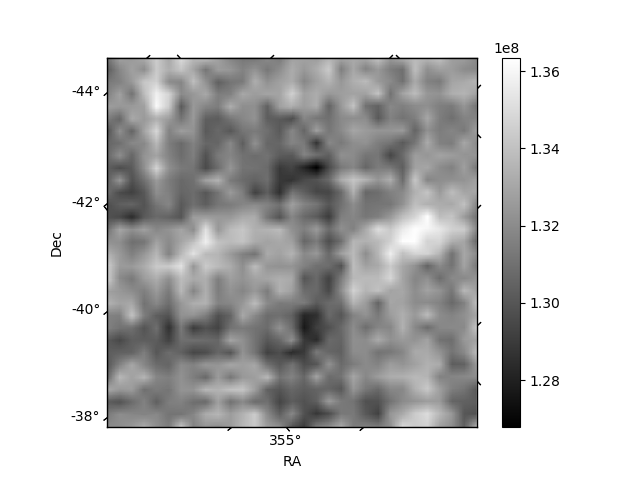
Quadrant B |
|---|---|---|---|
| Quadrant D | 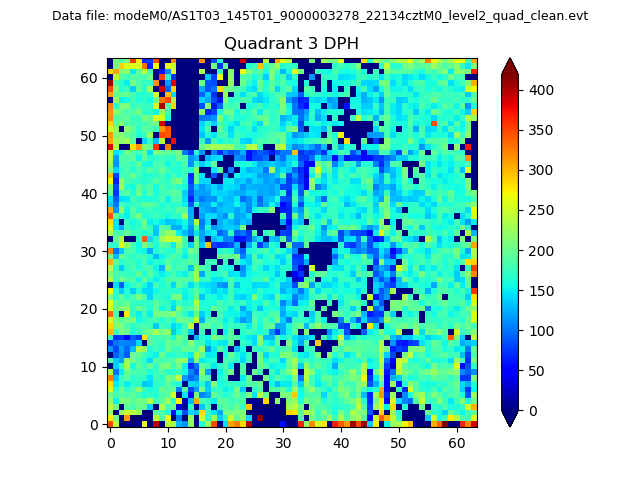 |
 |
Quadrant C |
| Plot type | Count rate plots | Images |
|---|---|---|
| Comparison with Poisson distribution Blue bars denote a histogram of data divided into 1 sec bins. Red curve is a Poisson curve with rate = median count rate of data. |
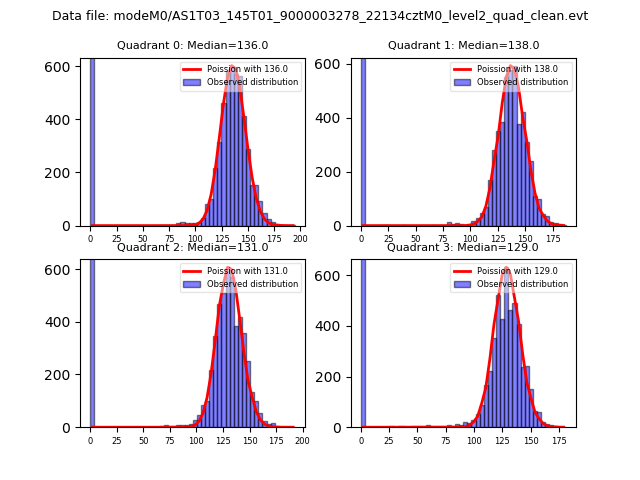 |
 |
| Quadrant-wise count rates Data is divided into 100 sec bins |
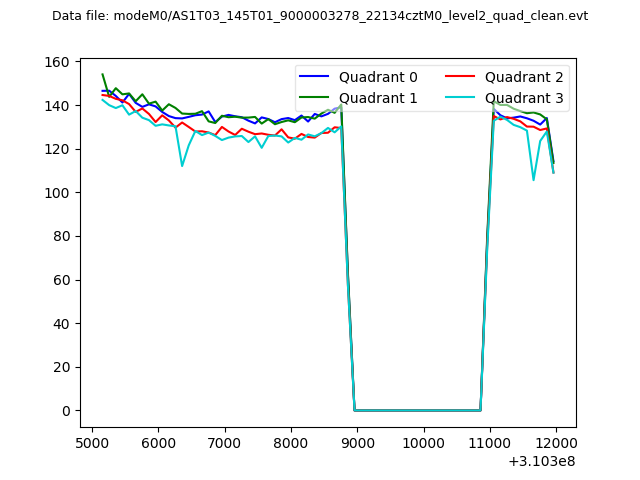 |
|
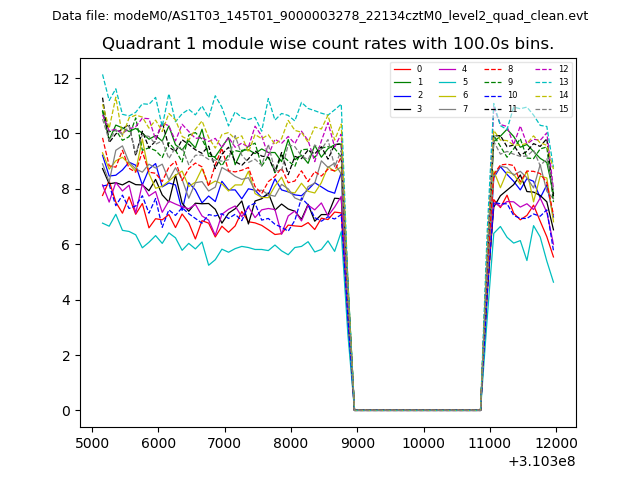
| Module-wise count rates for Quadrant A Data is divided into 100 sec bins |
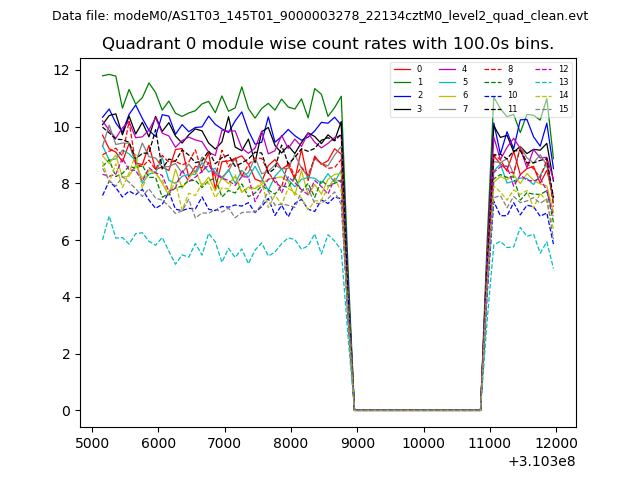 |
 |
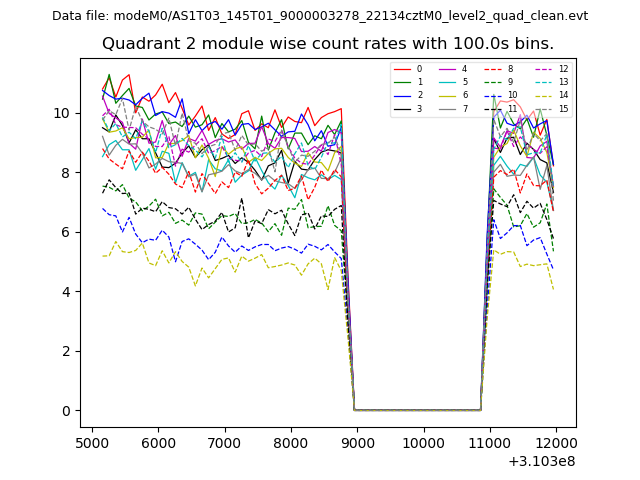
| Module-wise count rates for Quadrant B Data is divided into 100 sec bins |
 |
 |
| Module-wise count rates for Quadrant C Data is divided into 100 sec bins |
 |
 |
| Module-wise count rates for Quadrant D Data is divided into 100 sec bins |
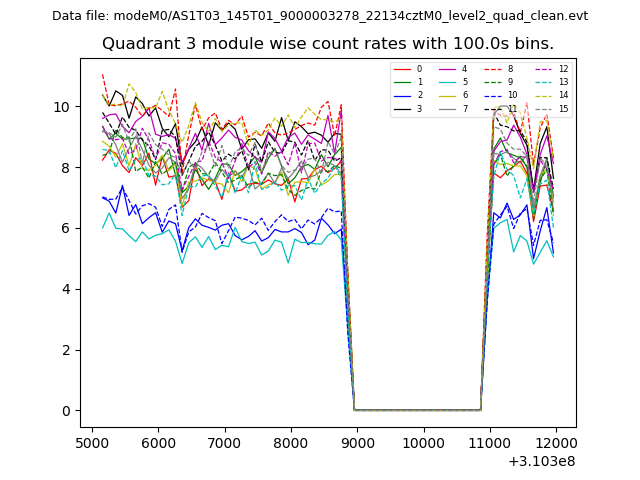 |
 |
| Parameter | Plot |
|---|---|
| CZT HV Monitor | 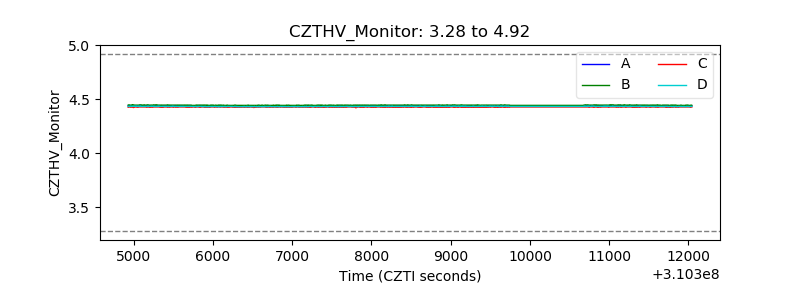 |
| D_VDD | 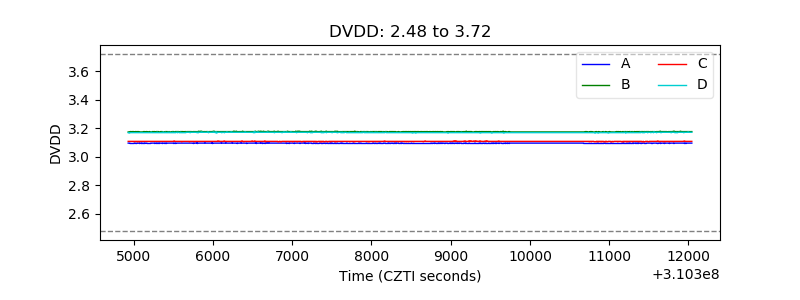 |
| Temperature 1 | 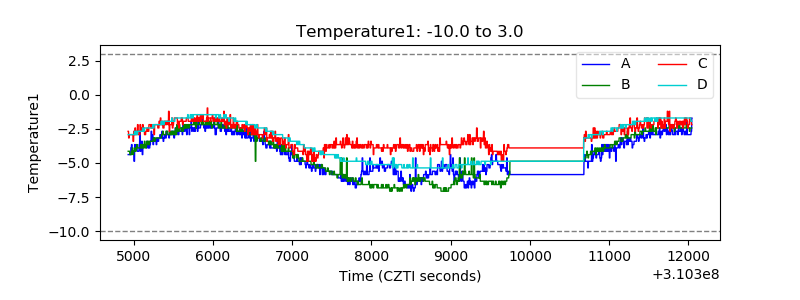 |
| Veto HV Monitor | 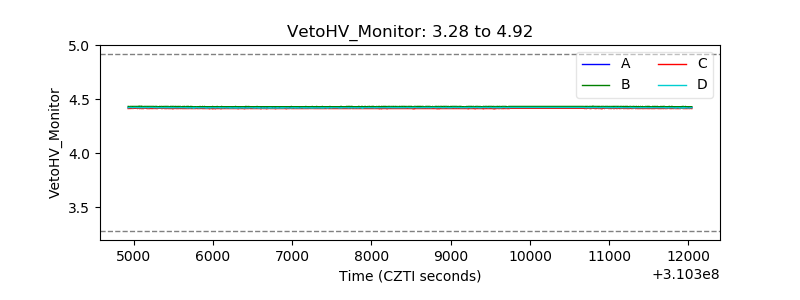 |
| Veto LLD | 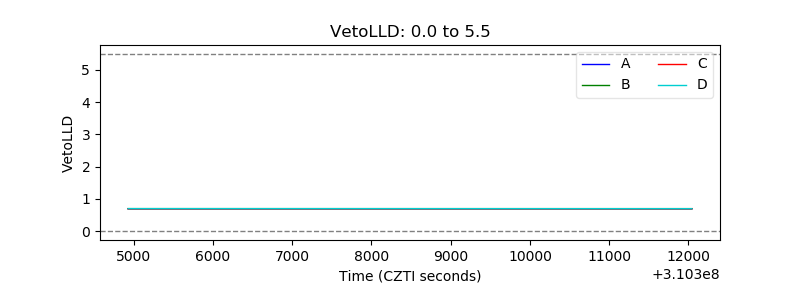 |
| Alpha Counter | 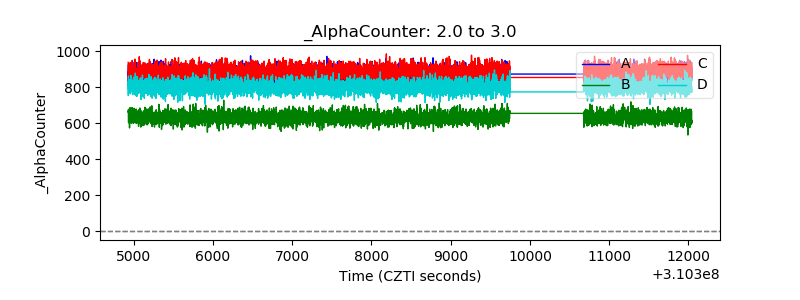 |
| _CPM_Rate | 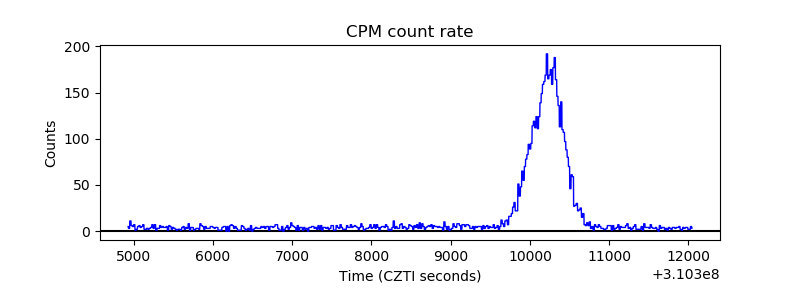 |
| CZT Counter | 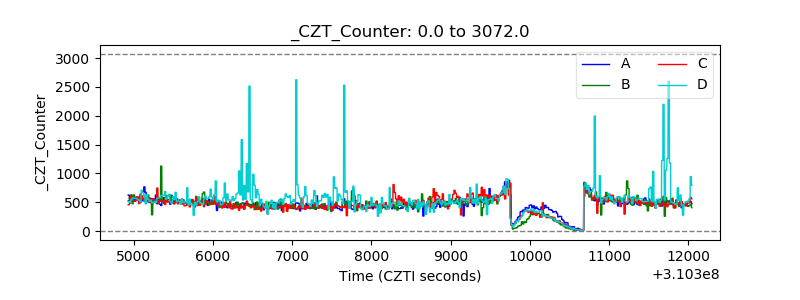 |
| +2.5 Volts monitor | 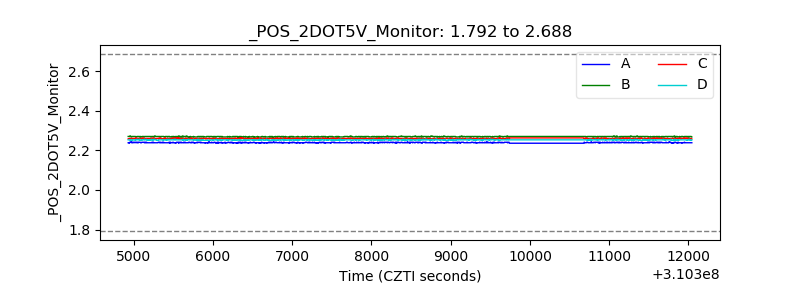 |
| +5 Volts monitor | 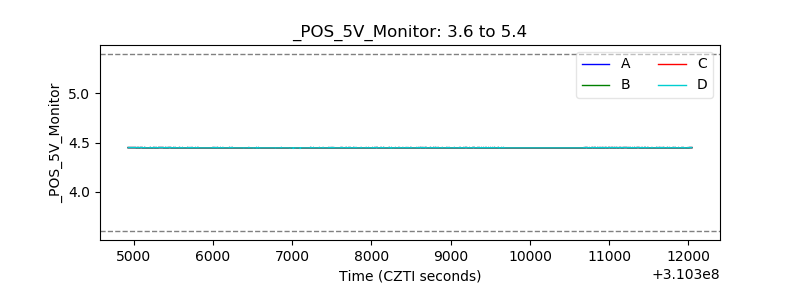 |
| _ROLL_ROT | 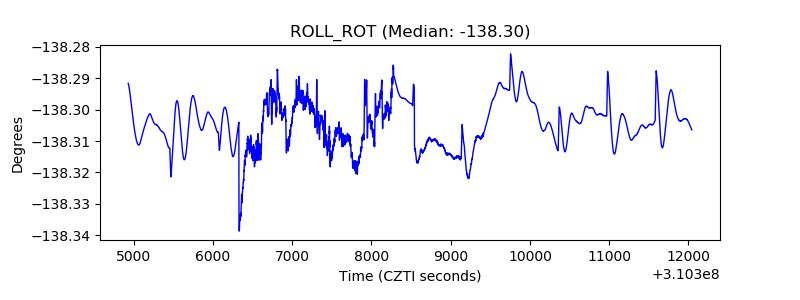 |
| _Roll_DEC |  |
| _Roll_RA |  |
| Veto Counter | 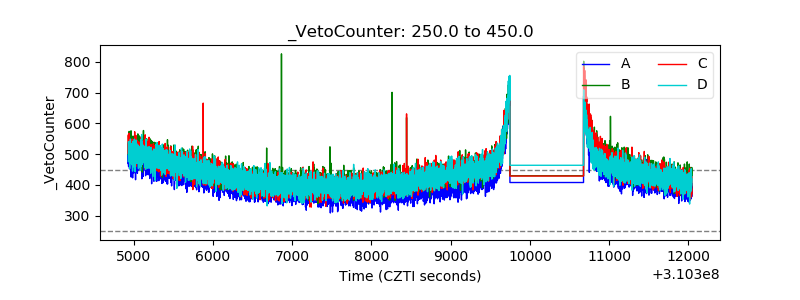 |