| Param | Original file | Final file |
|---|---|---|
| Filename | modeM0/AS1T03_145T01_9000003278_22135cztM0_level2.evt | modeM0/AS1T03_145T01_9000003278_22135cztM0_level2_quad_clean.evt |
| Size (bytes) | 616,187,520 | 106,784,640 |
| Size | 587.6 MB | 101.8 MB |
| Events in quadrant A | 3,576,972 | 707,243 |
| Events in quadrant B | 3,643,252 | 717,068 |
| Events in quadrant C | 3,928,750 | 681,798 |
| Events in quadrant D | 7,011,246 | 613,320 |
| Mode M0 | |||
|---|---|---|---|
| Quadrant | BADHDUFLAG | Total packets | Discarded packets |
| A | 0 | 15398 | 2 |
| B | 0 | 15542 | 2 |
| C | 0 | 16434 | 2 |
| D | 0 | 25734 | 2 |
| Mode SS | |||
|---|---|---|---|
| Quadrant | BADHDUFLAG | Total packets | Discarded packets |
| A | 0 | 150 | 0 |
| B | 0 | 150 | 0 |
| C | 0 | 150 | 0 |
| D | 0 | 150 | 0 |
| Mode M9 | |||
|---|---|---|---|
| Quadrant | BADHDUFLAG | Total packets | Discarded packets |
| A | 0 | 11 | 0 |
| B | 0 | 12 | 0 |
| C | 0 | 12 | 0 |
| D | 0 | 12 | 0 |
| Quadrant | Total seconds | Saturated seconds | Saturation percentage |
|---|---|---|---|
| A | 7389 | 90 | 1.218027% |
| B | 7389 | 122 | 1.651103% |
| C | 7389 | 144 | 1.948843% |
| D | 7389 | 1269 | 17.174178% |
Noise dominated data is calculated using 1-second bins in cleaned event files. If a bin has >2000 counts, and if more than 50% of those come from <1% of pixels, then it is considered to be noise-dominated and hence unusable.
| Quadrant | # 1 sec bins | Bins with >0 counts | Bins with >2000 counts | High rate bins dominated by noise | Noise dominated (total time) | Noise dominated (detector-on time) | Marked lightcurve |
|---|---|---|---|---|---|---|---|
| A | 7914 | 7390 | 2 | 2 | 0.03% | 0.03% | 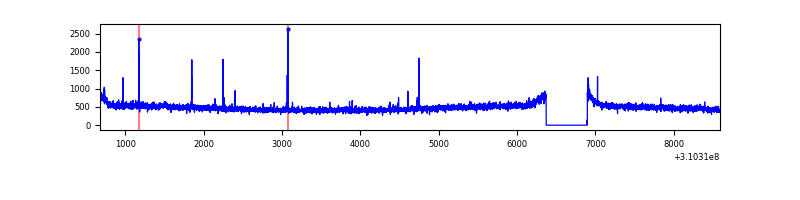 |
| B | 7914 | 7390 | 1 | 1 | 0.01% | 0.01% | 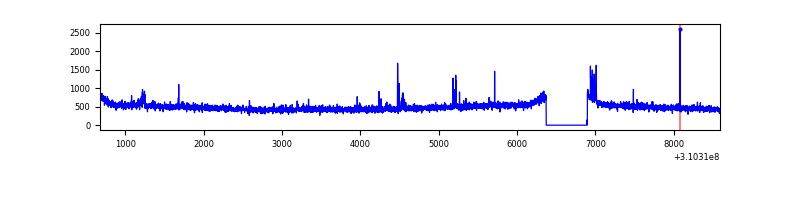 |
| C | 7914 | 7390 | 0 | 0 | 0.00% | 0.00% | 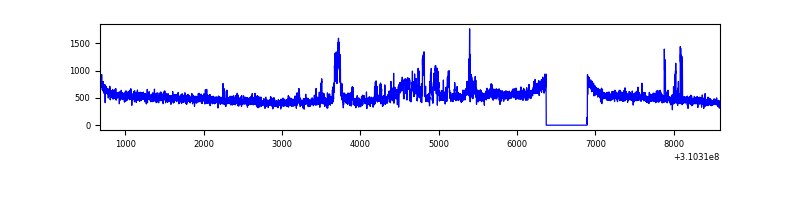 |
| D | 7914 | 7390 | 1017 | 1017 | 12.85% | 13.76% | 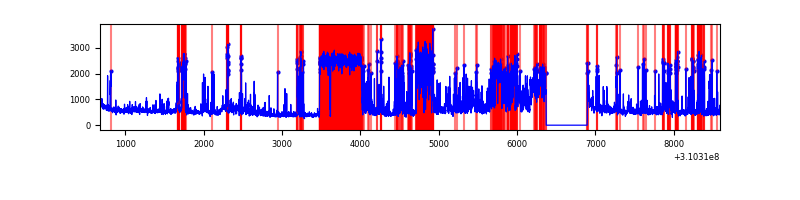 |
Top three noisy pixels from each quadrant. If the there are fewer than three noisy pixels in the level2.evt file, extra rows are filled as -1
| Pixel properties | Quadrant properties | ||||||
|---|---|---|---|---|---|---|---|
| Quadrant | DetID | PixID | Counts | Sigma | Mean | Median | Sigma |
| A | 5 | 16 | 48434 | 257.67 | 915 | 896 | 184.5 |
| A | 13 | 254 | 13361 | 67.56 | 915 | 896 | 184.5 |
| A | 0 | 226 | 7849 | 37.69 | 915 | 896 | 184.5 |
| B | 4 | 216 | 38165 | 214.94 | 910 | 886 | 173.4 |
| B | 4 | 173 | 26092 | 145.33 | 910 | 886 | 173.4 |
| B | 12 | 111 | 21172 | 116.96 | 910 | 886 | 173.4 |
| C | 9 | 54 | 402468 | 1986.02 | 869 | 874 | 202.2 |
| C | 14 | 238 | 136474 | 670.59 | 869 | 874 | 202.2 |
| C | 13 | 61 | 6024 | 25.47 | 869 | 874 | 202.2 |
| D | 1 | 52 | 2710082 | 13633.94 | 817 | 792 | 198.7 |
| D | 2 | 133 | 865829 | 4353.12 | 817 | 792 | 198.7 |
| D | 11 | 176 | 133352 | 667.08 | 817 | 792 | 198.7 |
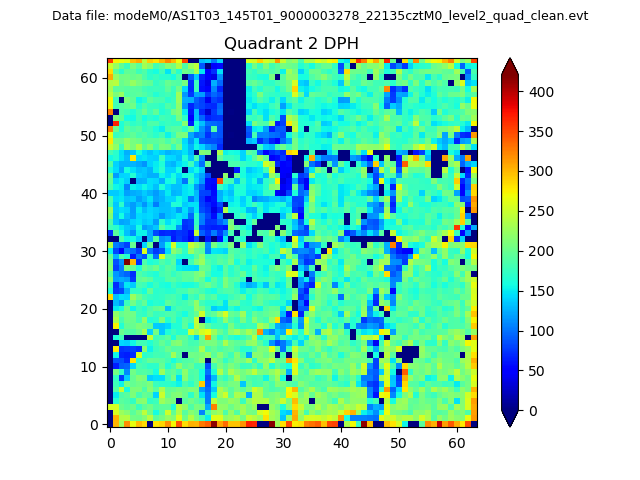
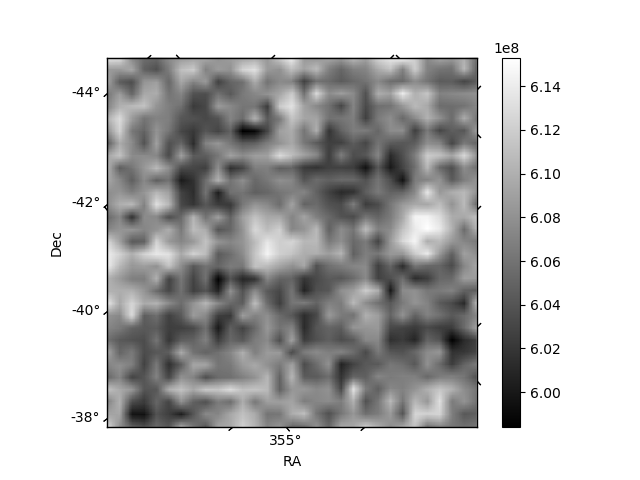
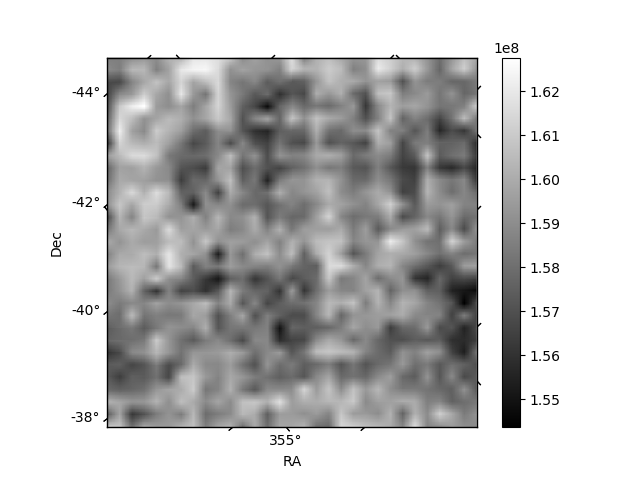
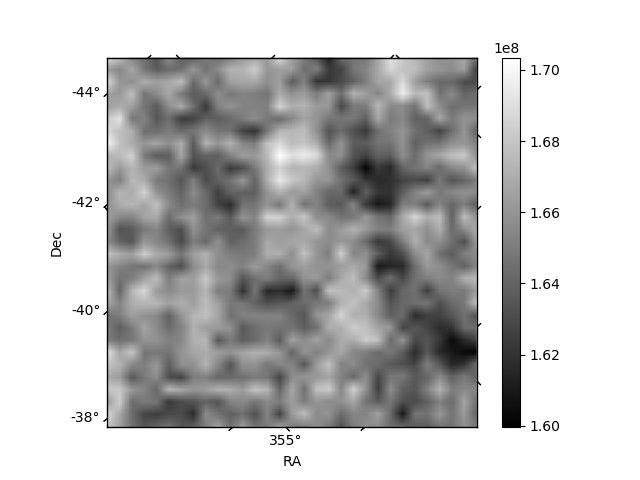
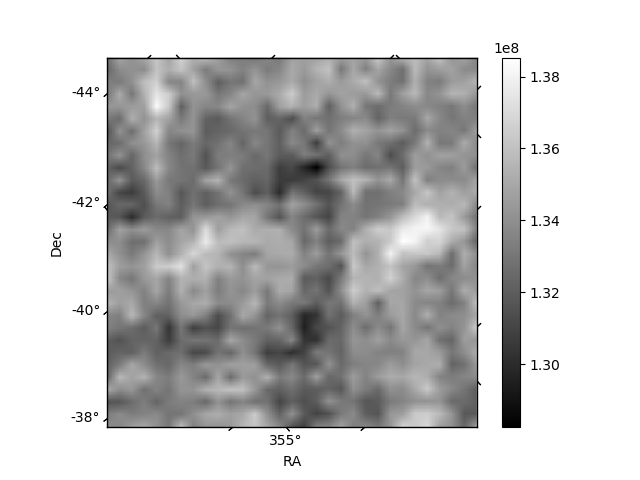
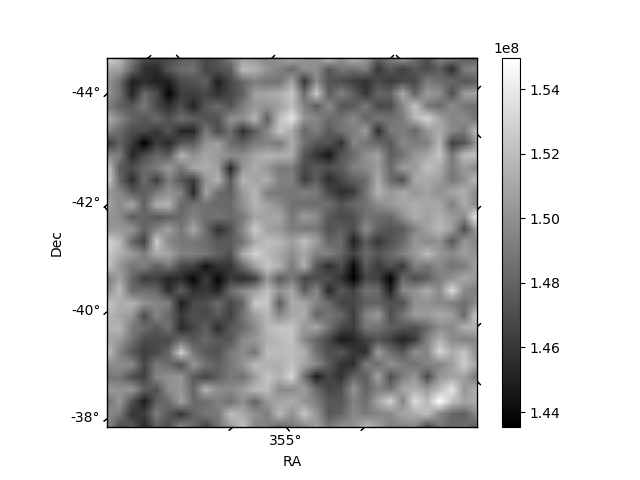
Histogram calculated using DETX and DETY for each event in the final _common_clean file
| Quadrant A | 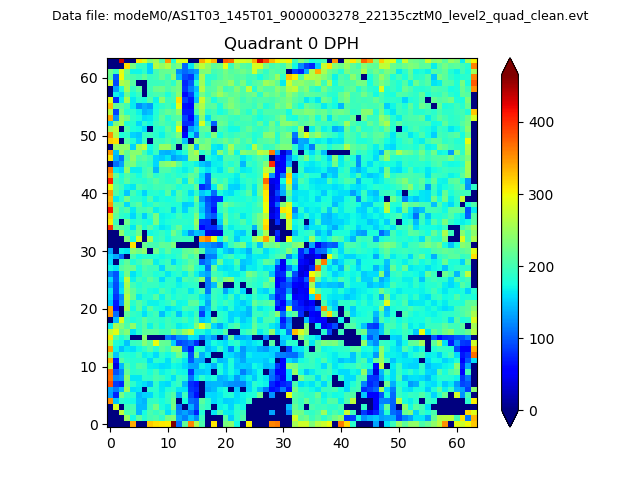 |
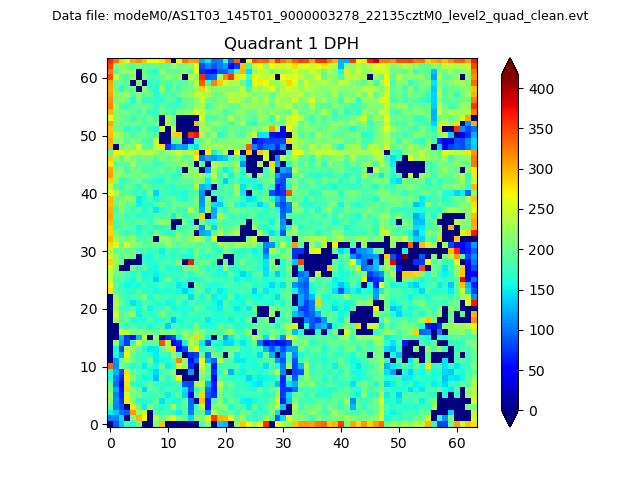 |
Quadrant B |
|---|---|---|---|
| Quadrant D | 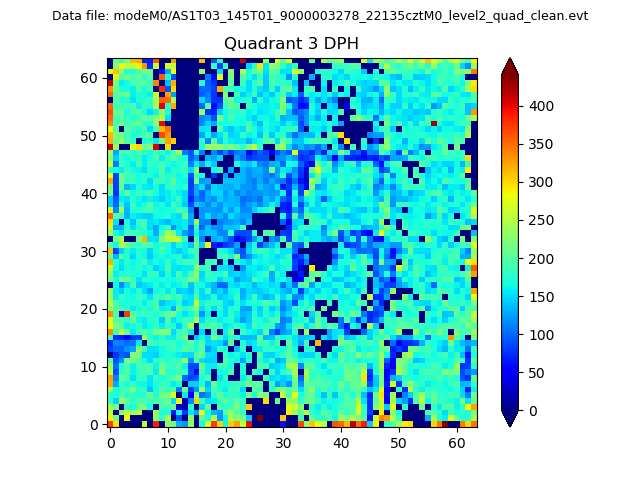 |
 |
Quadrant C |
| Plot type | Count rate plots | Images |
|---|---|---|
| Comparison with Poisson distribution Blue bars denote a histogram of data divided into 1 sec bins. Red curve is a Poisson curve with rate = median count rate of data. |
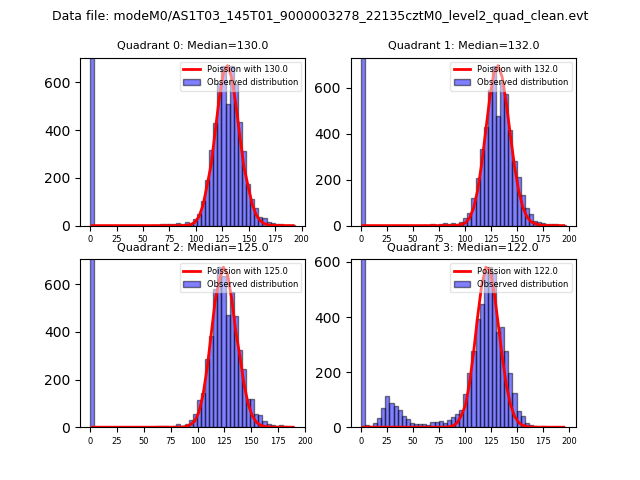 |
 |
| Quadrant-wise count rates Data is divided into 100 sec bins |
 |
|
| Module-wise count rates for Quadrant A Data is divided into 100 sec bins |
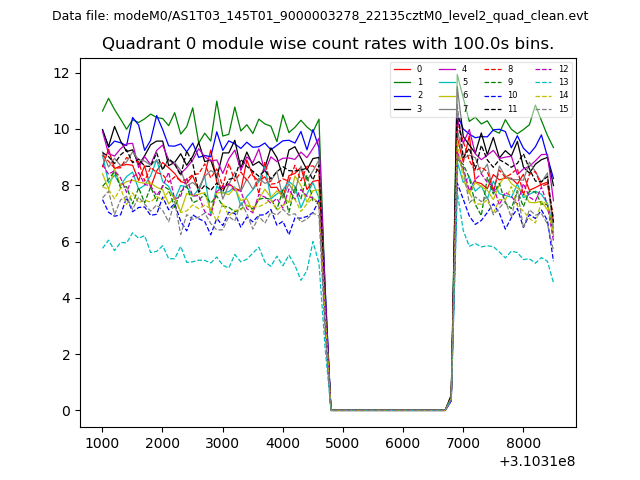 |
 |
| Module-wise count rates for Quadrant B Data is divided into 100 sec bins |
 |
 |
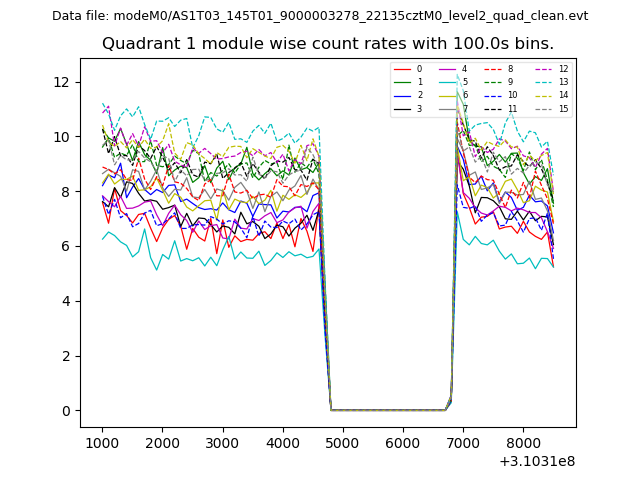
| Module-wise count rates for Quadrant C Data is divided into 100 sec bins |
 |
 |
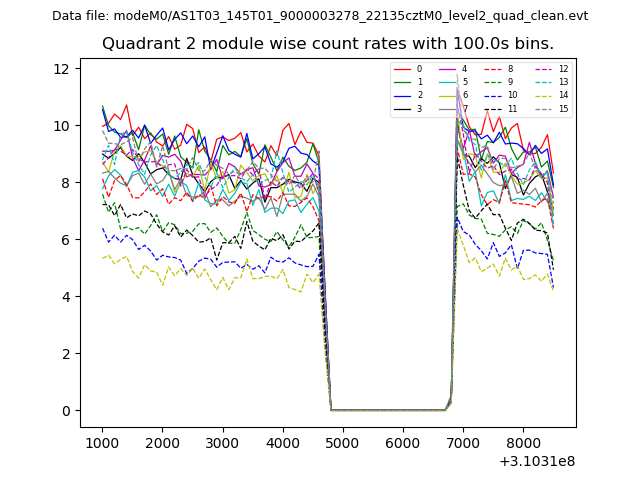
| Module-wise count rates for Quadrant D Data is divided into 100 sec bins |
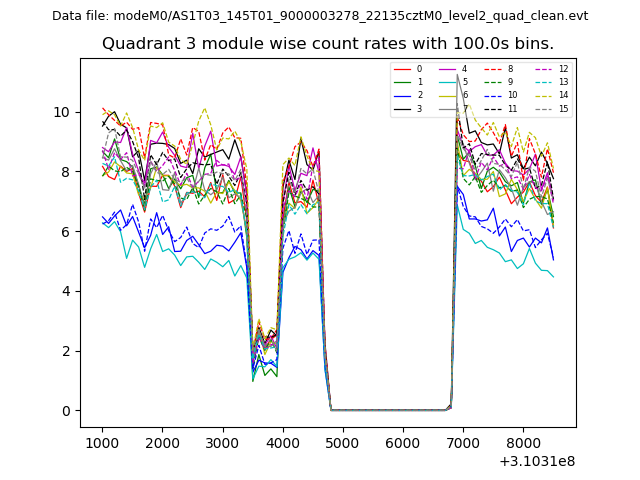 |
 |
| Parameter | Plot |
|---|---|
| CZT HV Monitor | 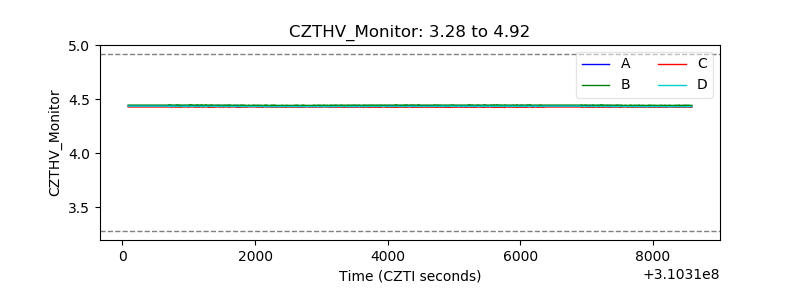 |
| D_VDD | 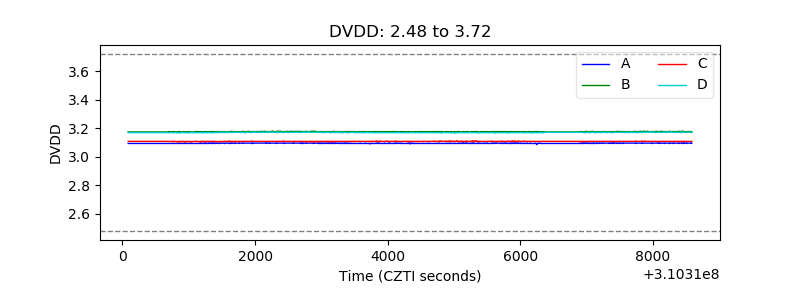 |
| Temperature 1 | 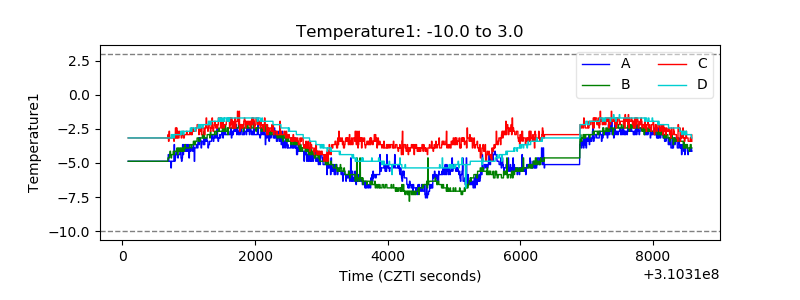 |
| Veto HV Monitor | 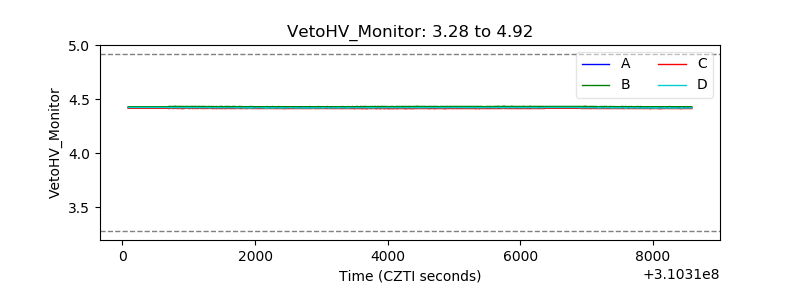 |
| Veto LLD | 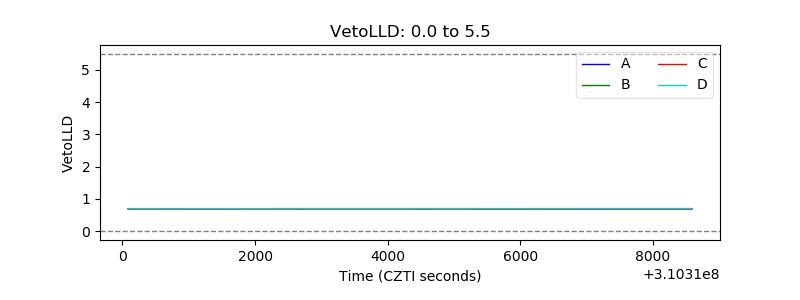 |
| Alpha Counter | 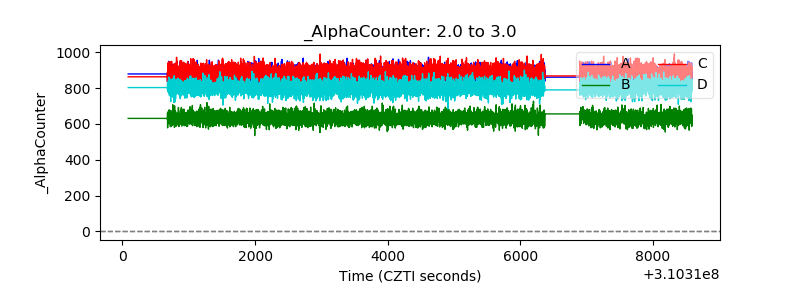 |
| _CPM_Rate |  |
| CZT Counter | 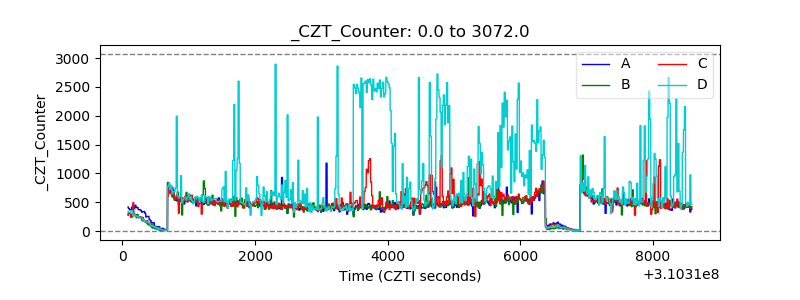 |
| +2.5 Volts monitor |  |
| +5 Volts monitor | 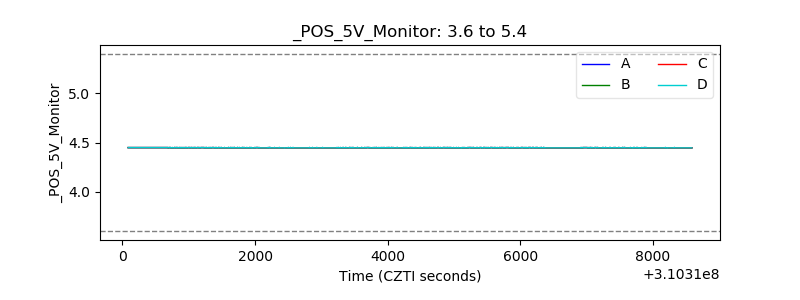 |
| _ROLL_ROT | 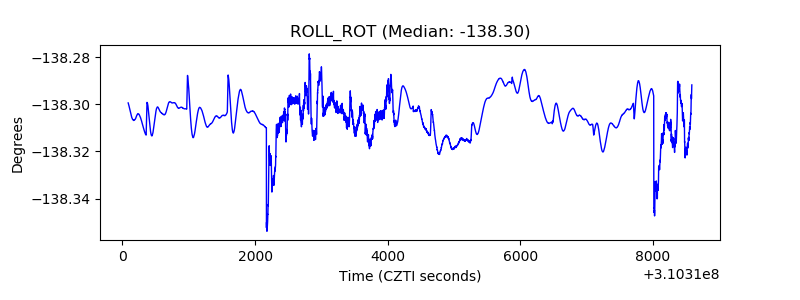 |
| _Roll_DEC | 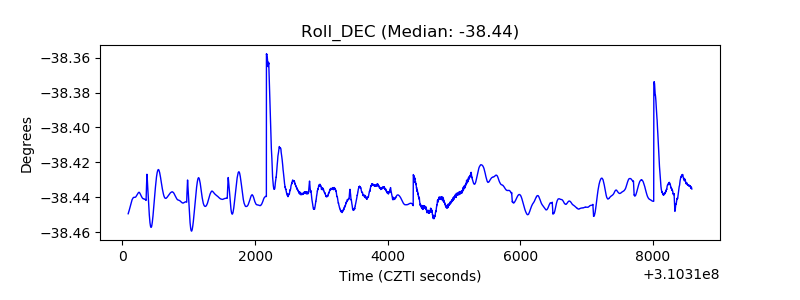 |
| _Roll_RA | 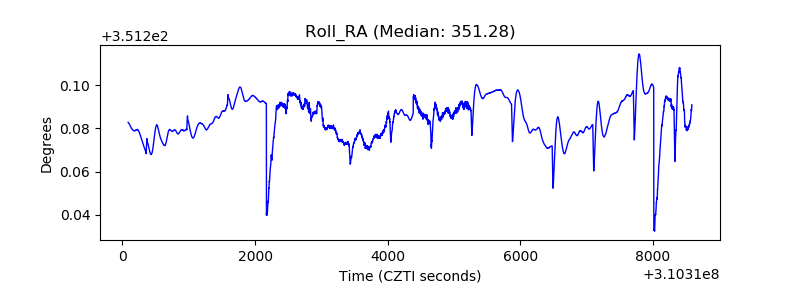 |
| Veto Counter | 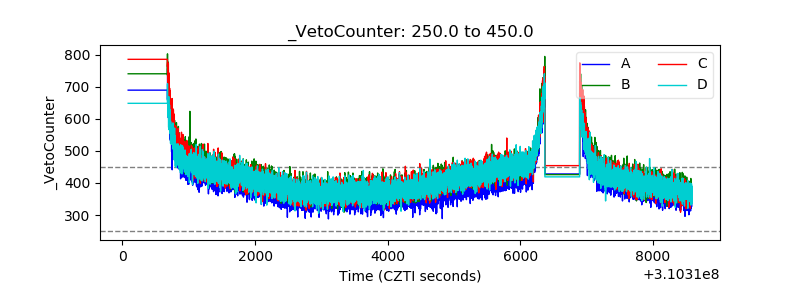 |