| Param | Original file | Final file |
|---|---|---|
| Filename | modeM0/AS1T03_145T01_9000003278_22137cztM0_level2.evt | modeM0/AS1T03_145T01_9000003278_22137cztM0_level2_quad_clean.evt |
| Size (bytes) | 543,461,760 | 105,284,160 |
| Size | 518.3 MB | 100.4 MB |
| Events in quadrant A | 3,530,849 | 685,980 |
| Events in quadrant B | 3,752,546 | 688,630 |
| Events in quadrant C | 3,609,347 | 657,560 |
| Events in quadrant D | 5,056,346 | 633,679 |
| Mode M0 | |||
|---|---|---|---|
| Quadrant | BADHDUFLAG | Total packets | Discarded packets |
| A | 0 | 15522 | 2 |
| B | 0 | 16060 | 2 |
| C | 0 | 15697 | 2 |
| D | 0 | 20140 | 2 |
| Mode SS | |||
|---|---|---|---|
| Quadrant | BADHDUFLAG | Total packets | Discarded packets |
| A | 0 | 154 | 0 |
| B | 0 | 154 | 0 |
| C | 0 | 152 | 0 |
| D | 0 | 152 | 0 |
| Mode M9 | |||
|---|---|---|---|
| Quadrant | BADHDUFLAG | Total packets | Discarded packets |
| A | 0 | 3 | 0 |
| B | 0 | 3 | 0 |
| C | 0 | 3 | 0 |
| D | 0 | 3 | 0 |
| Quadrant | Total seconds | Saturated seconds | Saturation percentage |
|---|---|---|---|
| A | 7506 | 74 | 0.985878% |
| B | 7507 | 134 | 1.785001% |
| C | 7506 | 102 | 1.358913% |
| D | 7506 | 343 | 4.569678% |
Noise dominated data is calculated using 1-second bins in cleaned event files. If a bin has >2000 counts, and if more than 50% of those come from <1% of pixels, then it is considered to be noise-dominated and hence unusable.
| Quadrant | # 1 sec bins | Bins with >0 counts | Bins with >2000 counts | High rate bins dominated by noise | Noise dominated (total time) | Noise dominated (detector-on time) | Marked lightcurve |
|---|---|---|---|---|---|---|---|
| A | 7831 | 7507 | 0 | 0 | 0.00% | 0.00% | 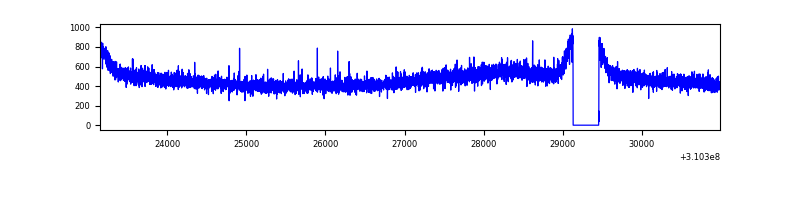 |
| B | 7832 | 7508 | 29 | 29 | 0.37% | 0.39% | 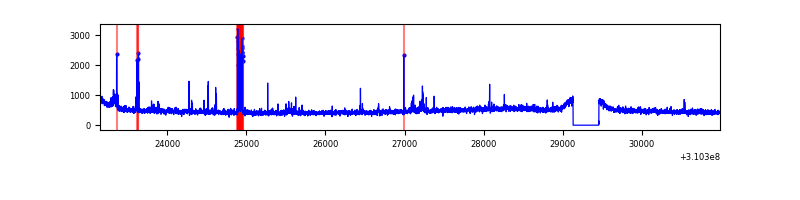 |
| C | 7831 | 7507 | 7 | 7 | 0.09% | 0.09% | 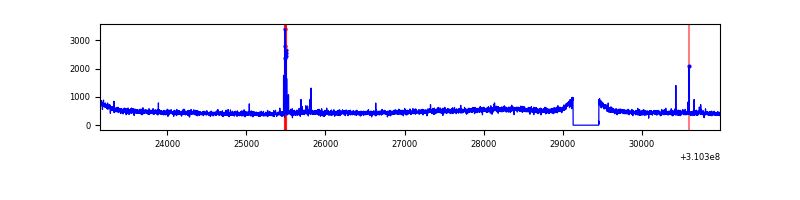 |
| D | 7831 | 7507 | 308 | 308 | 3.93% | 4.10% | 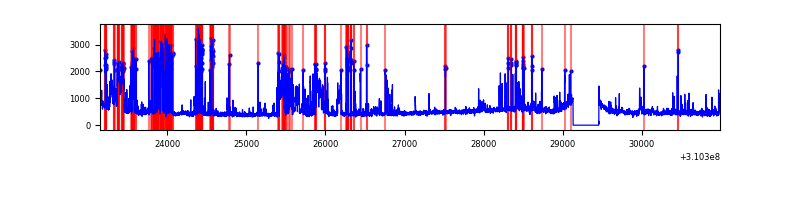 |
Top three noisy pixels from each quadrant. If the there are fewer than three noisy pixels in the level2.evt file, extra rows are filled as -1
| Pixel properties | Quadrant properties | ||||||
|---|---|---|---|---|---|---|---|
| Quadrant | DetID | PixID | Counts | Sigma | Mean | Median | Sigma |
| A | 13 | 254 | 13936 | 70.67 | 915 | 894 | 184.6 |
| A | 3 | 137 | 8249 | 39.85 | 915 | 894 | 184.6 |
| A | 0 | 226 | 7918 | 38.06 | 915 | 894 | 184.6 |
| B | 3 | 64 | 98984 | 564.39 | 906 | 880 | 173.8 |
| B | 10 | 246 | 57769 | 327.28 | 906 | 880 | 173.8 |
| B | 12 | 111 | 21438 | 118.27 | 906 | 880 | 173.8 |
| C | 14 | 238 | 136259 | 664.73 | 866 | 870 | 203.7 |
| C | 10 | 22 | 58887 | 284.85 | 866 | 870 | 203.7 |
| C | 10 | 91 | 30894 | 147.41 | 866 | 870 | 203.7 |
| D | 1 | 52 | 1705694 | 8106.01 | 867 | 840 | 210.3 |
| D | 2 | 234 | 33342 | 154.54 | 867 | 840 | 210.3 |
| D | 2 | 133 | 21672 | 99.05 | 867 | 840 | 210.3 |
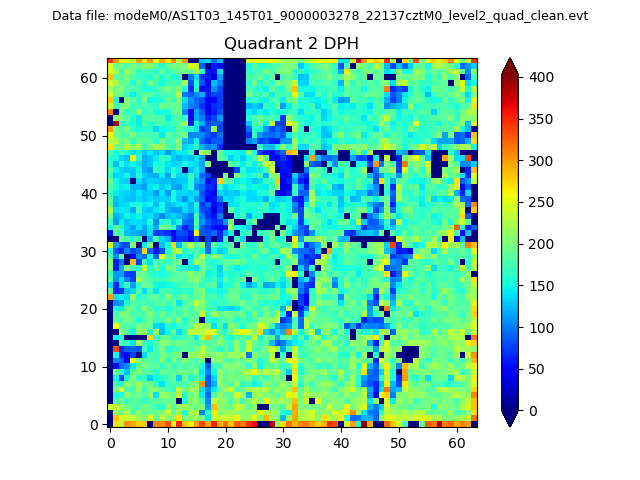
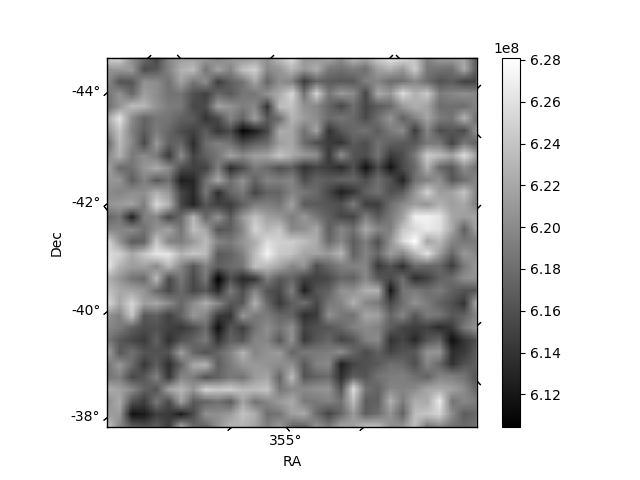
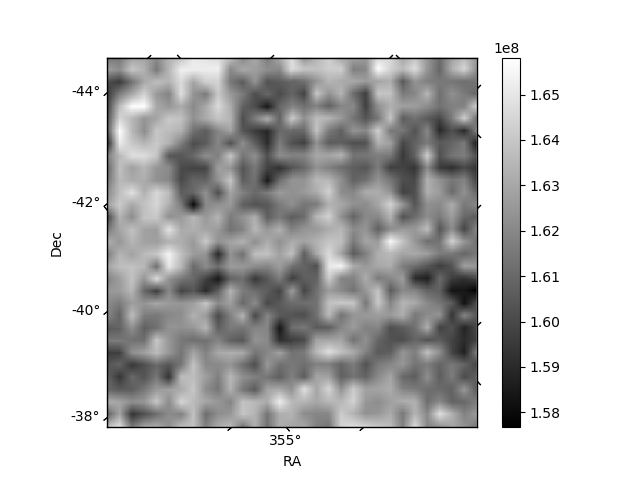
Histogram calculated using DETX and DETY for each event in the final _common_clean file
| Quadrant A | 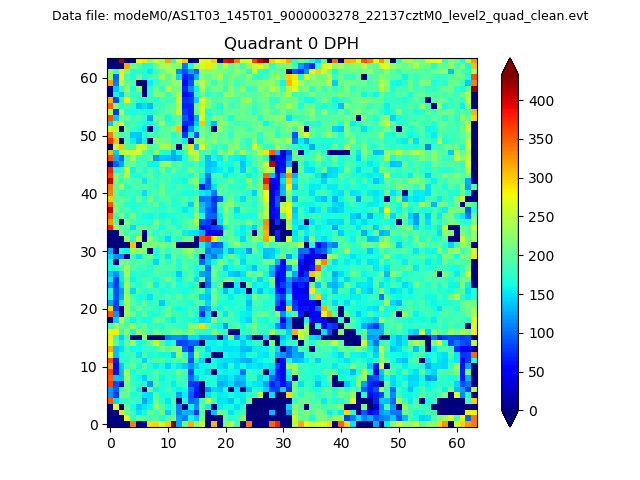 |
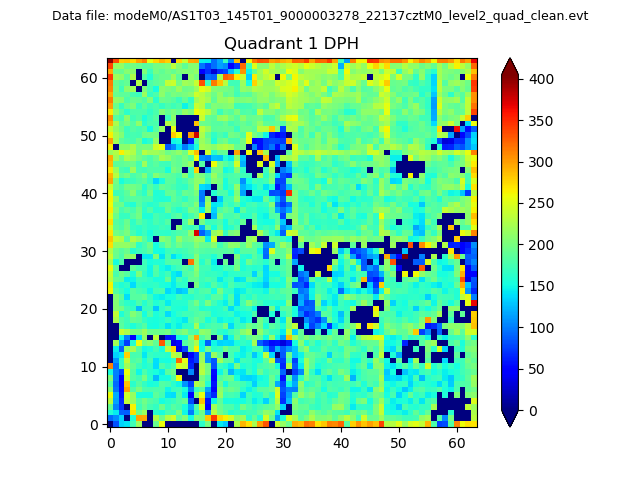 |
Quadrant B |
|---|---|---|---|
| Quadrant D | 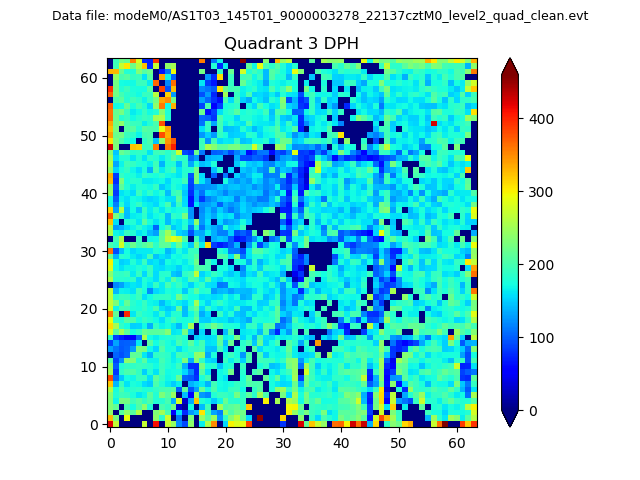 |
 |
Quadrant C |
| Plot type | Count rate plots | Images |
|---|---|---|
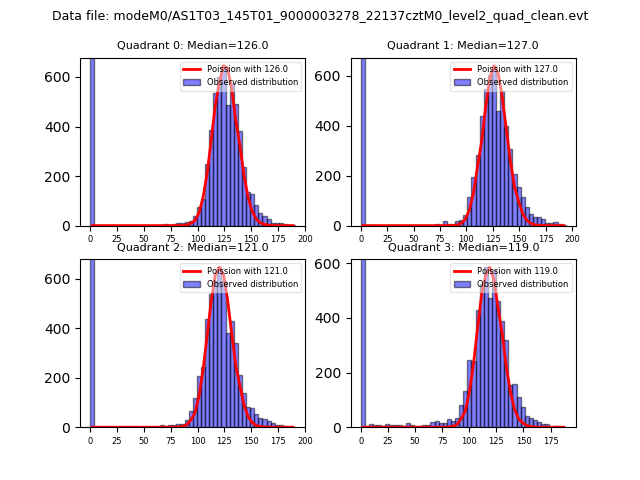
| Comparison with Poisson distribution Blue bars denote a histogram of data divided into 1 sec bins. Red curve is a Poisson curve with rate = median count rate of data. |
 |
 |
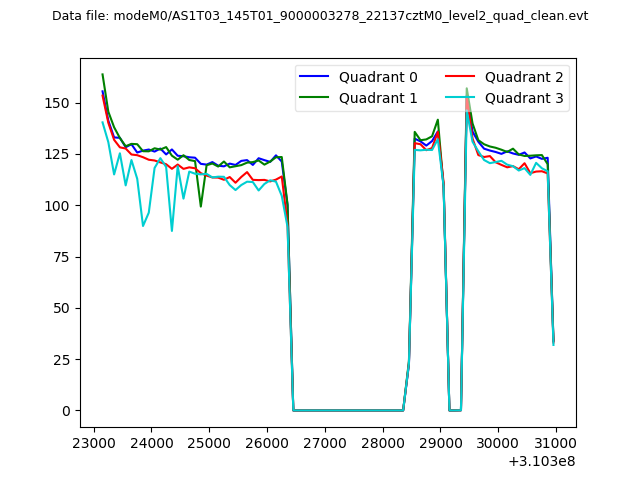
| Quadrant-wise count rates Data is divided into 100 sec bins |
 |
|
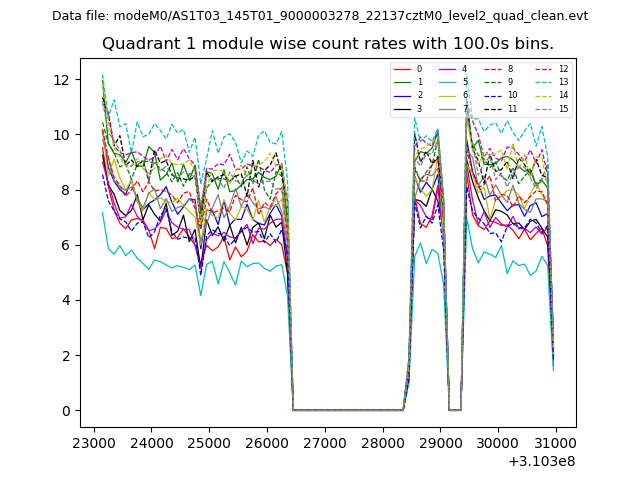
| Module-wise count rates for Quadrant A Data is divided into 100 sec bins |
 |
 |
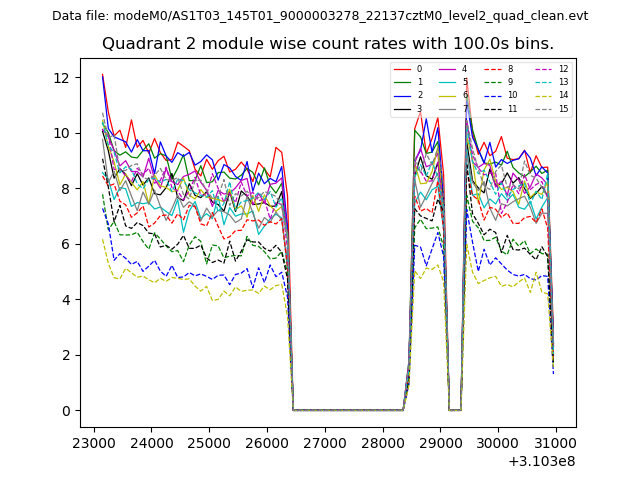
| Module-wise count rates for Quadrant B Data is divided into 100 sec bins |
 |
 |
| Module-wise count rates for Quadrant C Data is divided into 100 sec bins |
 |
 |
| Module-wise count rates for Quadrant D Data is divided into 100 sec bins |
 |
 |
| Parameter | Plot |
|---|---|
| CZT HV Monitor | 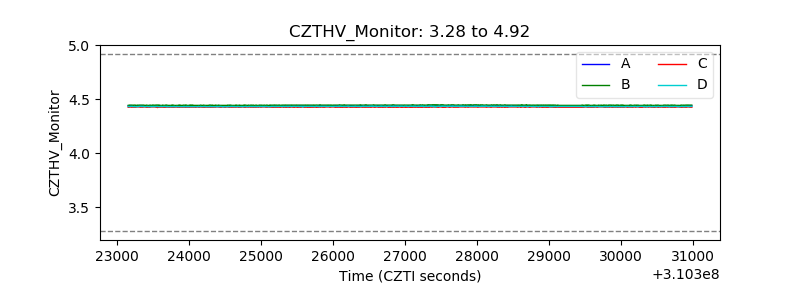 |
| D_VDD | 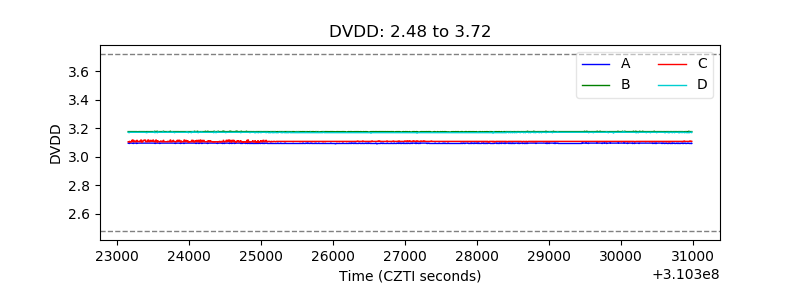 |
| Temperature 1 | 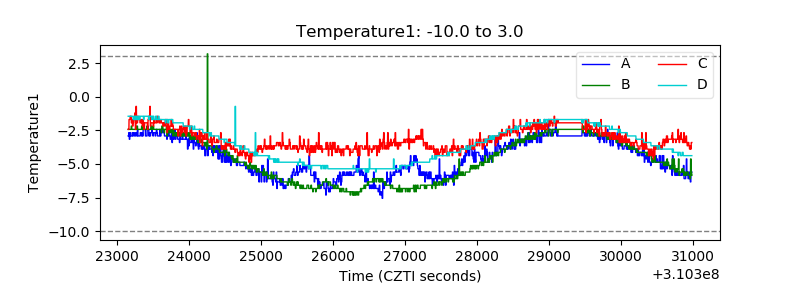 |
| Veto HV Monitor | 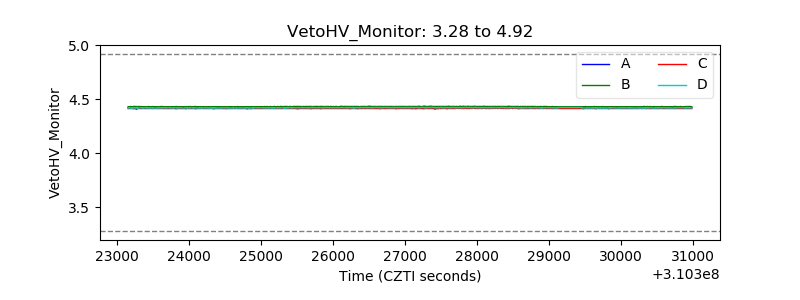 |
| Veto LLD | 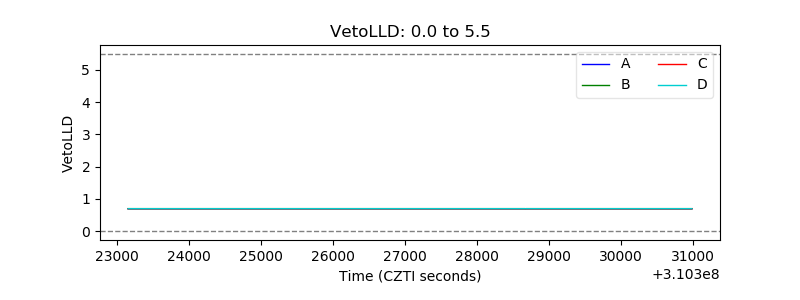 |
| Alpha Counter | 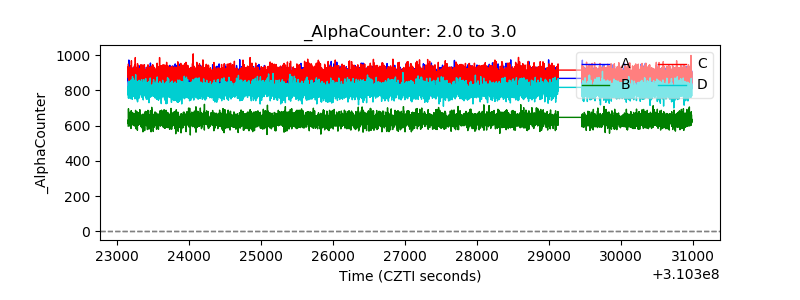 |
| _CPM_Rate | 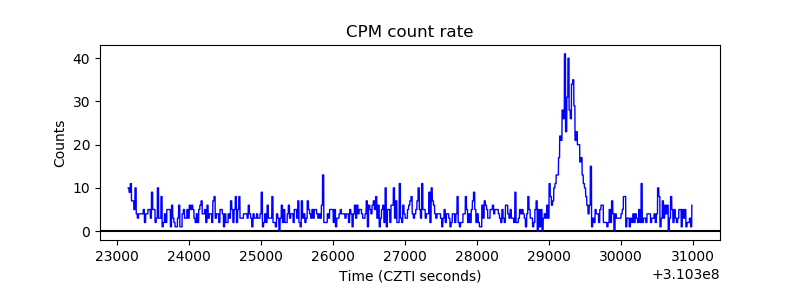 |
| CZT Counter | 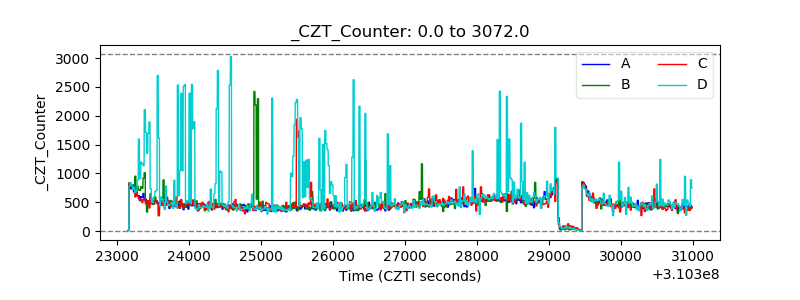 |
| +2.5 Volts monitor |  |
| +5 Volts monitor | 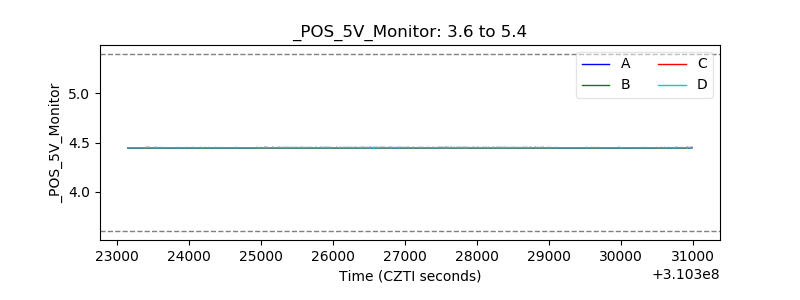 |
| _ROLL_ROT |  |
| _Roll_DEC | 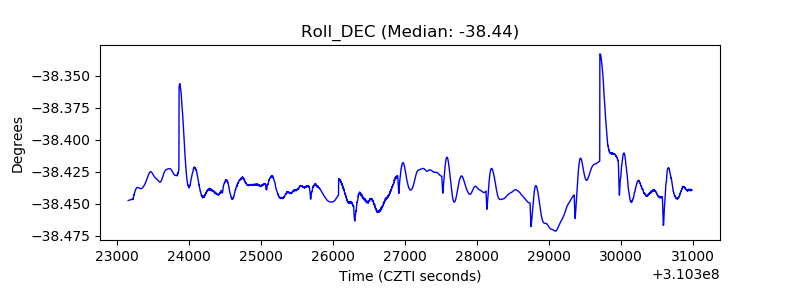 |
| _Roll_RA | 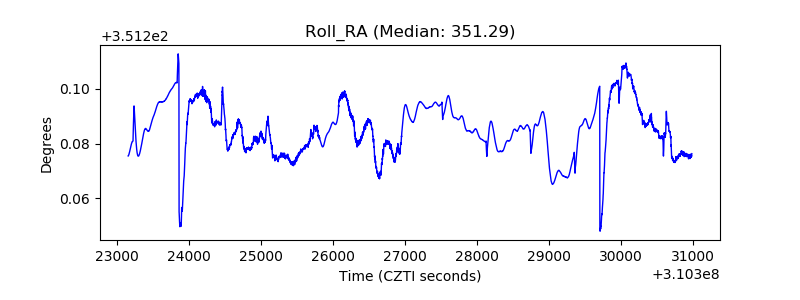 |
| Veto Counter | 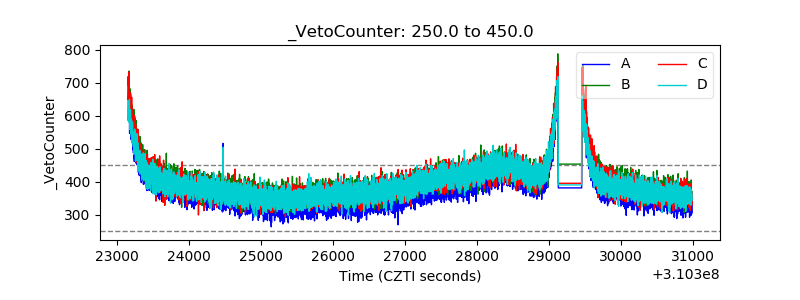 |