| Param | Original file | Final file |
|---|---|---|
| Filename | modeM0/AS1T03_145T01_9000003278_22140cztM0_level2.evt | modeM0/AS1T03_145T01_9000003278_22140cztM0_level2_quad_clean.evt |
| Size (bytes) | 1,217,707,200 | 239,106,240 |
| Size | 1.1 GB | 228.0 MB |
| Events in quadrant A | 8,453,803 | 1,525,249 |
| Events in quadrant B | 8,658,204 | 1,543,023 |
| Events in quadrant C | 8,669,010 | 1,464,660 |
| Events in quadrant D | 9,854,835 | 1,443,262 |
| Mode M0 | |||
|---|---|---|---|
| Quadrant | BADHDUFLAG | Total packets | Discarded packets |
| A | 0 | 37442 | 4 |
| B | 0 | 37602 | 4 |
| C | 0 | 37894 | 4 |
| D | 0 | 41921 | 4 |
| Mode SS | |||
|---|---|---|---|
| Quadrant | BADHDUFLAG | Total packets | Discarded packets |
| A | 0 | 374 | 0 |
| B | 0 | 374 | 0 |
| C | 0 | 372 | 0 |
| D | 0 | 372 | 0 |
| Mode M9 | |||
|---|---|---|---|
| Quadrant | BADHDUFLAG | Total packets | Discarded packets |
| A | 0 | 21 | 0 |
| B | 0 | 21 | 0 |
| C | 0 | 21 | 0 |
| D | 0 | 21 | 0 |
| Quadrant | Total seconds | Saturated seconds | Saturation percentage |
|---|---|---|---|
| A | 18370 | 75 | 0.408274% |
| B | 18371 | 110 | 0.598770% |
| C | 18370 | 157 | 0.854654% |
| D | 18370 | 237 | 1.290147% |
Noise dominated data is calculated using 1-second bins in cleaned event files. If a bin has >2000 counts, and if more than 50% of those come from <1% of pixels, then it is considered to be noise-dominated and hence unusable.
| Quadrant | # 1 sec bins | Bins with >0 counts | Bins with >2000 counts | High rate bins dominated by noise | Noise dominated (total time) | Noise dominated (detector-on time) | Marked lightcurve |
|---|---|---|---|---|---|---|---|
| A | 20430 | 18373 | 3 | 3 | 0.01% | 0.02% | 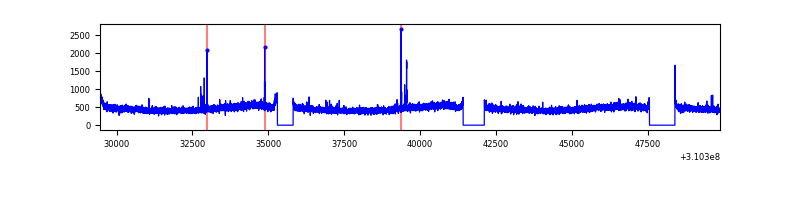 |
| B | 20431 | 18374 | 5 | 5 | 0.02% | 0.03% | 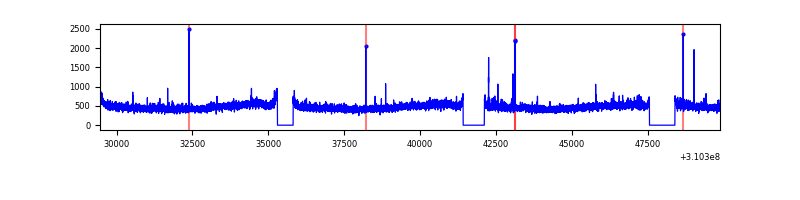 |
| C | 20430 | 18373 | 17 | 17 | 0.08% | 0.09% | 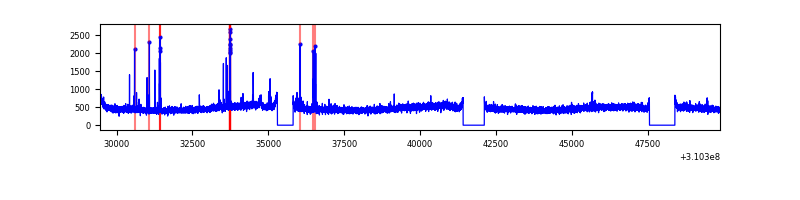 |
| D | 20430 | 18373 | 142 | 142 | 0.70% | 0.77% | 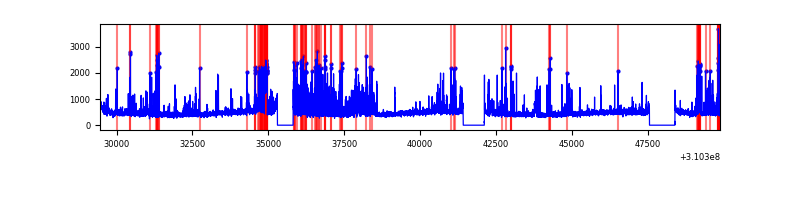 |
Top three noisy pixels from each quadrant. If the there are fewer than three noisy pixels in the level2.evt file, extra rows are filled as -1
| Pixel properties | Quadrant properties | ||||||
|---|---|---|---|---|---|---|---|
| Quadrant | DetID | PixID | Counts | Sigma | Mean | Median | Sigma |
| A | 5 | 16 | 47185 | 102.77 | 2180 | 2137 | 438.3 |
| A | 13 | 254 | 33941 | 72.56 | 2180 | 2137 | 438.3 |
| A | 3 | 137 | 19210 | 38.95 | 2180 | 2137 | 438.3 |
| B | 12 | 111 | 51763 | 120.05 | 2175 | 2117 | 413.6 |
| B | 11 | 111 | 46118 | 106.4 | 2175 | 2117 | 413.6 |
| B | 14 | 111 | 40912 | 93.81 | 2175 | 2117 | 413.6 |
| C | 14 | 238 | 330390 | 674.44 | 2087 | 2099 | 486.8 |
| C | 10 | 22 | 201920 | 410.51 | 2087 | 2099 | 486.8 |
| C | 13 | 61 | 14685 | 25.86 | 2087 | 2099 | 486.8 |
| D | 1 | 52 | 1304240 | 2575.25 | 2103 | 2041 | 505.7 |
| D | 13 | 104 | 425542 | 837.52 | 2103 | 2041 | 505.7 |
| D | 2 | 234 | 79136 | 152.46 | 2103 | 2041 | 505.7 |
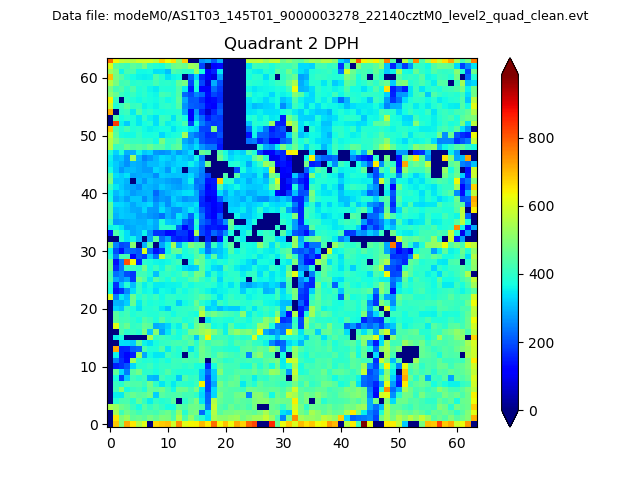
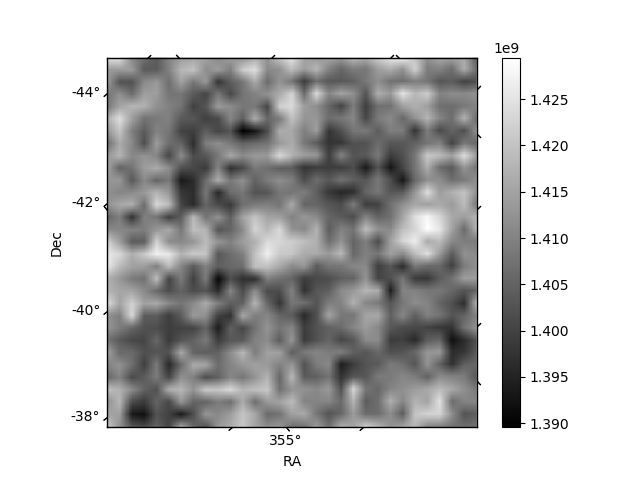
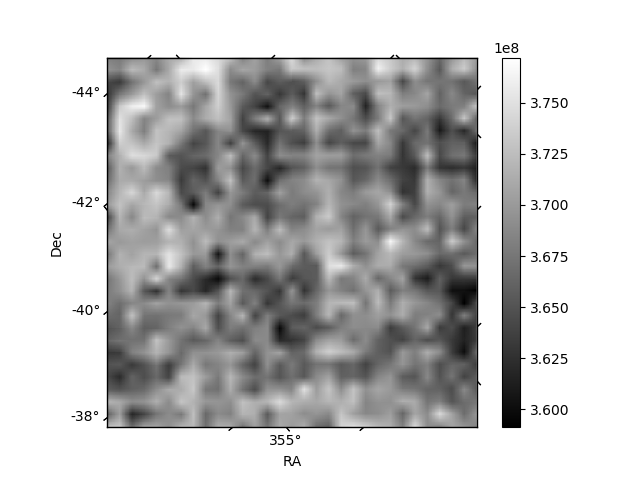
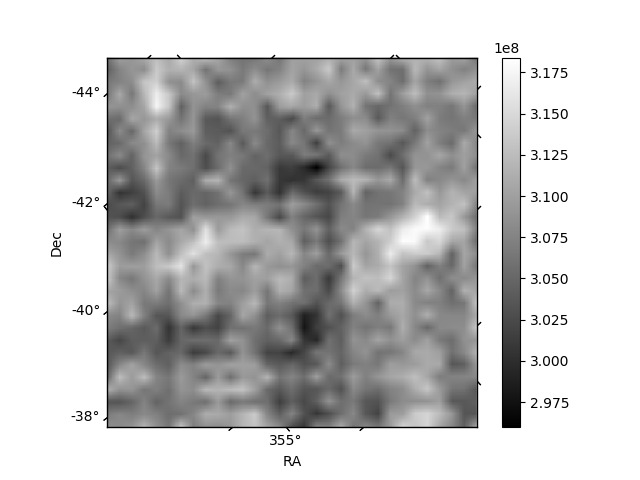
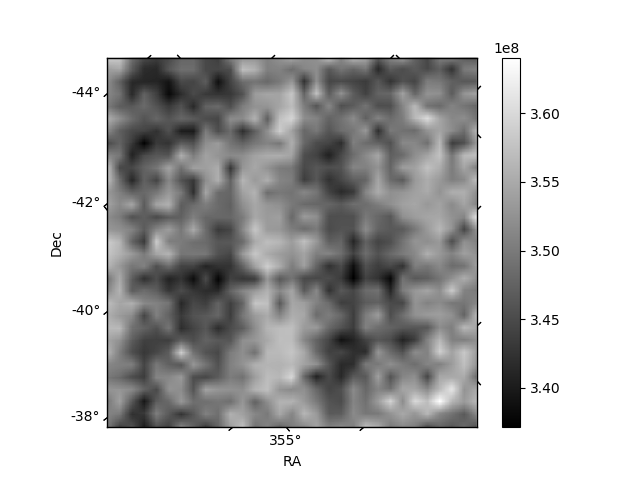
Histogram calculated using DETX and DETY for each event in the final _common_clean file
| Quadrant A | 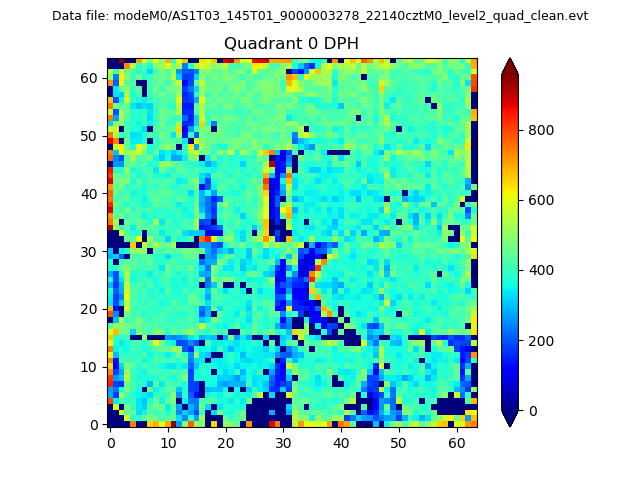 |
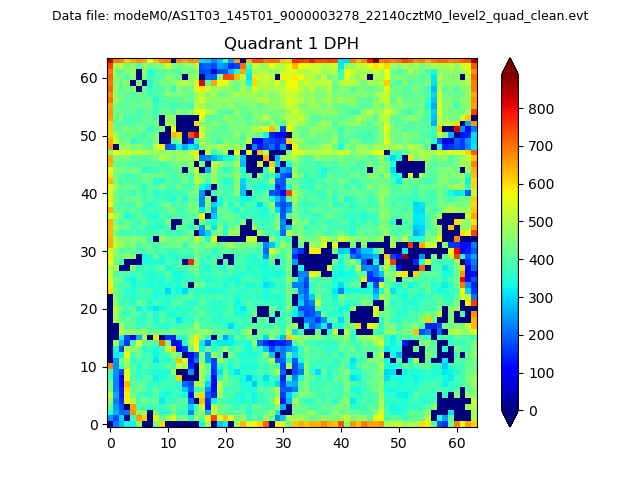 |
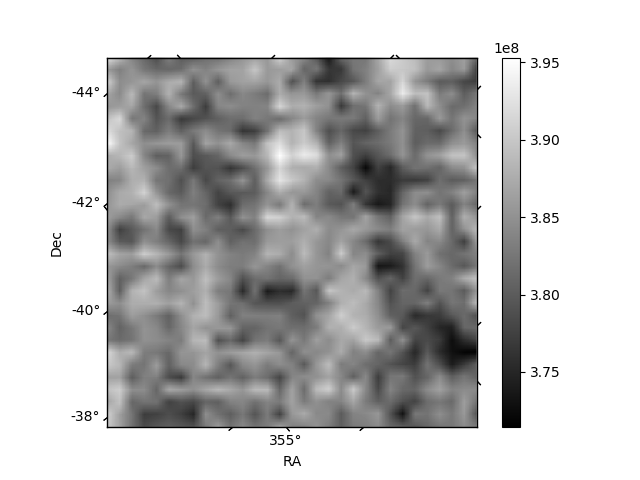
Quadrant B |
|---|---|---|---|
| Quadrant D | 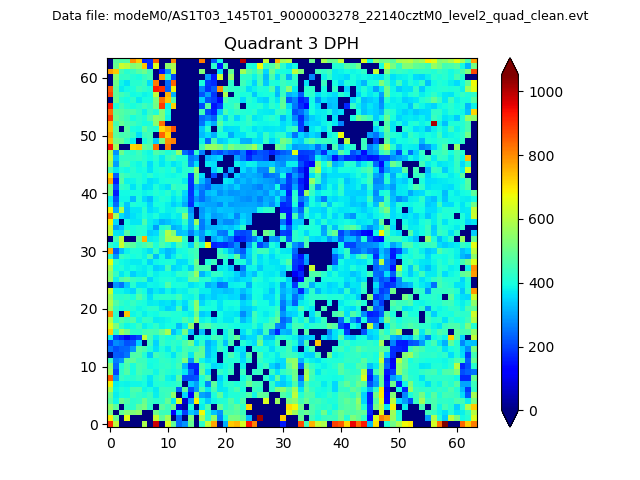 |
 |
Quadrant C |
| Plot type | Count rate plots | Images |
|---|---|---|
| Comparison with Poisson distribution Blue bars denote a histogram of data divided into 1 sec bins. Red curve is a Poisson curve with rate = median count rate of data. |
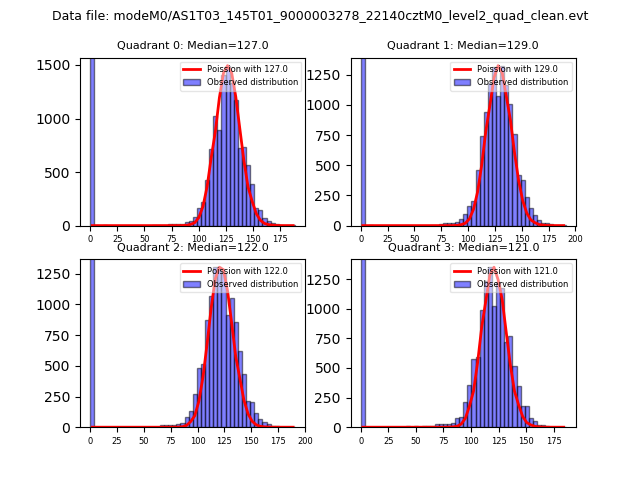 |
 |
| Quadrant-wise count rates Data is divided into 100 sec bins |
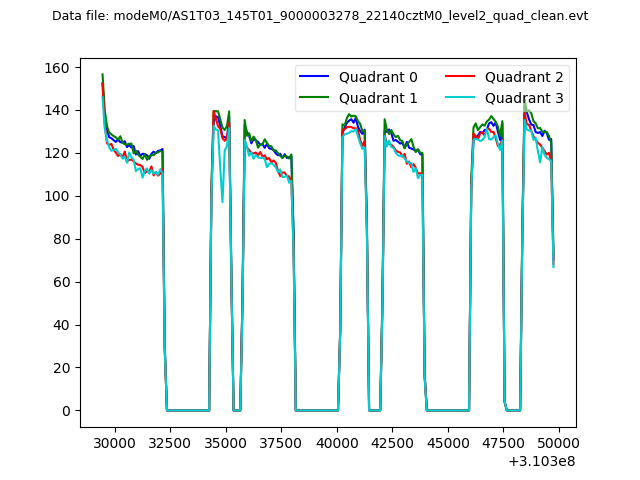 |
|
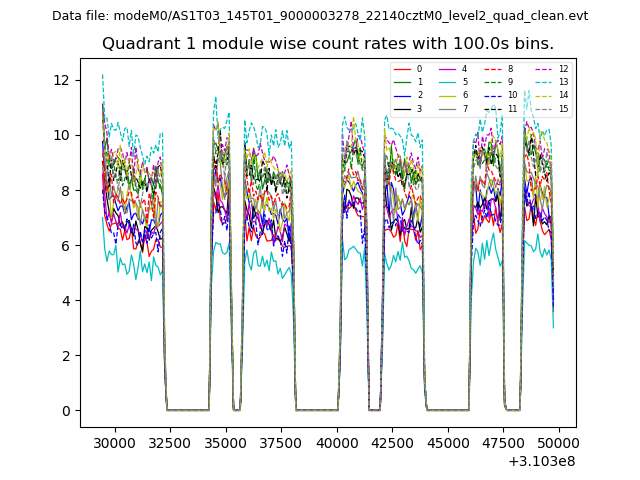
| Module-wise count rates for Quadrant A Data is divided into 100 sec bins |
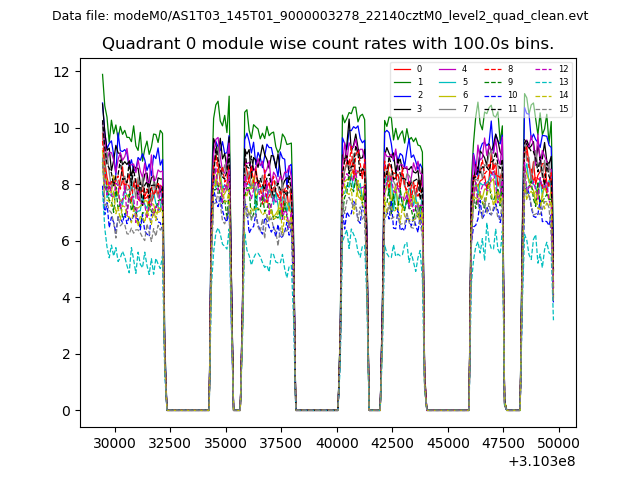 |
 |
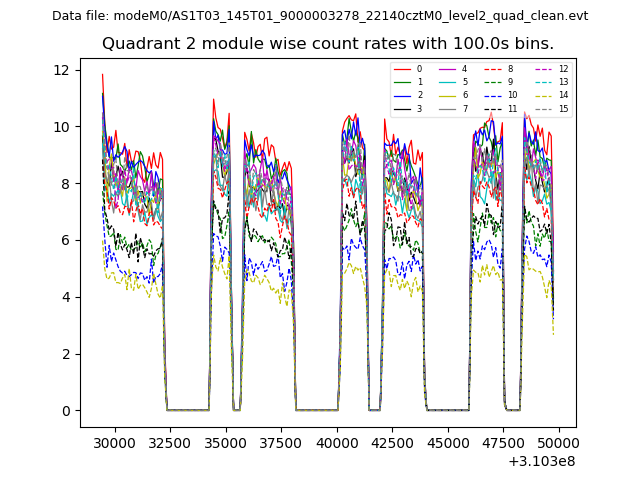
| Module-wise count rates for Quadrant B Data is divided into 100 sec bins |
 |
 |
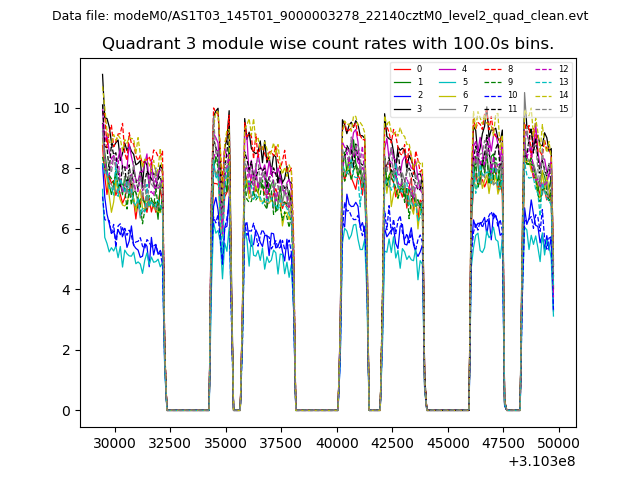
| Module-wise count rates for Quadrant C Data is divided into 100 sec bins |
 |
 |
| Module-wise count rates for Quadrant D Data is divided into 100 sec bins |
 |
 |
| Parameter | Plot |
|---|---|
| CZT HV Monitor | 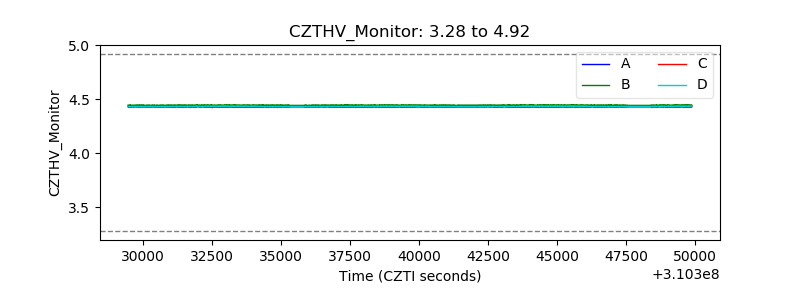 |
| D_VDD | 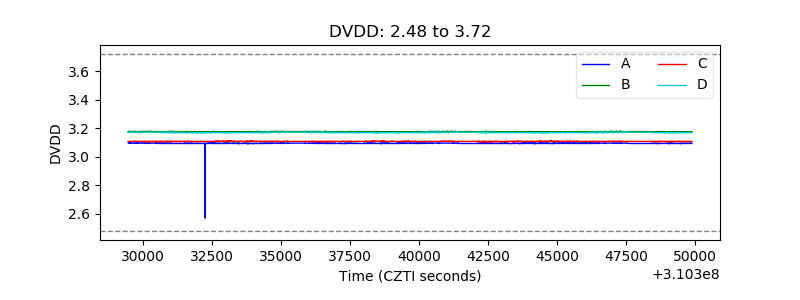 |
| Temperature 1 | 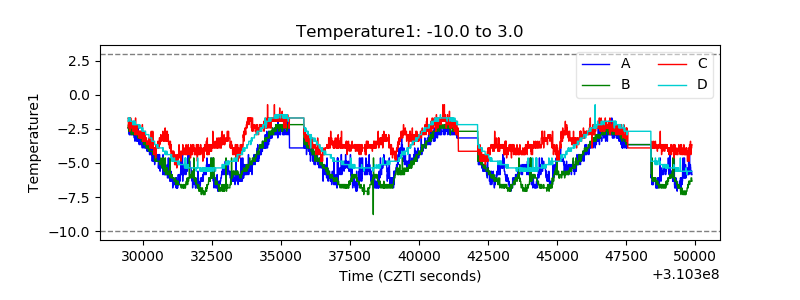 |
| Veto HV Monitor |  |
| Veto LLD | 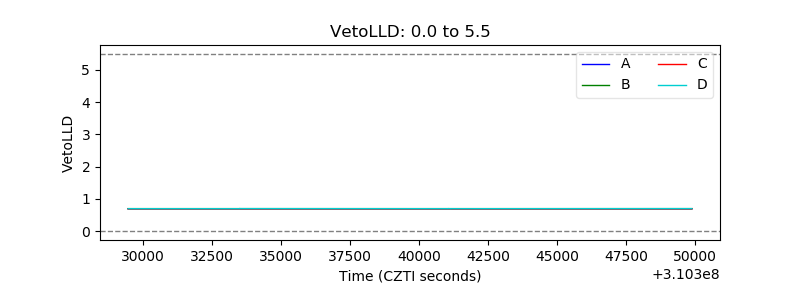 |
| Alpha Counter | 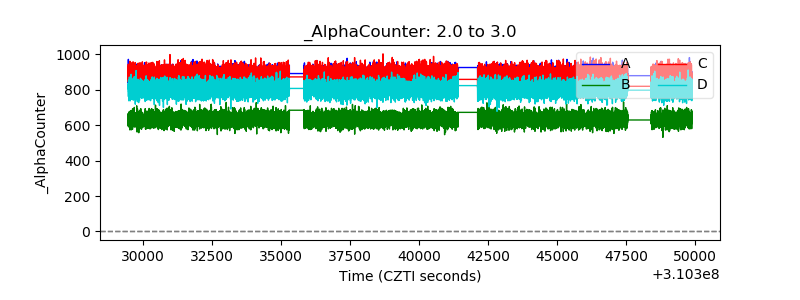 |
| _CPM_Rate | 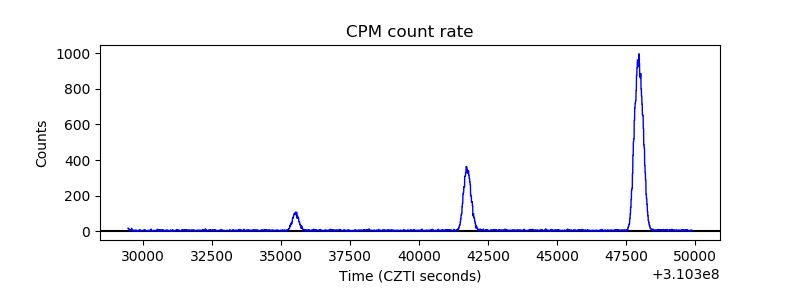 |
| CZT Counter | 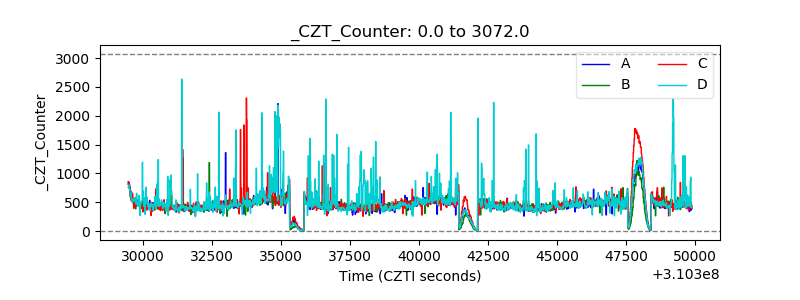 |
| +2.5 Volts monitor |  |
| +5 Volts monitor |  |
| _ROLL_ROT | 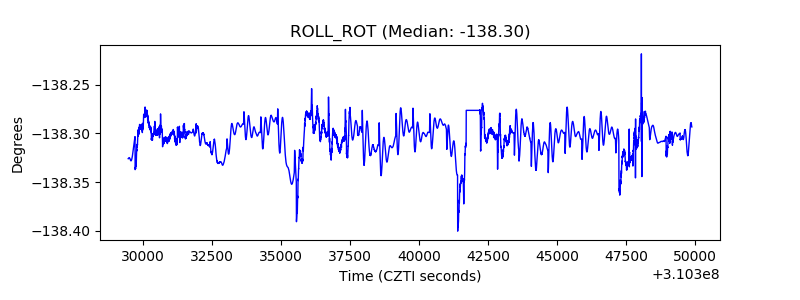 |
| _Roll_DEC | 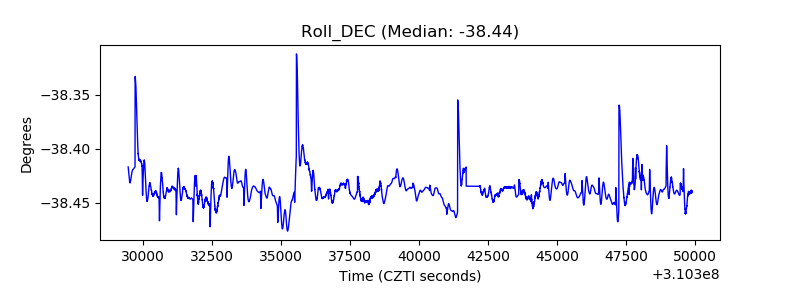 |
| _Roll_RA | 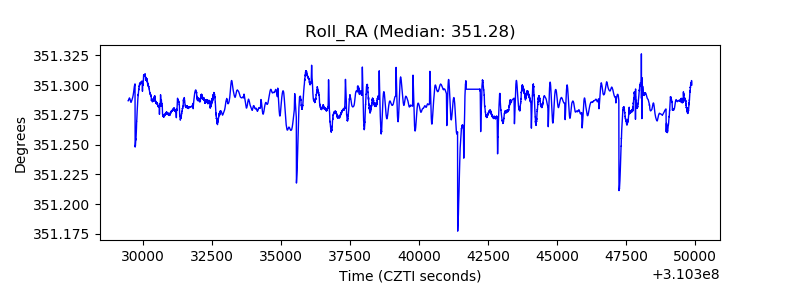 |
| Veto Counter | 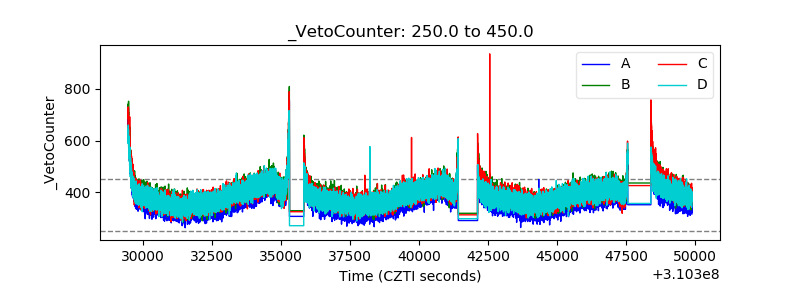 |