| Param | Original file | Final file |
|---|---|---|
| Filename | modeM0/AS1T03_145T01_9000003278_22141cztM0_level2.evt | modeM0/AS1T03_145T01_9000003278_22141cztM0_level2_quad_clean.evt |
| Size (bytes) | 555,952,320 | 87,004,800 |
| Size | 530.2 MB | 83.0 MB |
| Events in quadrant A | 3,076,357 | 562,688 |
| Events in quadrant B | 3,211,054 | 573,997 |
| Events in quadrant C | 3,234,762 | 546,936 |
| Events in quadrant D | 6,867,364 | 490,753 |
| Mode M0 | |||
|---|---|---|---|
| Quadrant | BADHDUFLAG | Total packets | Discarded packets |
| A | 0 | 13419 | 2 |
| B | 0 | 13601 | 2 |
| C | 0 | 13755 | 2 |
| D | 0 | 24907 | 2 |
| Mode SS | |||
|---|---|---|---|
| Quadrant | BADHDUFLAG | Total packets | Discarded packets |
| A | 0 | 134 | 0 |
| B | 0 | 134 | 0 |
| C | 0 | 134 | 0 |
| D | 0 | 134 | 0 |
| Mode M9 | |||
|---|---|---|---|
| Quadrant | BADHDUFLAG | Total packets | Discarded packets |
| A | 0 | 11 | 0 |
| B | 0 | 12 | 0 |
| C | 0 | 12 | 0 |
| D | 0 | 12 | 0 |
| Quadrant | Total seconds | Saturated seconds | Saturation percentage |
|---|---|---|---|
| A | 6597 | 27 | 0.409277% |
| B | 6597 | 45 | 0.682128% |
| C | 6597 | 95 | 1.440049% |
| D | 6597 | 1269 | 19.236016% |
Noise dominated data is calculated using 1-second bins in cleaned event files. If a bin has >2000 counts, and if more than 50% of those come from <1% of pixels, then it is considered to be noise-dominated and hence unusable.
| Quadrant | # 1 sec bins | Bins with >0 counts | Bins with >2000 counts | High rate bins dominated by noise | Noise dominated (total time) | Noise dominated (detector-on time) | Marked lightcurve |
|---|---|---|---|---|---|---|---|
| A | 7567 | 6597 | 0 | 0 | 0.00% | 0.00% | 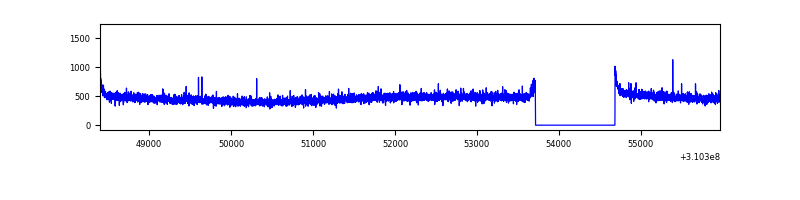 |
| B | 7567 | 6597 | 5 | 5 | 0.07% | 0.08% | 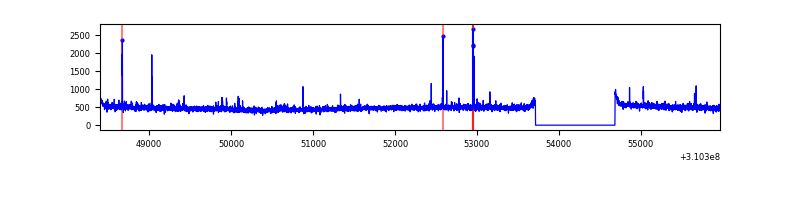 |
| C | 7567 | 6597 | 18 | 18 | 0.24% | 0.27% | 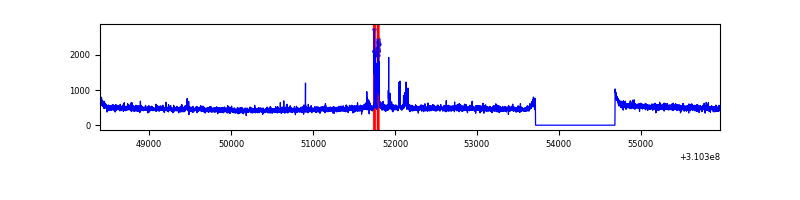 |
| D | 7567 | 6597 | 1261 | 1261 | 16.66% | 19.11% | 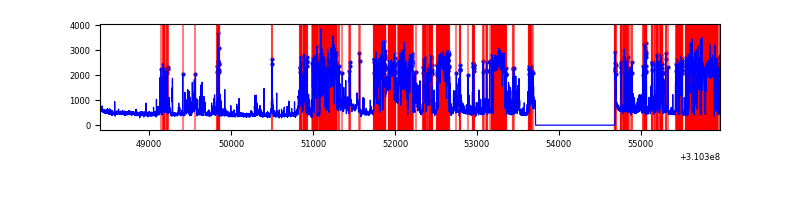 |
Top three noisy pixels from each quadrant. If the there are fewer than three noisy pixels in the level2.evt file, extra rows are filled as -1
| Pixel properties | Quadrant properties | ||||||
|---|---|---|---|---|---|---|---|
| Quadrant | DetID | PixID | Counts | Sigma | Mean | Median | Sigma |
| A | 13 | 254 | 11082 | 64.28 | 796 | 781 | 160.2 |
| A | 0 | 226 | 6885 | 38.09 | 796 | 781 | 160.2 |
| A | 3 | 137 | 6858 | 37.92 | 796 | 781 | 160.2 |
| B | 3 | 64 | 37815 | 243.0 | 798 | 779 | 152.4 |
| B | 12 | 111 | 18780 | 118.11 | 798 | 779 | 152.4 |
| B | 10 | 246 | 17473 | 109.53 | 798 | 779 | 152.4 |
| C | 14 | 238 | 121042 | 673.99 | 770 | 775 | 178.4 |
| C | 10 | 22 | 108651 | 604.55 | 770 | 775 | 178.4 |
| C | 13 | 61 | 5338 | 25.57 | 770 | 775 | 178.4 |
| D | 1 | 52 | 3213214 | 18331.59 | 720 | 698 | 175.2 |
| D | 11 | 176 | 662998 | 3779.28 | 720 | 698 | 175.2 |
| D | 7 | 223 | 156287 | 887.84 | 720 | 698 | 175.2 |
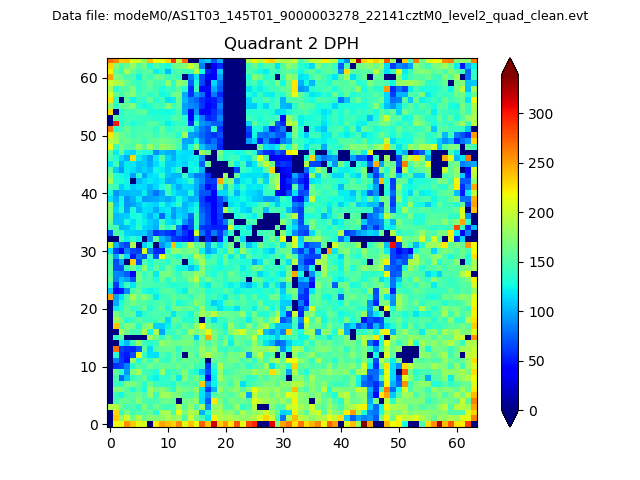
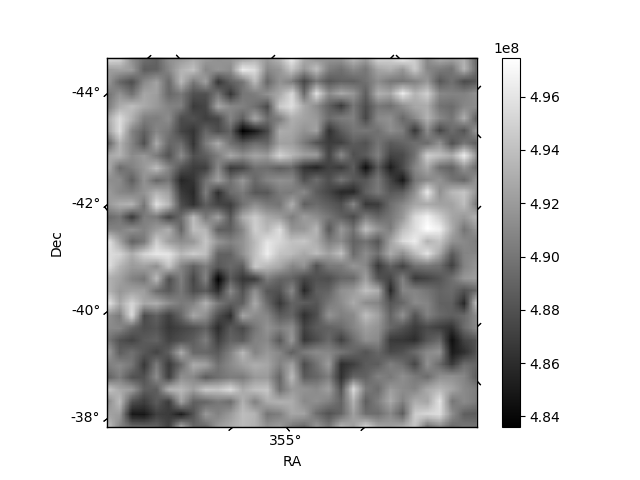
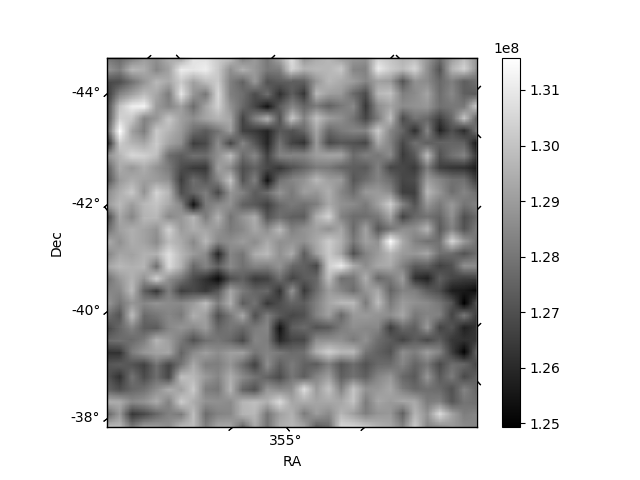
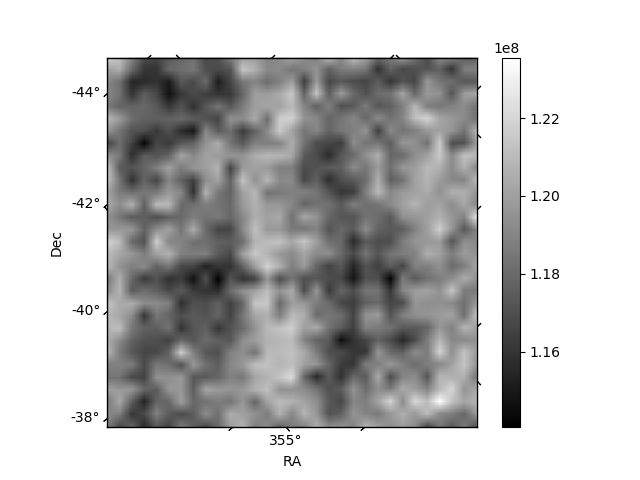
Histogram calculated using DETX and DETY for each event in the final _common_clean file
| Quadrant A | 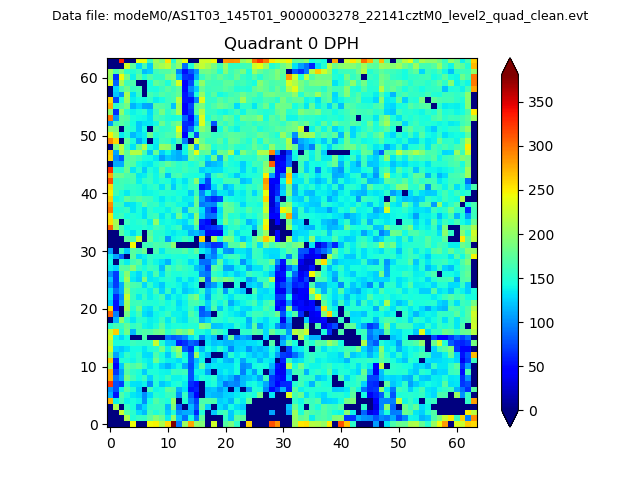 |
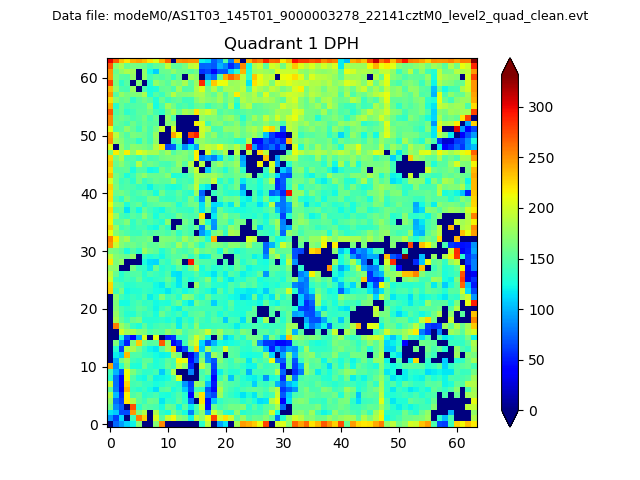 |
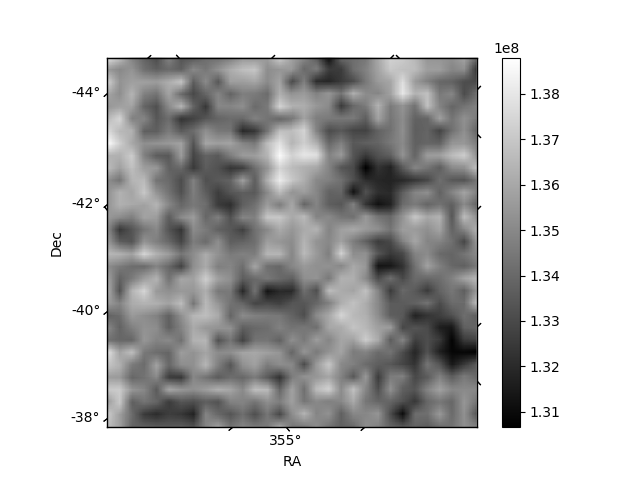
Quadrant B |
|---|---|---|---|
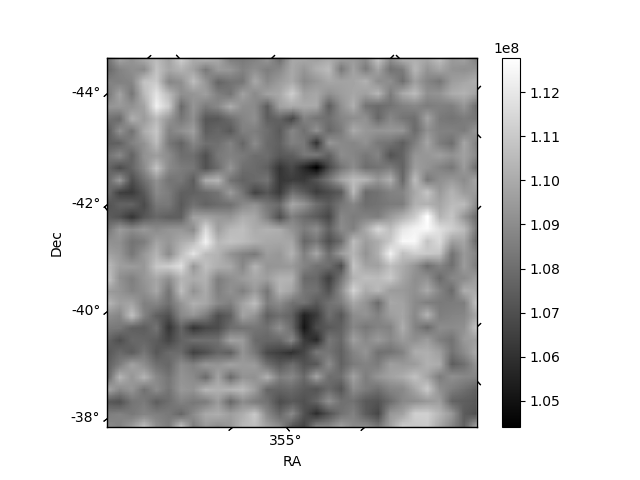
| Quadrant D | 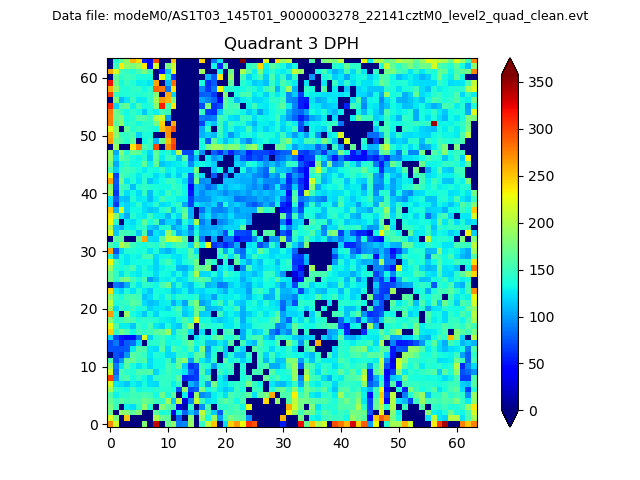 |
 |
Quadrant C |
| Plot type | Count rate plots | Images |
|---|---|---|
| Comparison with Poisson distribution Blue bars denote a histogram of data divided into 1 sec bins. Red curve is a Poisson curve with rate = median count rate of data. |
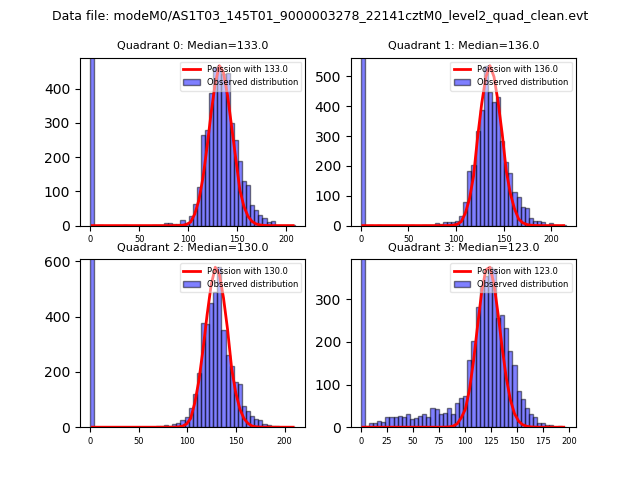 |
 |
| Quadrant-wise count rates Data is divided into 100 sec bins |
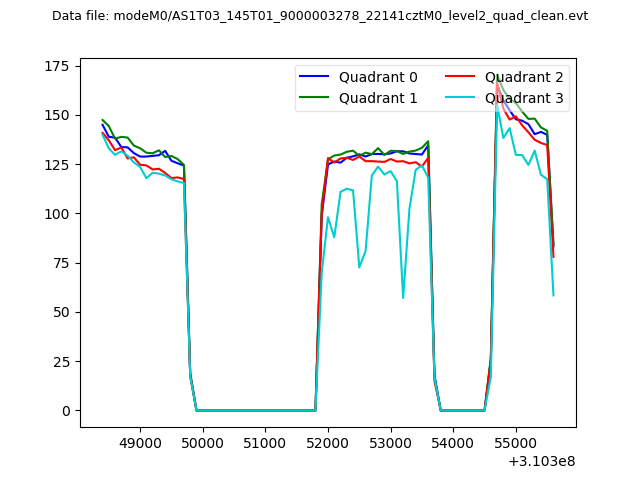 |
|
| Module-wise count rates for Quadrant A Data is divided into 100 sec bins |
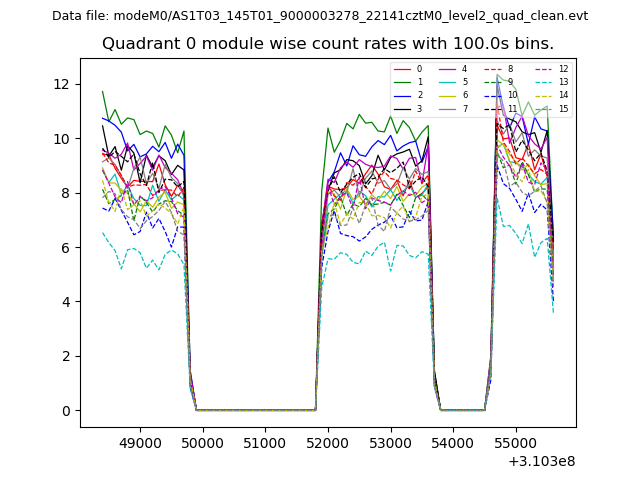 |
 |
| Module-wise count rates for Quadrant B Data is divided into 100 sec bins |
 |
 |
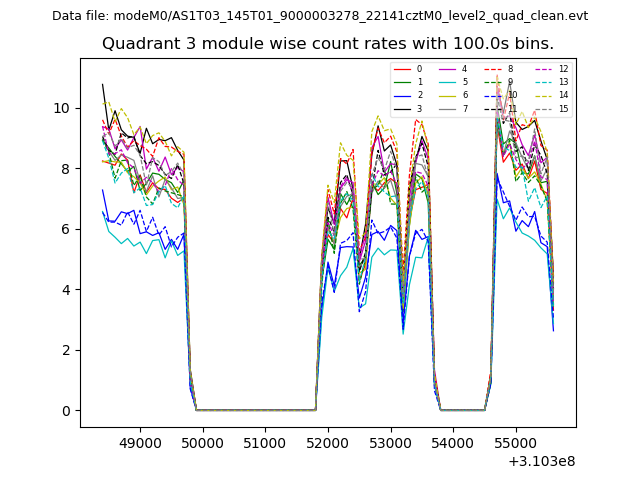
| Module-wise count rates for Quadrant C Data is divided into 100 sec bins |
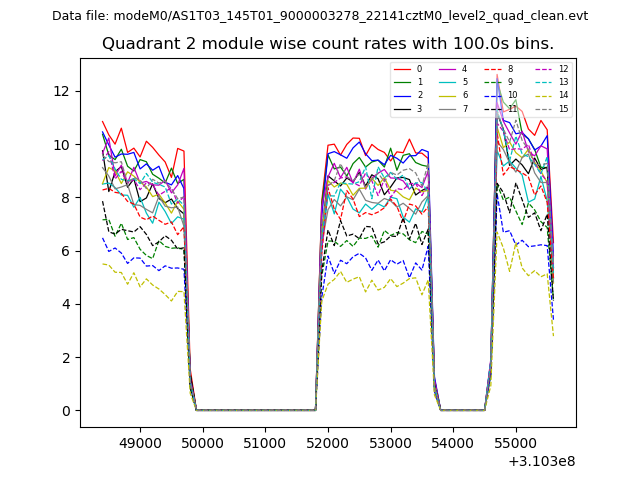 |
 |
| Module-wise count rates for Quadrant D Data is divided into 100 sec bins |
 |
 |
| Parameter | Plot |
|---|---|
| CZT HV Monitor | 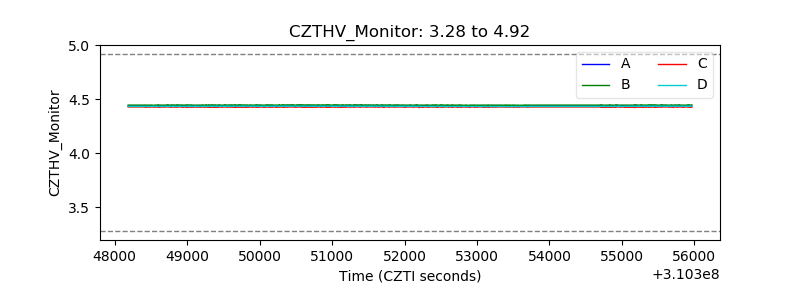 |
| D_VDD | 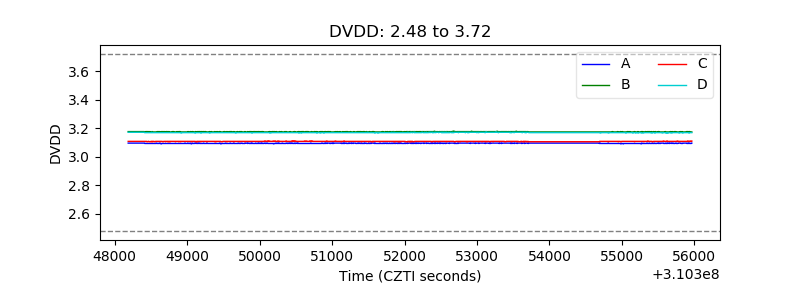 |
| Temperature 1 | 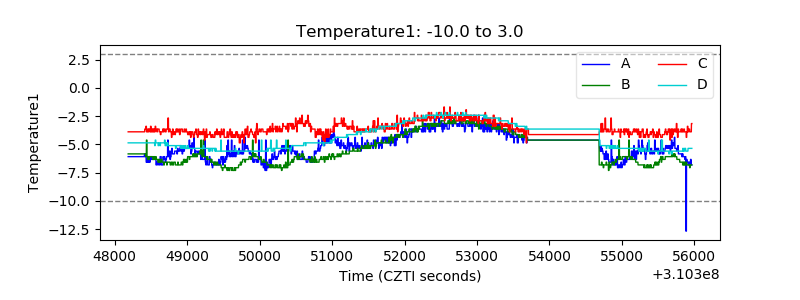 |
| Veto HV Monitor | 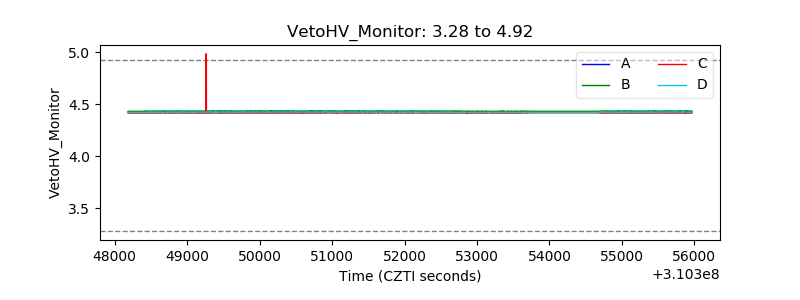 |
| Veto LLD | 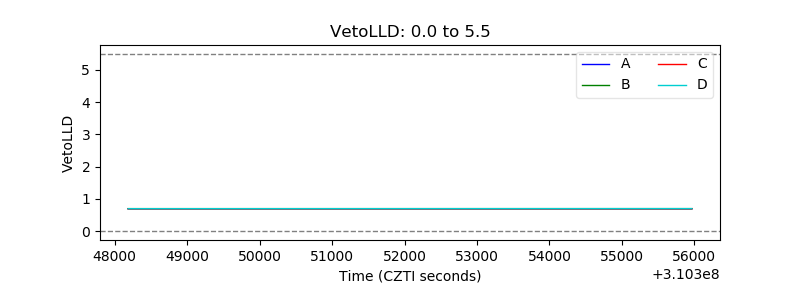 |
| Alpha Counter |  |
| _CPM_Rate | 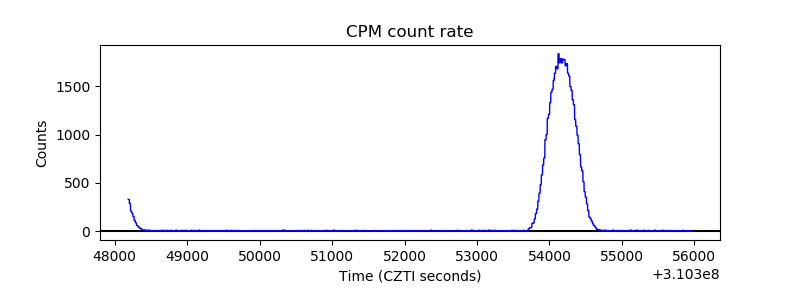 |
| CZT Counter | 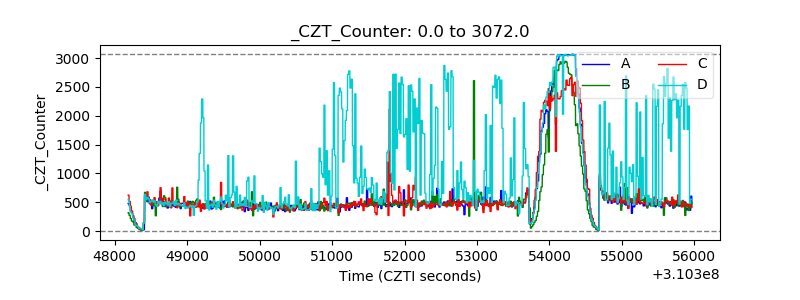 |
| +2.5 Volts monitor |  |
| +5 Volts monitor |  |
| _ROLL_ROT | 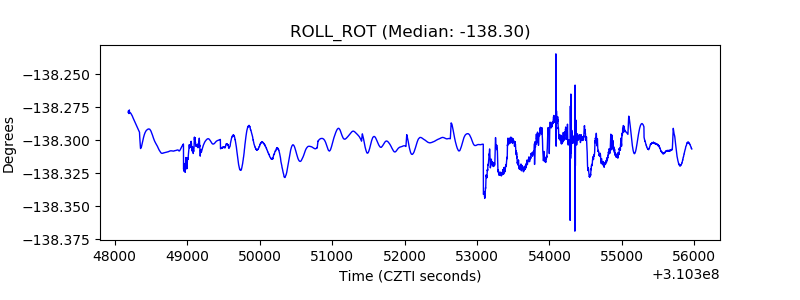 |
| _Roll_DEC | 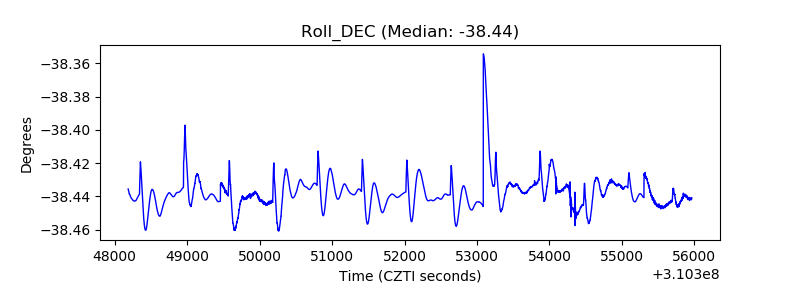 |
| _Roll_RA | 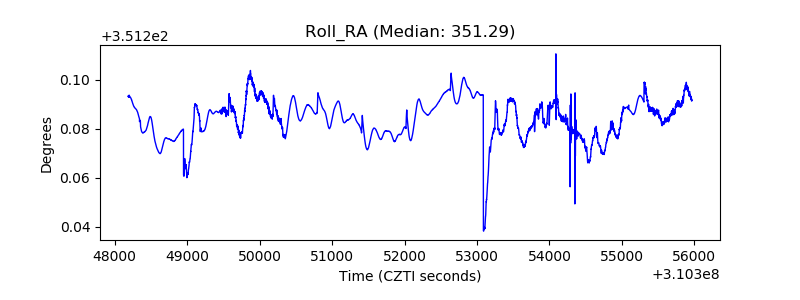 |
| Veto Counter | 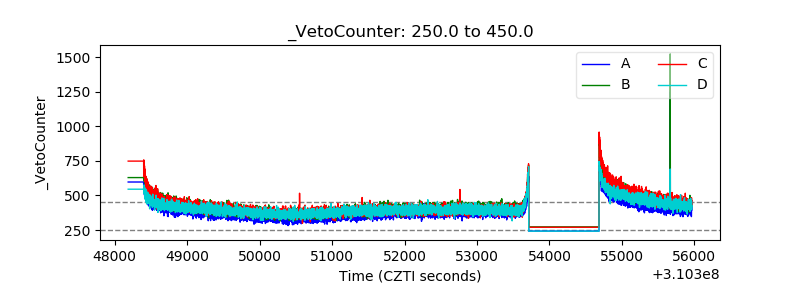 |