| Param | Original file | Final file |
|---|---|---|
| Filename | modeM0/AS1T03_145T01_9000003278_22143cztM0_level2.evt | modeM0/AS1T03_145T01_9000003278_22143cztM0_level2_quad_clean.evt |
| Size (bytes) | 566,110,080 | 81,080,640 |
| Size | 539.9 MB | 77.3 MB |
| Events in quadrant A | 3,176,731 | 515,823 |
| Events in quadrant B | 3,316,043 | 530,740 |
| Events in quadrant C | 3,272,005 | 507,291 |
| Events in quadrant D | 6,936,470 | 444,957 |
| Mode M0 | |||
|---|---|---|---|
| Quadrant | BADHDUFLAG | Total packets | Discarded packets |
| A | 0 | 13524 | 2 |
| B | 0 | 13859 | 2 |
| C | 0 | 13709 | 2 |
| D | 0 | 24986 | 2 |
| Mode SS | |||
|---|---|---|---|
| Quadrant | BADHDUFLAG | Total packets | Discarded packets |
| A | 0 | 134 | 0 |
| B | 0 | 134 | 0 |
| C | 0 | 134 | 0 |
| D | 0 | 134 | 0 |
| Mode M9 | |||
|---|---|---|---|
| Quadrant | BADHDUFLAG | Total packets | Discarded packets |
| A | 0 | 12 | 0 |
| B | 0 | 13 | 0 |
| C | 0 | 13 | 0 |
| D | 0 | 13 | 0 |
| Quadrant | Total seconds | Saturated seconds | Saturation percentage |
|---|---|---|---|
| A | 6535 | 48 | 0.734507% |
| B | 6535 | 62 | 0.948738% |
| C | 6535 | 93 | 1.423106% |
| D | 6535 | 1200 | 18.362663% |
Noise dominated data is calculated using 1-second bins in cleaned event files. If a bin has >2000 counts, and if more than 50% of those come from <1% of pixels, then it is considered to be noise-dominated and hence unusable.
| Quadrant | # 1 sec bins | Bins with >0 counts | Bins with >2000 counts | High rate bins dominated by noise | Noise dominated (total time) | Noise dominated (detector-on time) | Marked lightcurve |
|---|---|---|---|---|---|---|---|
| A | 7624 | 6535 | 0 | 0 | 0.00% | 0.00% | 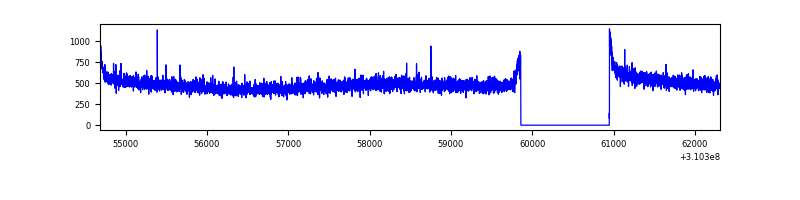 |
| B | 7624 | 6535 | 3 | 3 | 0.04% | 0.05% | 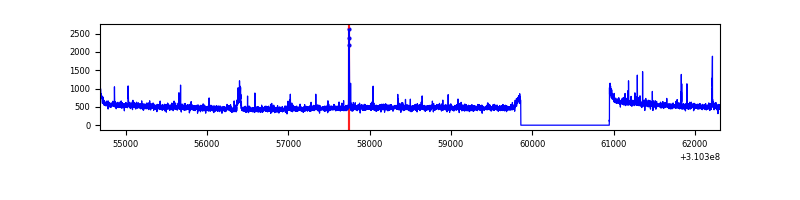 |
| C | 7624 | 6535 | 0 | 0 | 0.00% | 0.00% | 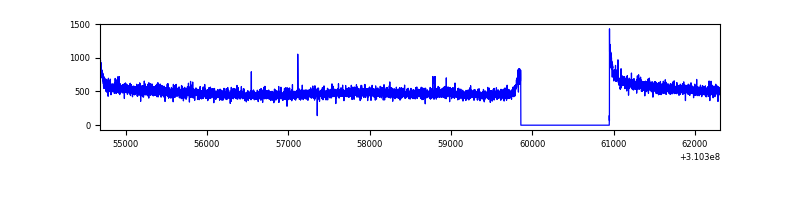 |
| D | 7624 | 6535 | 1202 | 1202 | 15.77% | 18.39% | 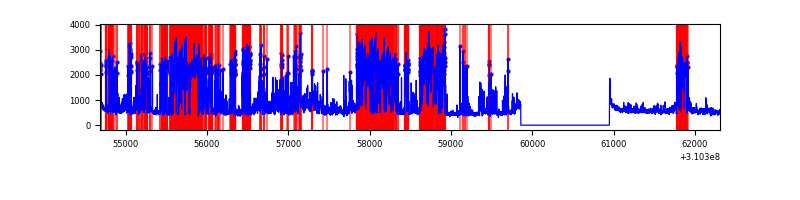 |
Top three noisy pixels from each quadrant. If the there are fewer than three noisy pixels in the level2.evt file, extra rows are filled as -1
| Pixel properties | Quadrant properties | ||||||
|---|---|---|---|---|---|---|---|
| Quadrant | DetID | PixID | Counts | Sigma | Mean | Median | Sigma |
| A | 13 | 254 | 10477 | 58.82 | 824 | 811 | 164.3 |
| A | 0 | 226 | 6892 | 37.0 | 824 | 811 | 164.3 |
| A | 3 | 137 | 6878 | 36.92 | 824 | 811 | 164.3 |
| B | 3 | 64 | 42282 | 268.19 | 826 | 808 | 154.6 |
| B | 10 | 246 | 24923 | 155.94 | 826 | 808 | 154.6 |
| B | 12 | 111 | 18737 | 115.94 | 826 | 808 | 154.6 |
| C | 14 | 238 | 128083 | 685.49 | 802 | 809 | 185.7 |
| C | 10 | 22 | 11904 | 59.76 | 802 | 809 | 185.7 |
| C | 13 | 61 | 5456 | 25.03 | 802 | 809 | 185.7 |
| D | 1 | 52 | 3470882 | 19150.26 | 750 | 730 | 181.2 |
| D | 7 | 223 | 349426 | 1924.3 | 750 | 730 | 181.2 |
| D | 13 | 104 | 230635 | 1268.75 | 750 | 730 | 181.2 |
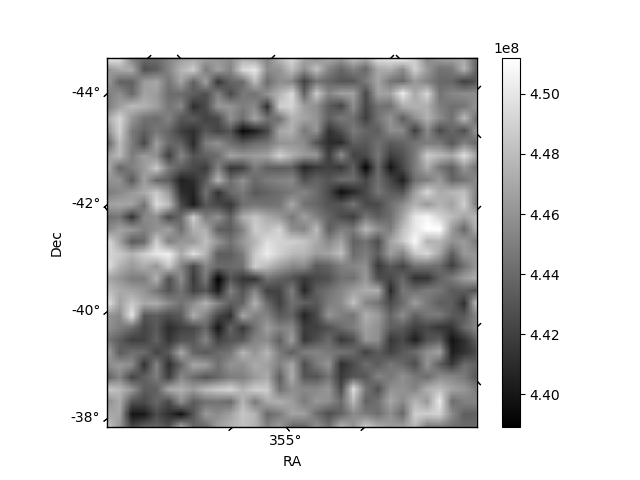
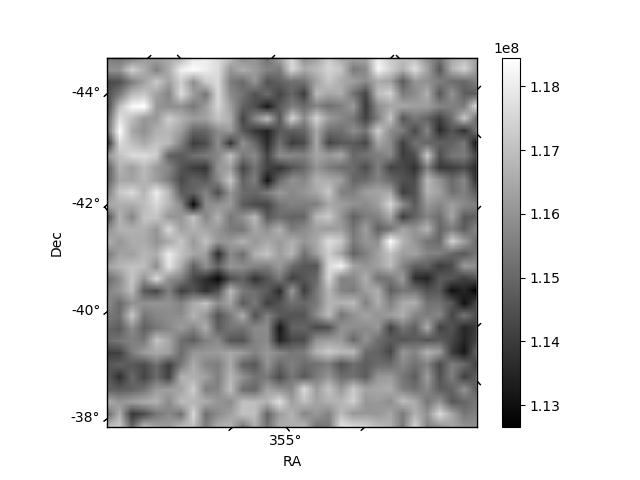
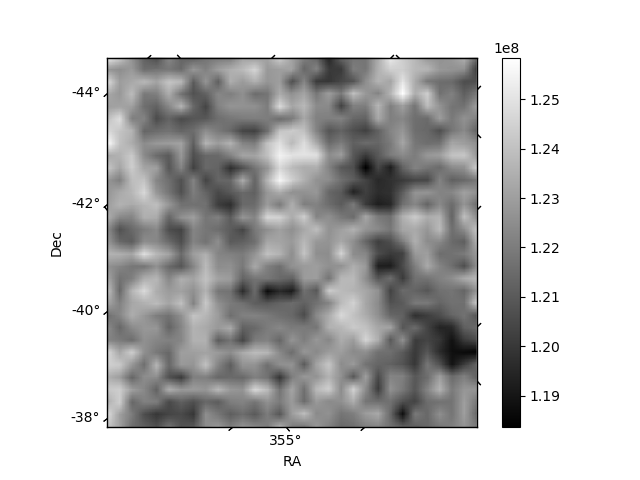
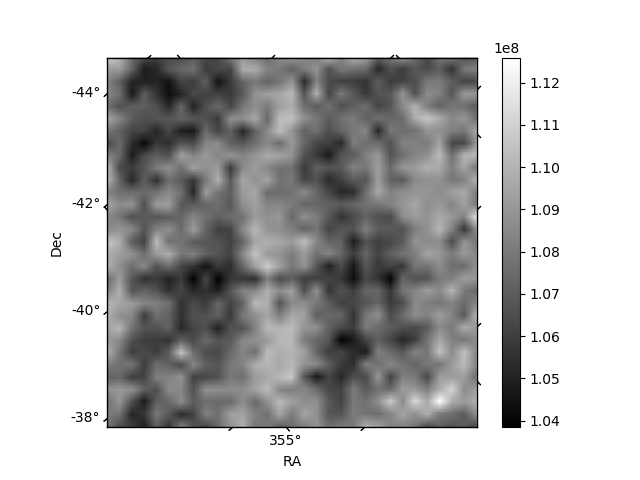
Histogram calculated using DETX and DETY for each event in the final _common_clean file
| Quadrant A | 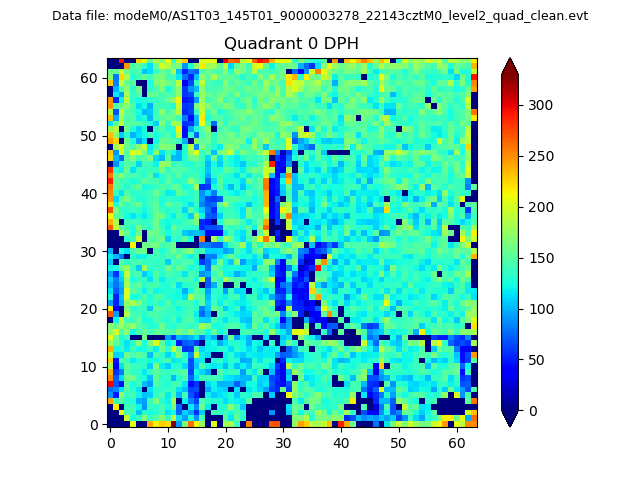 |
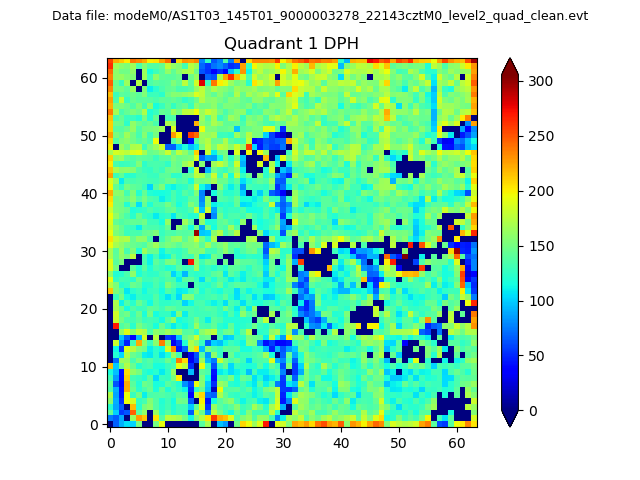 |
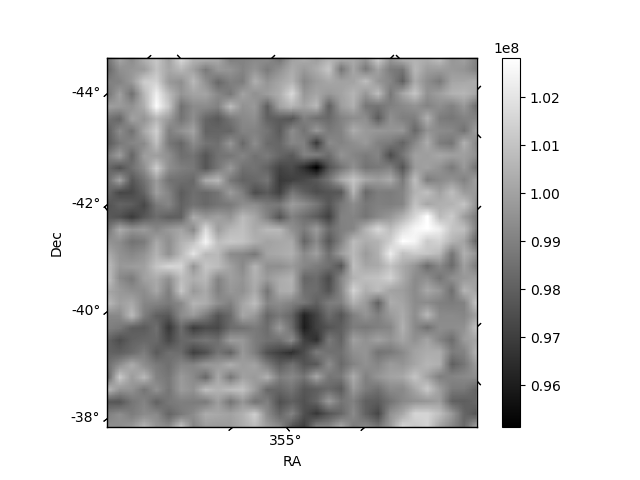
Quadrant B |
|---|---|---|---|
| Quadrant D | 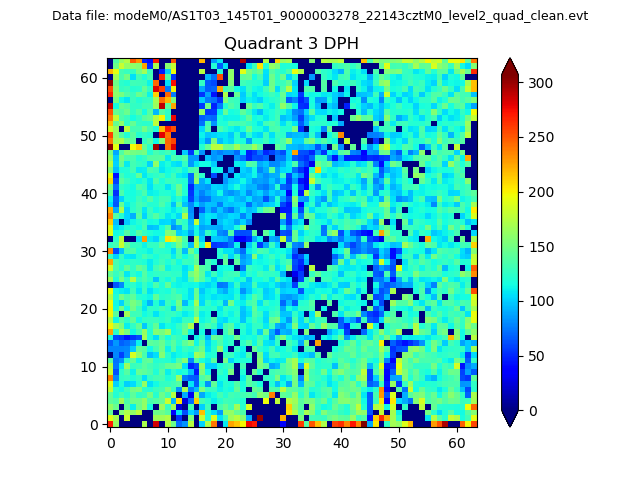 |
 |
Quadrant C |
| Plot type | Count rate plots | Images |
|---|---|---|
| Comparison with Poisson distribution Blue bars denote a histogram of data divided into 1 sec bins. Red curve is a Poisson curve with rate = median count rate of data. |
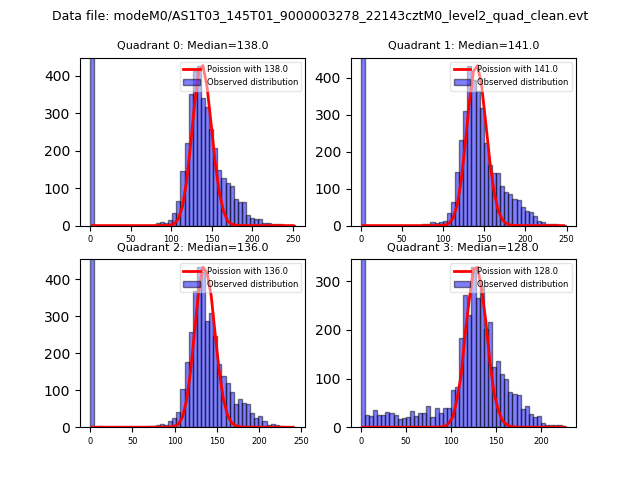 |
 |
| Quadrant-wise count rates Data is divided into 100 sec bins |
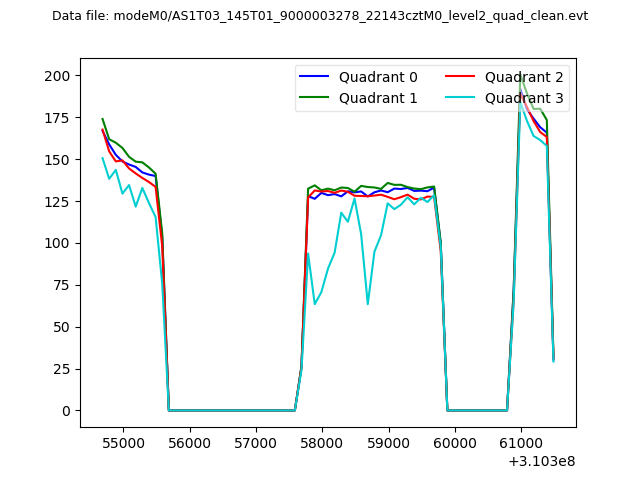 |
|
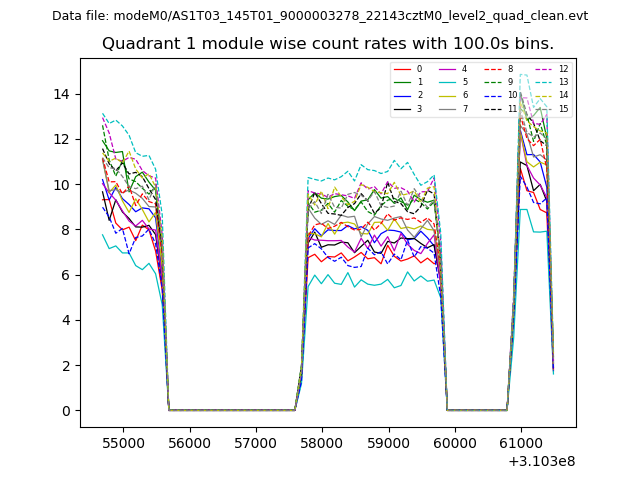
| Module-wise count rates for Quadrant A Data is divided into 100 sec bins |
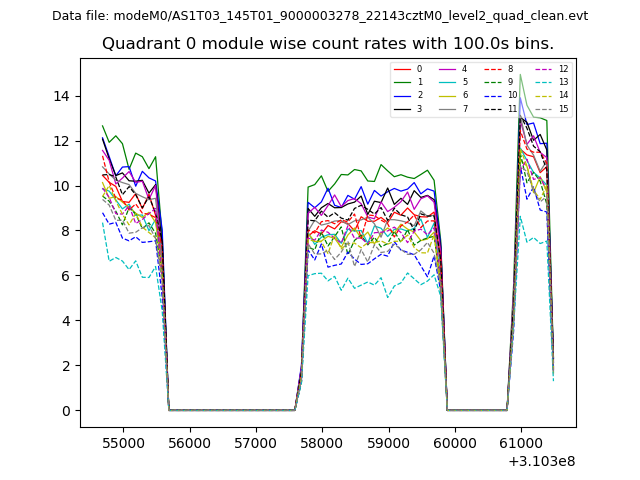 |
 |
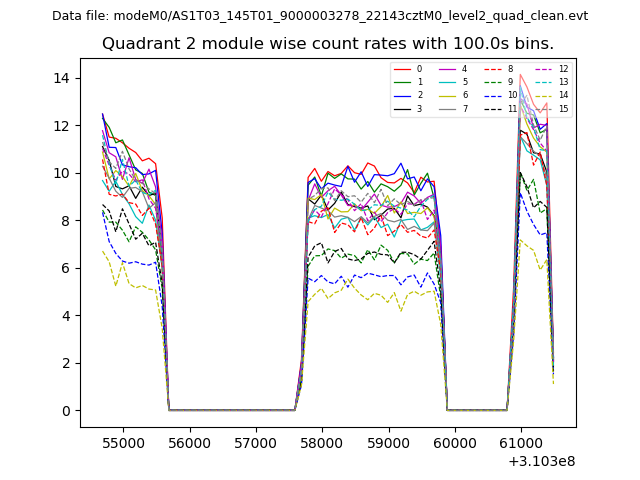
| Module-wise count rates for Quadrant B Data is divided into 100 sec bins |
 |
 |
| Module-wise count rates for Quadrant C Data is divided into 100 sec bins |
 |
 |
| Module-wise count rates for Quadrant D Data is divided into 100 sec bins |
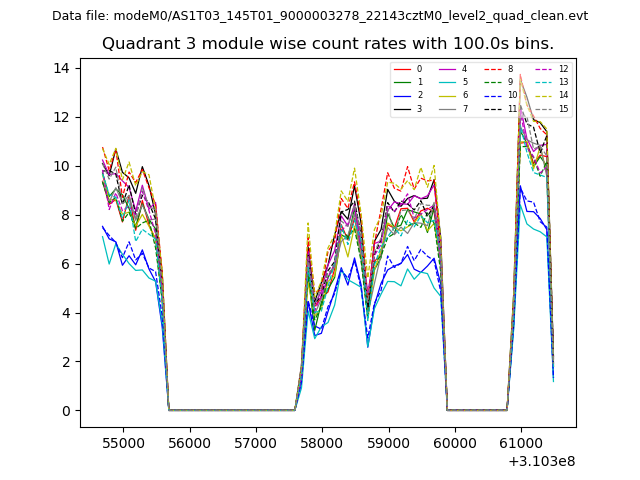 |
 |
| Parameter | Plot |
|---|---|
| CZT HV Monitor | 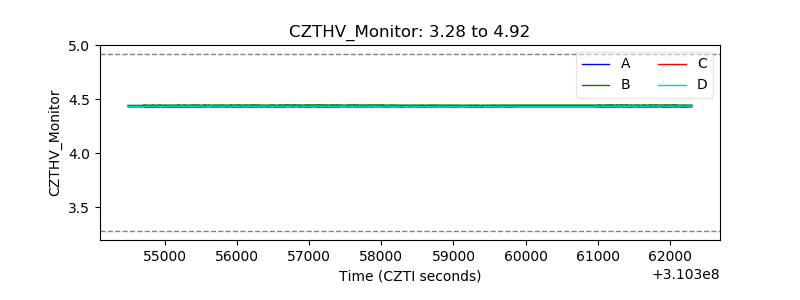 |
| D_VDD | 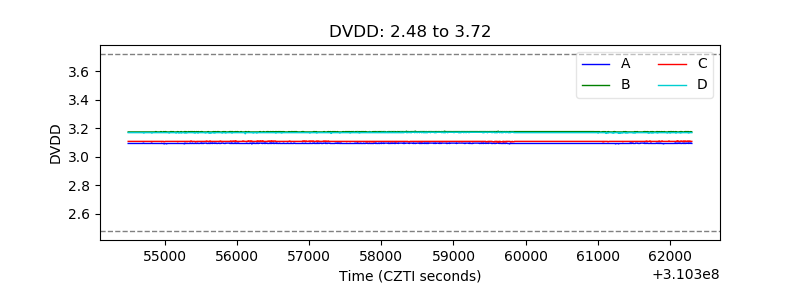 |
| Temperature 1 | 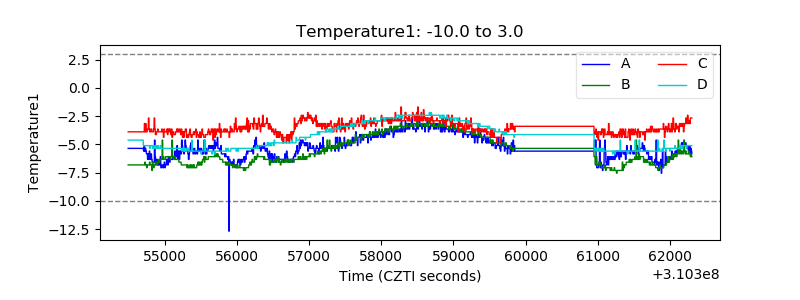 |
| Veto HV Monitor | 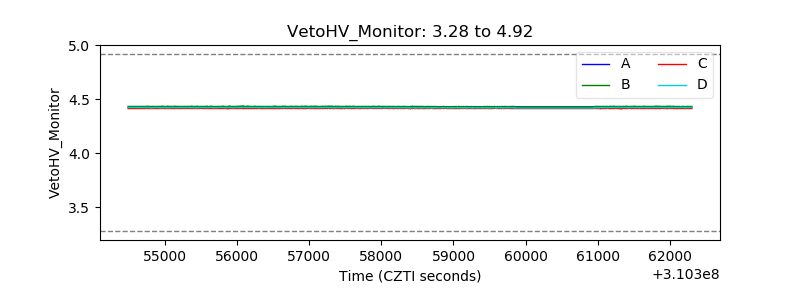 |
| Veto LLD | 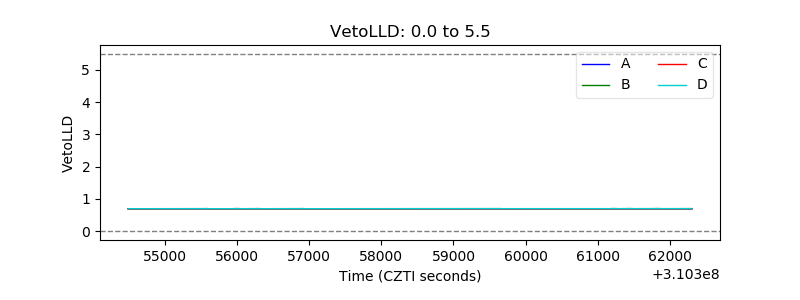 |
| Alpha Counter | 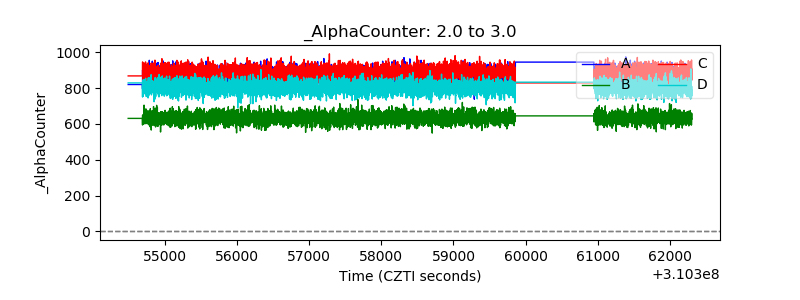 |
| _CPM_Rate | 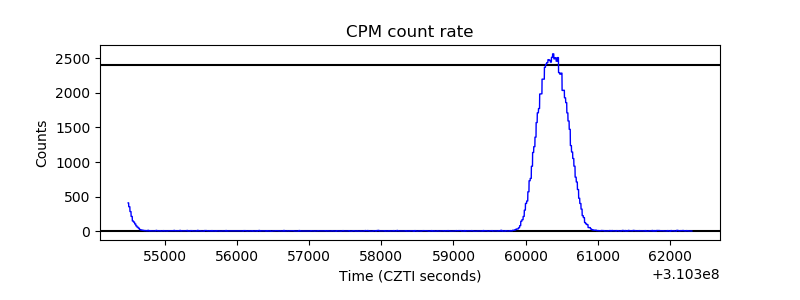 |
| CZT Counter | 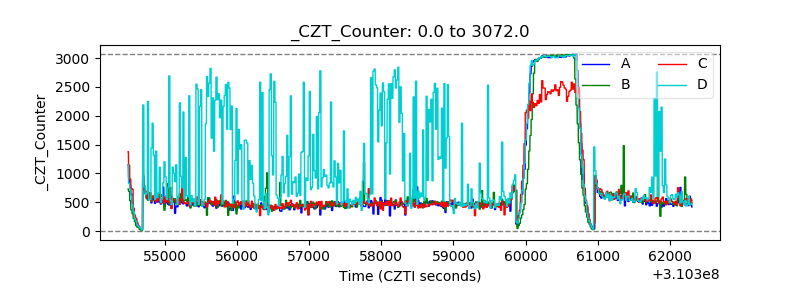 |
| +2.5 Volts monitor | 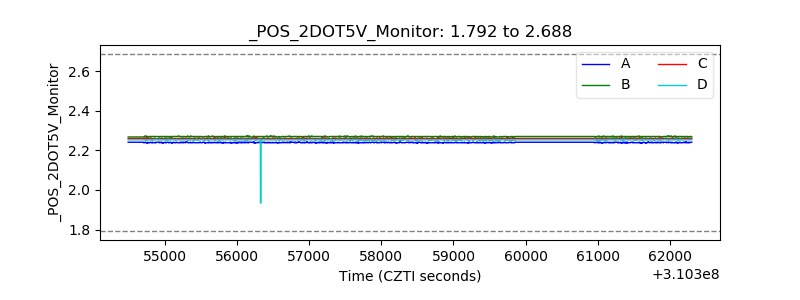 |
| +5 Volts monitor |  |
| _ROLL_ROT | 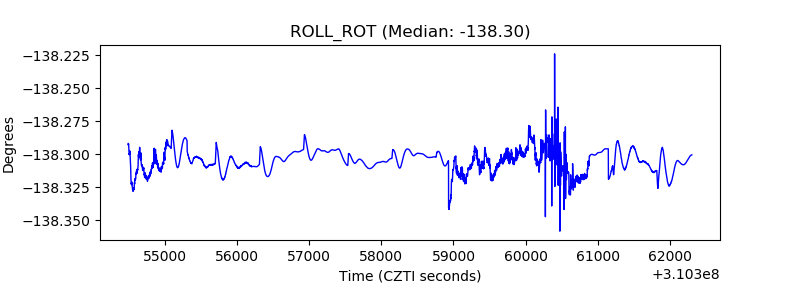 |
| _Roll_DEC |  |
| _Roll_RA | 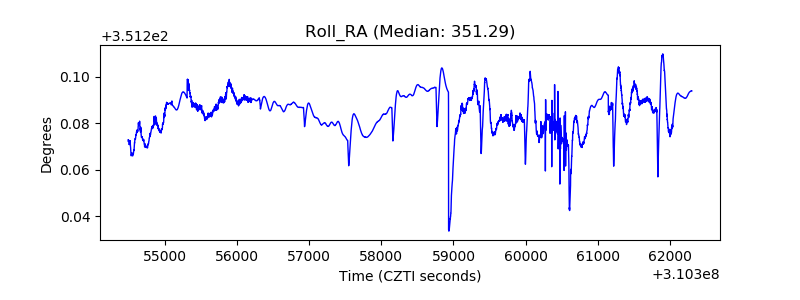 |
| Veto Counter | 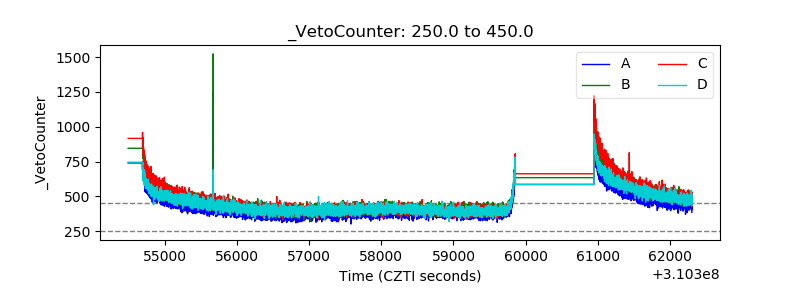 |