| Param | Original file | Final file |
|---|---|---|
| Filename | modeM0/AS1T03_145T01_9000003278_22145cztM0_level2.evt | modeM0/AS1T03_145T01_9000003278_22145cztM0_level2_quad_clean.evt |
| Size (bytes) | 478,543,680 | 69,621,120 |
| Size | 456.4 MB | 66.4 MB |
| Events in quadrant A | 3,427,810 | 418,095 |
| Events in quadrant B | 3,503,397 | 428,315 |
| Events in quadrant C | 3,528,224 | 414,523 |
| Events in quadrant D | 3,605,019 | 406,719 |
| Mode M0 | |||
|---|---|---|---|
| Quadrant | BADHDUFLAG | Total packets | Discarded packets |
| A | 0 | 14049 | 2 |
| B | 0 | 14261 | 2 |
| C | 0 | 14538 | 2 |
| D | 0 | 14782 | 2 |
| Mode SS | |||
|---|---|---|---|
| Quadrant | BADHDUFLAG | Total packets | Discarded packets |
| A | 0 | 128 | 0 |
| B | 0 | 128 | 0 |
| C | 0 | 128 | 0 |
| D | 0 | 128 | 0 |
| Mode M9 | |||
|---|---|---|---|
| Quadrant | BADHDUFLAG | Total packets | Discarded packets |
| A | 0 | 14 | 0 |
| B | 0 | 15 | 0 |
| C | 0 | 15 | 0 |
| D | 0 | 15 | 0 |
| Quadrant | Total seconds | Saturated seconds | Saturation percentage |
|---|---|---|---|
| A | 6311 | 102 | 1.616226% |
| B | 6311 | 110 | 1.742988% |
| C | 6311 | 155 | 2.456029% |
| D | 6311 | 99 | 1.568690% |
Noise dominated data is calculated using 1-second bins in cleaned event files. If a bin has >2000 counts, and if more than 50% of those come from <1% of pixels, then it is considered to be noise-dominated and hence unusable.
| Quadrant | # 1 sec bins | Bins with >0 counts | Bins with >2000 counts | High rate bins dominated by noise | Noise dominated (total time) | Noise dominated (detector-on time) | Marked lightcurve |
|---|---|---|---|---|---|---|---|
| A | 7576 | 6312 | 0 | 0 | 0.00% | 0.00% | 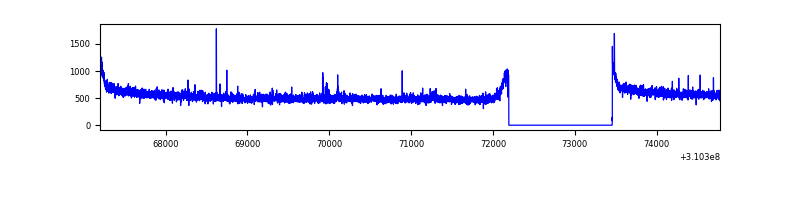 |
| B | 7576 | 6312 | 1 | 1 | 0.01% | 0.02% | 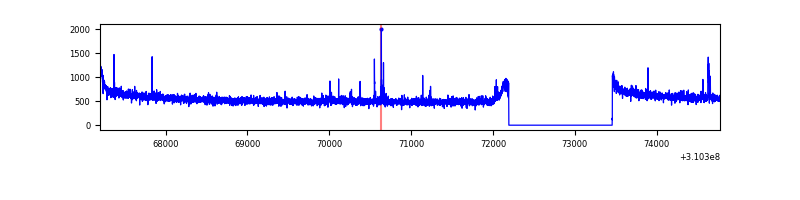 |
| C | 7576 | 6312 | 0 | 0 | 0.00% | 0.00% | 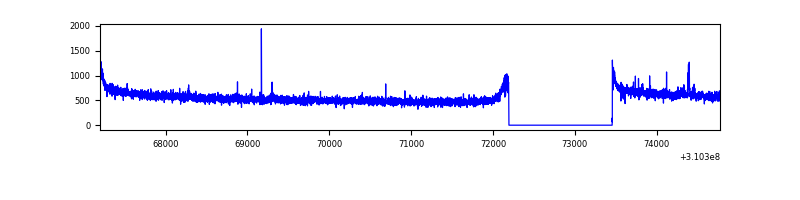 |
| D | 7576 | 6312 | 23 | 23 | 0.30% | 0.36% | 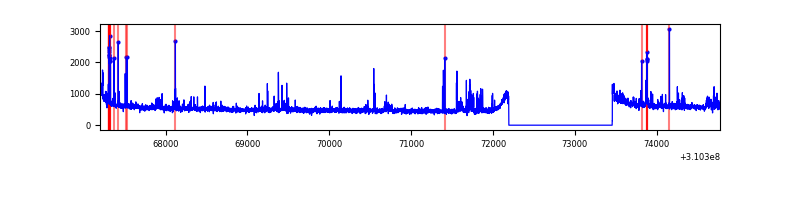 |
Top three noisy pixels from each quadrant. If the there are fewer than three noisy pixels in the level2.evt file, extra rows are filled as -1
| Pixel properties | Quadrant properties | ||||||
|---|---|---|---|---|---|---|---|
| Quadrant | DetID | PixID | Counts | Sigma | Mean | Median | Sigma |
| A | 4 | 2 | 18635 | 102.44 | 883 | 869 | 173.4 |
| A | 13 | 254 | 10608 | 56.16 | 883 | 869 | 173.4 |
| A | 3 | 1 | 8884 | 46.22 | 883 | 869 | 173.4 |
| B | 12 | 111 | 19218 | 112.93 | 883 | 865 | 162.5 |
| B | 10 | 246 | 18377 | 107.75 | 883 | 865 | 162.5 |
| B | 11 | 111 | 17116 | 100.0 | 883 | 865 | 162.5 |
| C | 14 | 238 | 138802 | 703.99 | 859 | 870 | 195.9 |
| C | 10 | 22 | 32848 | 163.21 | 859 | 870 | 195.9 |
| C | 13 | 61 | 5862 | 25.48 | 859 | 870 | 195.9 |
| D | 7 | 223 | 254603 | 1229.13 | 867 | 844 | 206.5 |
| D | 1 | 52 | 60519 | 289.05 | 867 | 844 | 206.5 |
| D | 2 | 234 | 26486 | 124.2 | 867 | 844 | 206.5 |
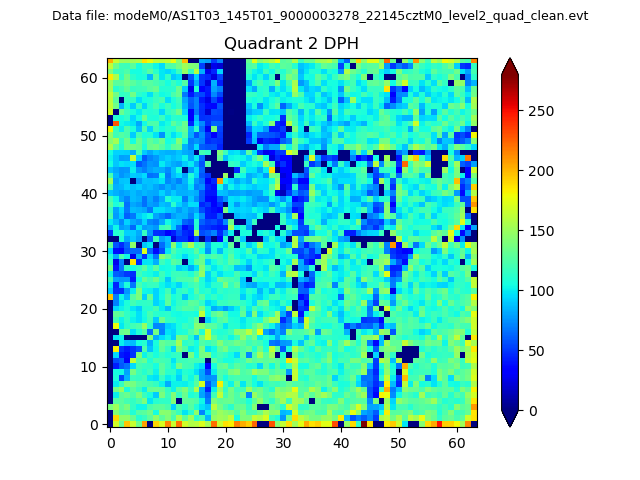
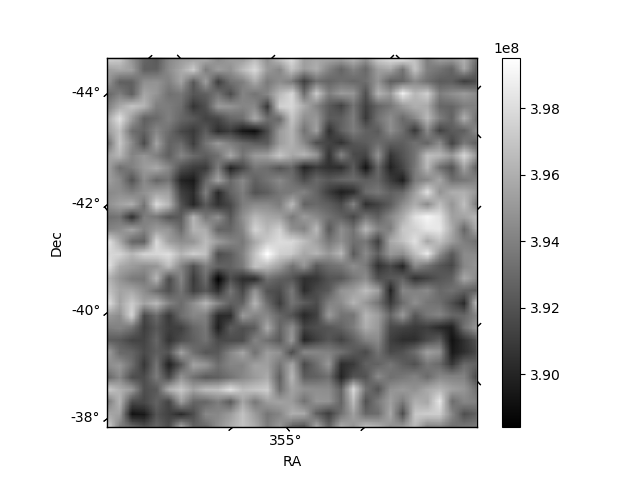
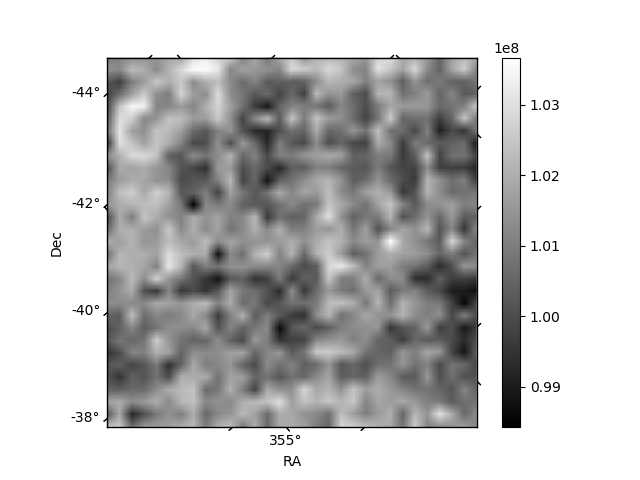
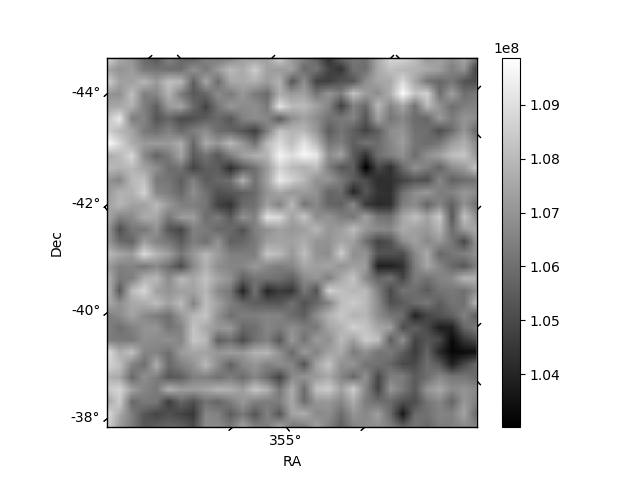
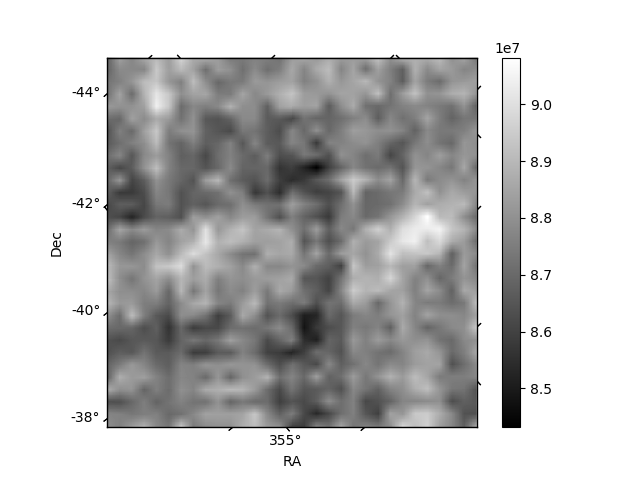
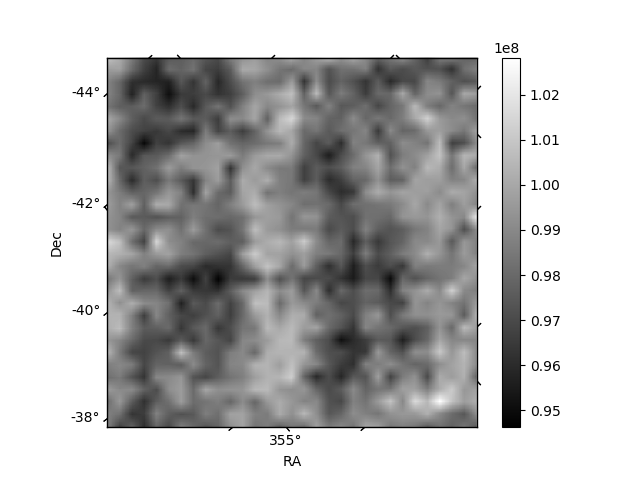
Histogram calculated using DETX and DETY for each event in the final _common_clean file
| Quadrant A | 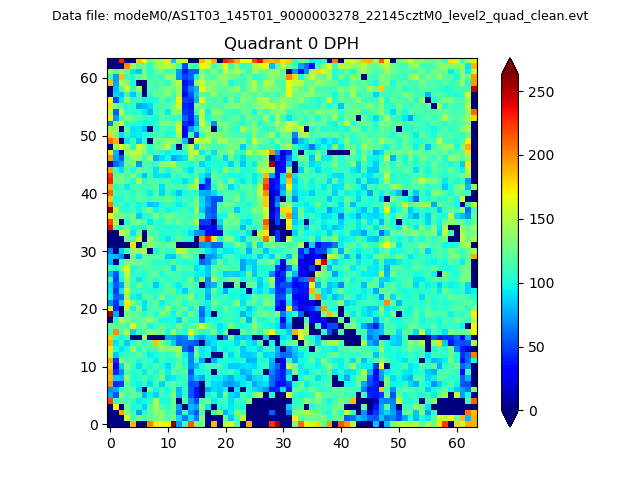 |
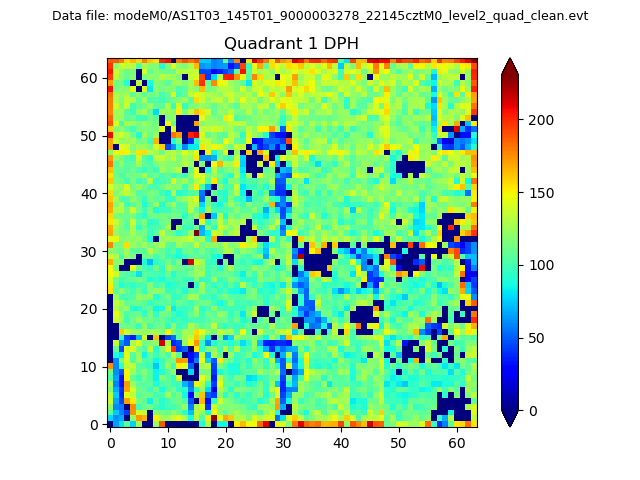 |
Quadrant B |
|---|---|---|---|
| Quadrant D | 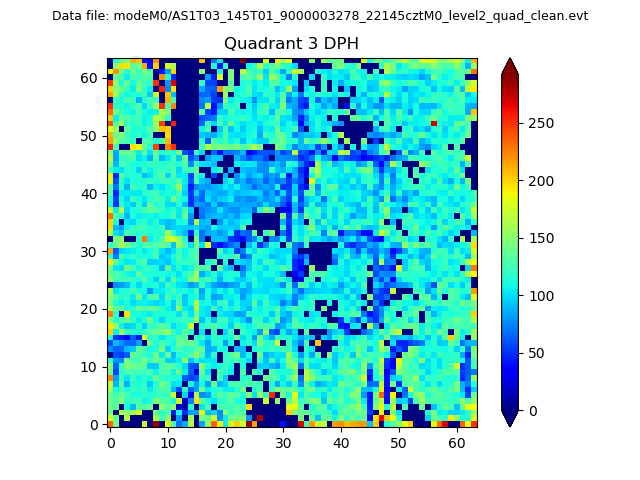 |
 |
Quadrant C |
| Plot type | Count rate plots | Images |
|---|---|---|
| Comparison with Poisson distribution Blue bars denote a histogram of data divided into 1 sec bins. Red curve is a Poisson curve with rate = median count rate of data. |
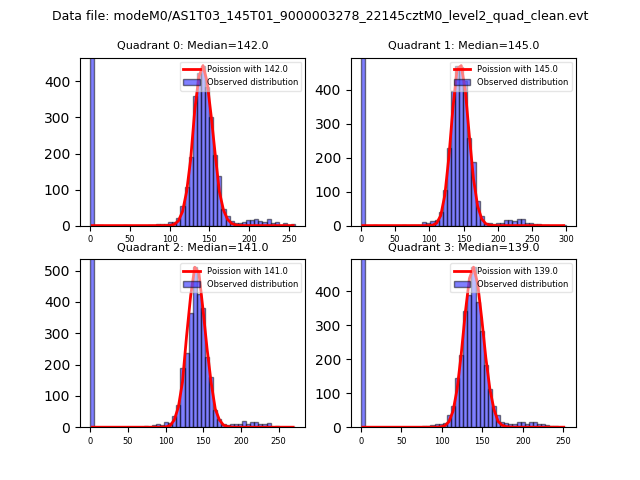 |
 |
| Quadrant-wise count rates Data is divided into 100 sec bins |
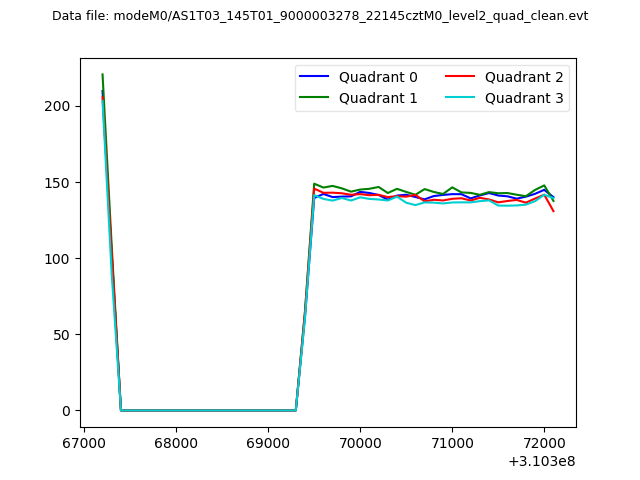 |
|
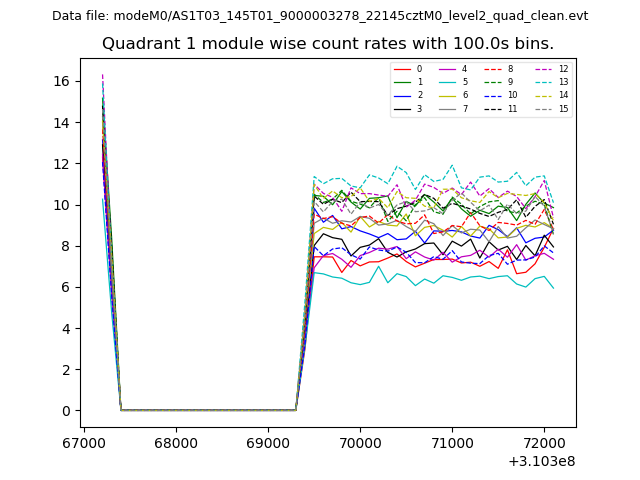
| Module-wise count rates for Quadrant A Data is divided into 100 sec bins |
 |
 |
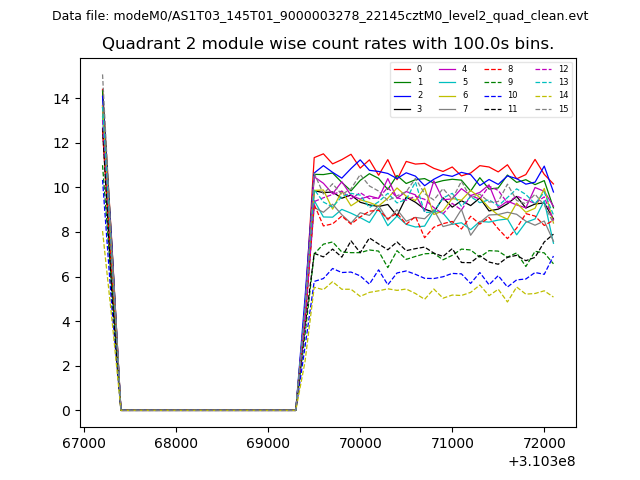
| Module-wise count rates for Quadrant B Data is divided into 100 sec bins |
 |
 |
| Module-wise count rates for Quadrant C Data is divided into 100 sec bins |
 |
 |
| Module-wise count rates for Quadrant D Data is divided into 100 sec bins |
 |
 |
| Parameter | Plot |
|---|---|
| CZT HV Monitor | 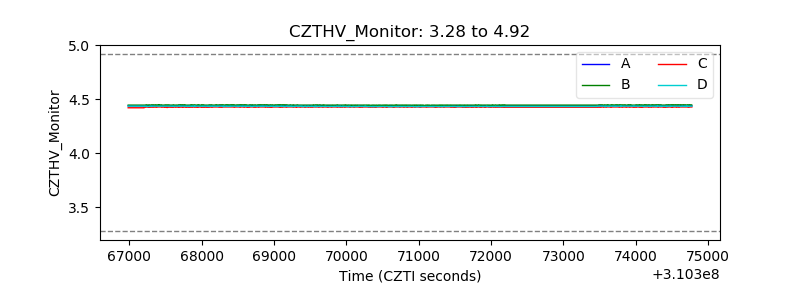 |
| D_VDD | 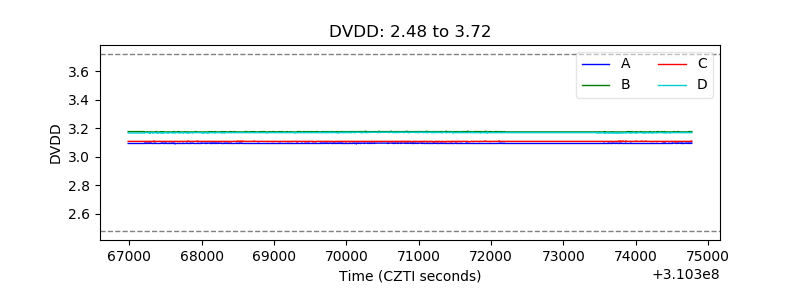 |
| Temperature 1 | 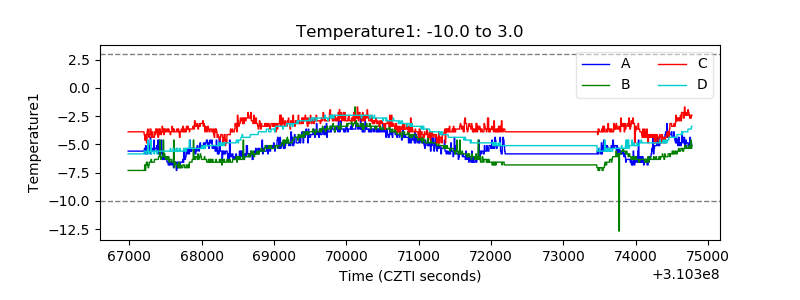 |
| Veto HV Monitor | 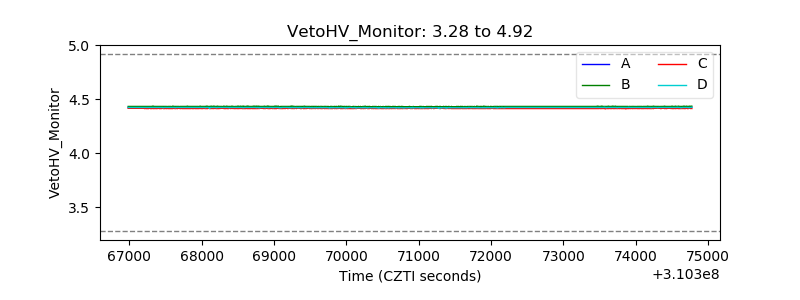 |
| Veto LLD | 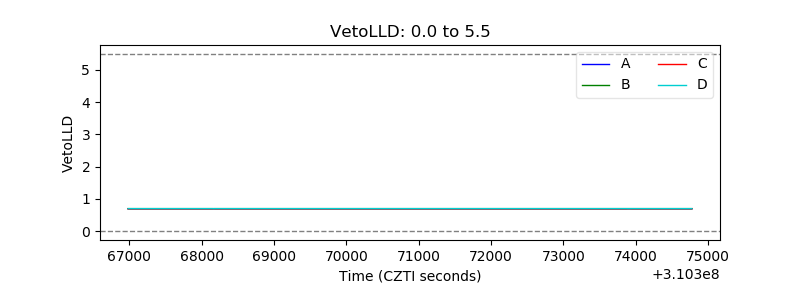 |
| Alpha Counter | 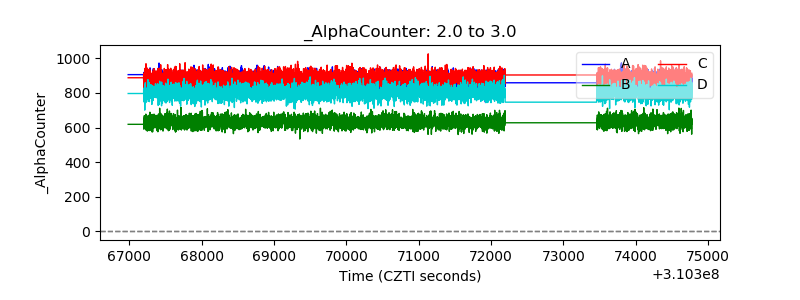 |
| _CPM_Rate | 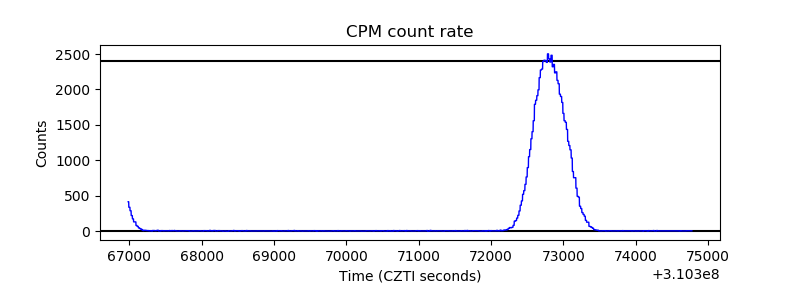 |
| CZT Counter | 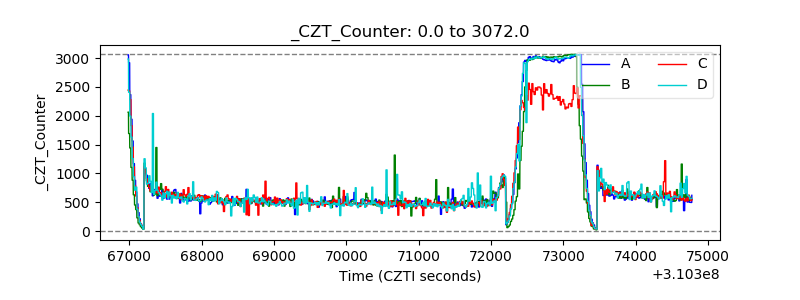 |
| +2.5 Volts monitor |  |
| +5 Volts monitor |  |
| _ROLL_ROT |  |
| _Roll_DEC | 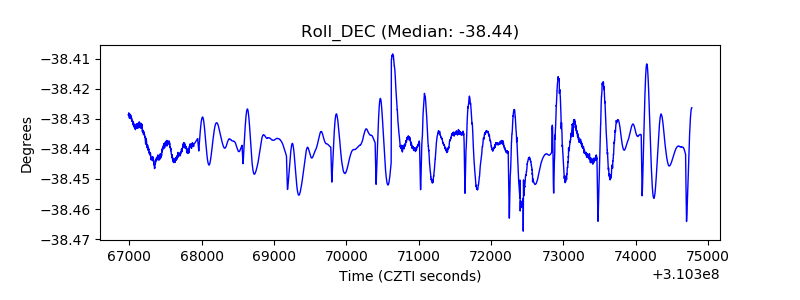 |
| _Roll_RA | 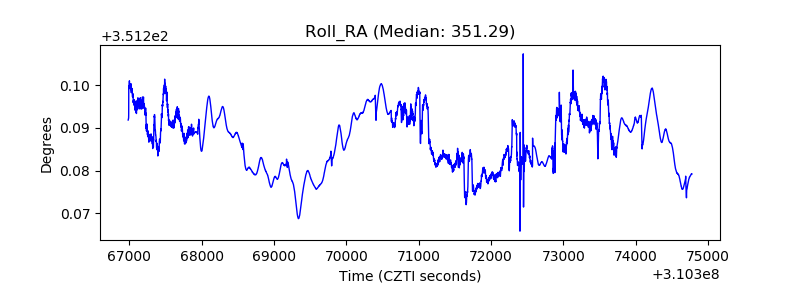 |
| Veto Counter | 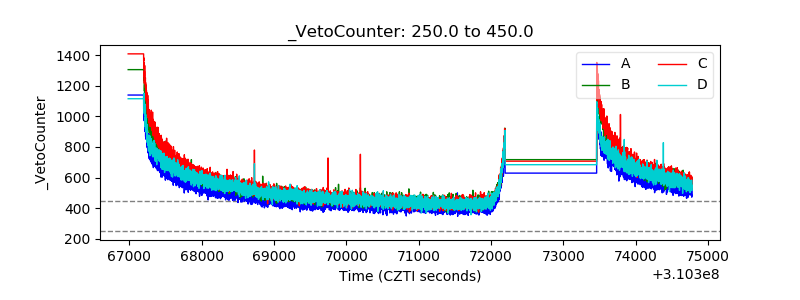 |