| Param | Original file | Final file |
|---|---|---|
| Filename | modeM0/AS1T03_145T01_9000003278_22146cztM0_level2.evt | modeM0/AS1T03_145T01_9000003278_22146cztM0_level2_quad_clean.evt |
| Size (bytes) | 486,155,520 | 73,900,800 |
| Size | 463.6 MB | 70.5 MB |
| Events in quadrant A | 3,445,107 | 453,051 |
| Events in quadrant B | 3,524,944 | 462,653 |
| Events in quadrant C | 3,625,226 | 444,878 |
| Events in quadrant D | 3,700,078 | 436,934 |
| Mode M0 | |||
|---|---|---|---|
| Quadrant | BADHDUFLAG | Total packets | Discarded packets |
| A | 0 | 14095 | 2 |
| B | 0 | 14360 | 2 |
| C | 0 | 14966 | 2 |
| D | 0 | 15107 | 2 |
| Mode SS | |||
|---|---|---|---|
| Quadrant | BADHDUFLAG | Total packets | Discarded packets |
| A | 0 | 128 | 0 |
| B | 0 | 128 | 0 |
| C | 0 | 128 | 0 |
| D | 0 | 128 | 0 |
| Mode M9 | |||
|---|---|---|---|
| Quadrant | BADHDUFLAG | Total packets | Discarded packets |
| A | 0 | 14 | 0 |
| B | 0 | 15 | 0 |
| C | 0 | 15 | 0 |
| D | 0 | 15 | 0 |
| Quadrant | Total seconds | Saturated seconds | Saturation percentage |
|---|---|---|---|
| A | 6307 | 84 | 1.331853% |
| B | 6307 | 114 | 1.807515% |
| C | 6307 | 169 | 2.679562% |
| D | 6307 | 86 | 1.363564% |
Noise dominated data is calculated using 1-second bins in cleaned event files. If a bin has >2000 counts, and if more than 50% of those come from <1% of pixels, then it is considered to be noise-dominated and hence unusable.
| Quadrant | # 1 sec bins | Bins with >0 counts | Bins with >2000 counts | High rate bins dominated by noise | Noise dominated (total time) | Noise dominated (detector-on time) | Marked lightcurve |
|---|---|---|---|---|---|---|---|
| A | 7622 | 6308 | 0 | 0 | 0.00% | 0.00% | 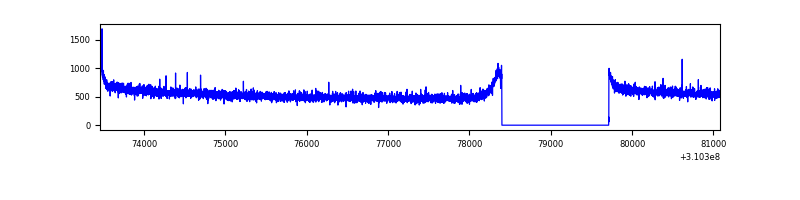 |
| B | 7622 | 6308 | 0 | 0 | 0.00% | 0.00% | 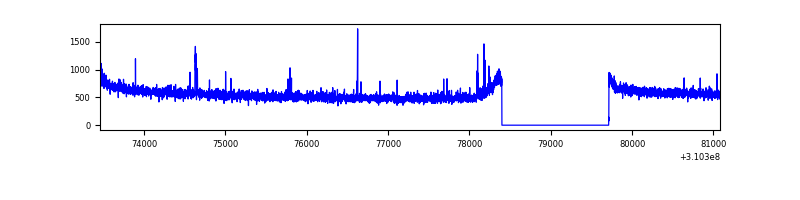 |
| C | 7622 | 6308 | 3 | 3 | 0.04% | 0.05% | 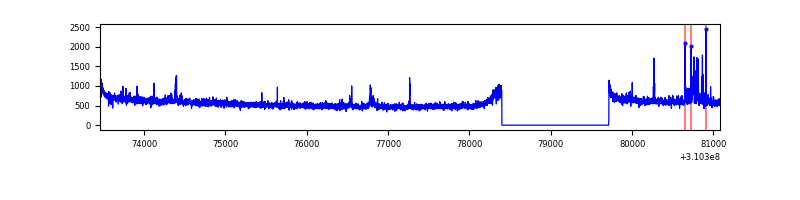 |
| D | 7622 | 6308 | 17 | 17 | 0.22% | 0.27% | 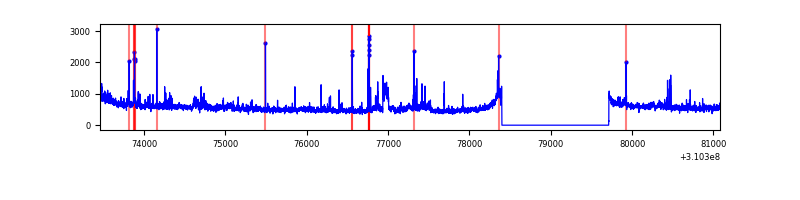 |
Top three noisy pixels from each quadrant. If the there are fewer than three noisy pixels in the level2.evt file, extra rows are filled as -1
| Pixel properties | Quadrant properties | ||||||
|---|---|---|---|---|---|---|---|
| Quadrant | DetID | PixID | Counts | Sigma | Mean | Median | Sigma |
| A | 13 | 254 | 10831 | 56.41 | 893 | 880 | 176.4 |
| A | 0 | 226 | 7535 | 37.73 | 893 | 880 | 176.4 |
| A | 3 | 137 | 6973 | 34.54 | 893 | 880 | 176.4 |
| B | 3 | 64 | 32404 | 193.56 | 887 | 868 | 162.9 |
| B | 12 | 111 | 18952 | 111.0 | 887 | 868 | 162.9 |
| B | 11 | 111 | 17196 | 100.22 | 887 | 868 | 162.9 |
| C | 14 | 238 | 139967 | 708.27 | 860 | 871 | 196.4 |
| C | 3 | 9 | 78484 | 395.2 | 860 | 871 | 196.4 |
| C | 10 | 22 | 52086 | 260.79 | 860 | 871 | 196.4 |
| D | 1 | 52 | 252508 | 1206.01 | 872 | 849 | 208.7 |
| D | 7 | 223 | 110700 | 526.43 | 872 | 849 | 208.7 |
| D | 2 | 234 | 28268 | 131.4 | 872 | 849 | 208.7 |
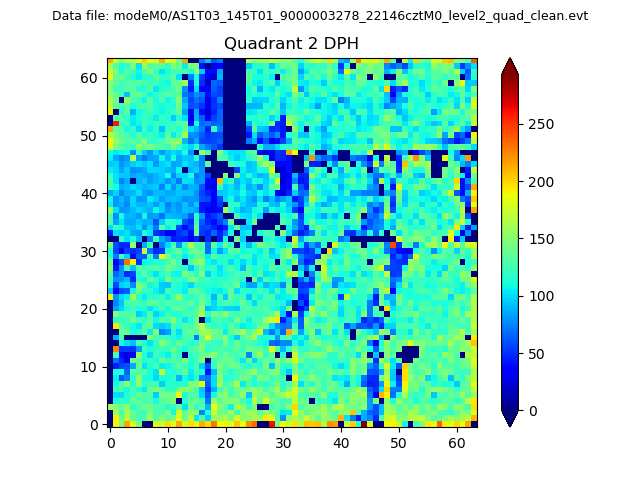
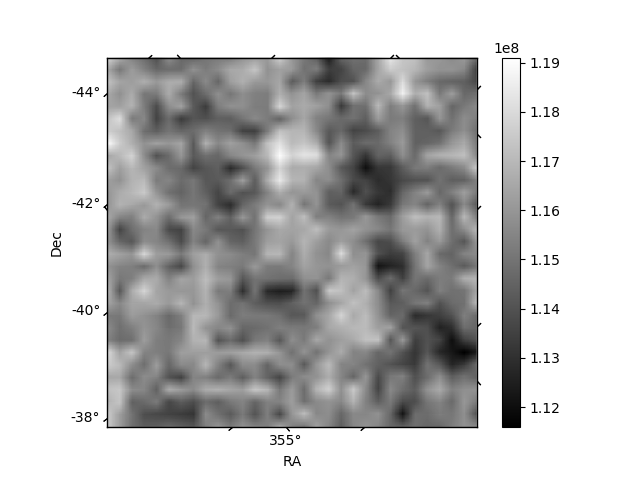
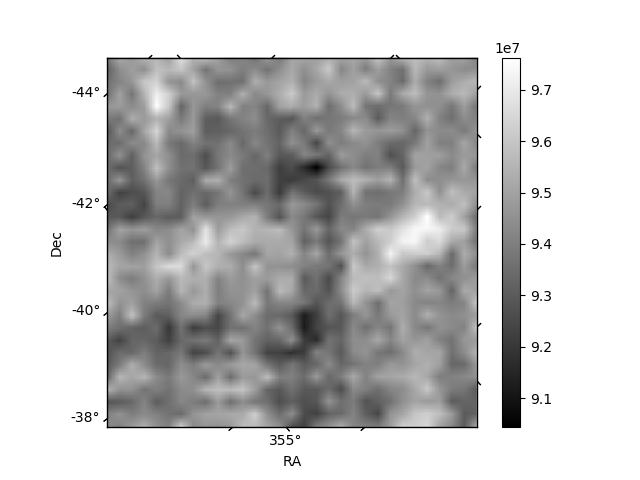
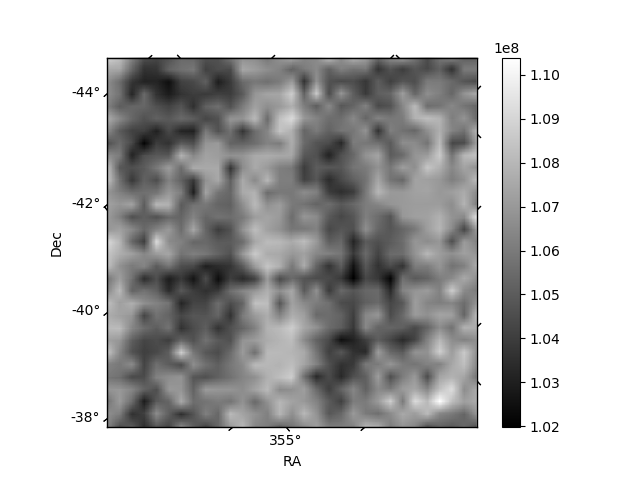
Histogram calculated using DETX and DETY for each event in the final _common_clean file
| Quadrant A | 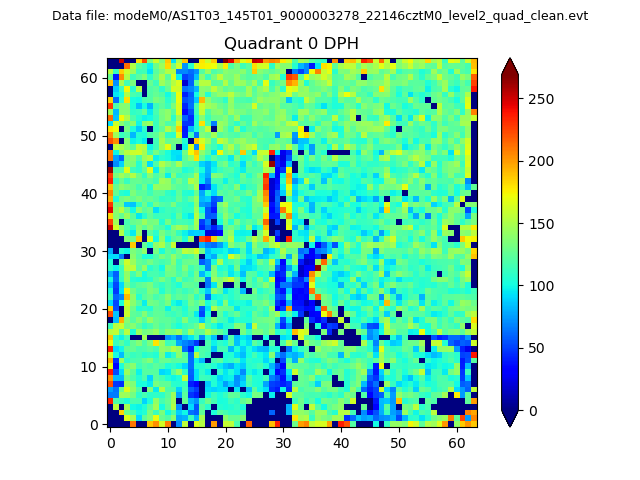 |
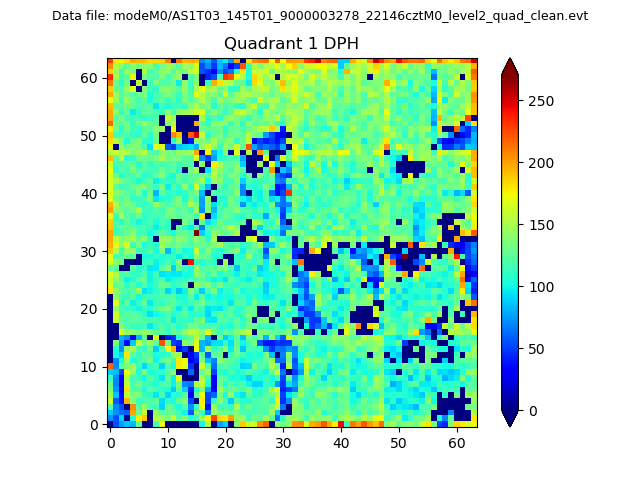 |
Quadrant B |
|---|---|---|---|
| Quadrant D | 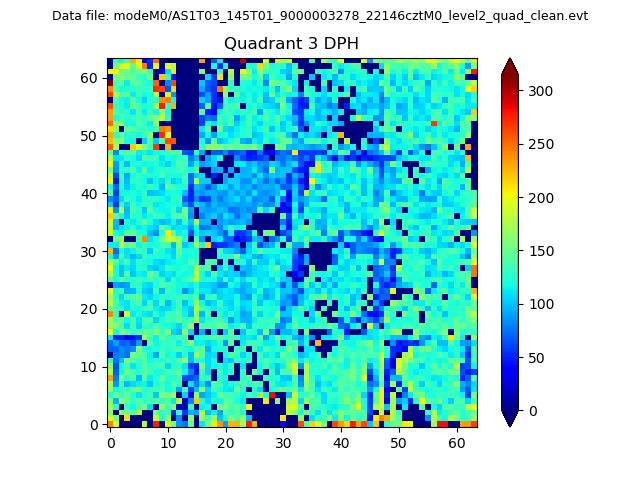 |
 |
Quadrant C |
| Plot type | Count rate plots | Images |
|---|---|---|
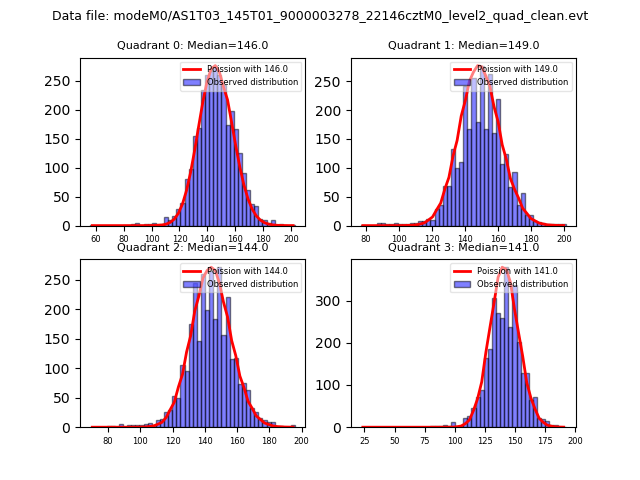
| Comparison with Poisson distribution Blue bars denote a histogram of data divided into 1 sec bins. Red curve is a Poisson curve with rate = median count rate of data. |
 |
 |
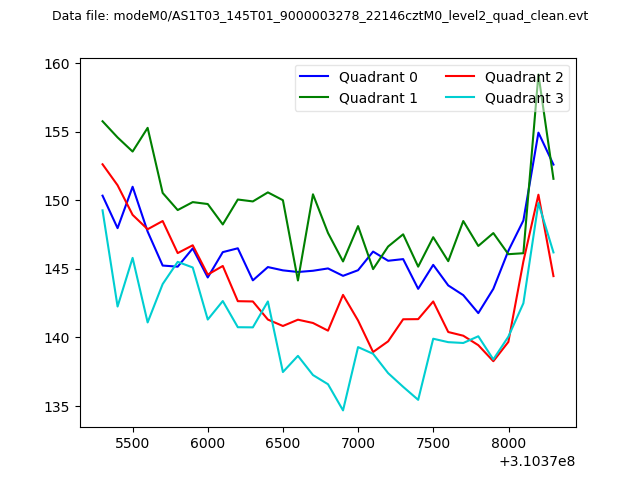
| Quadrant-wise count rates Data is divided into 100 sec bins |
 |
|
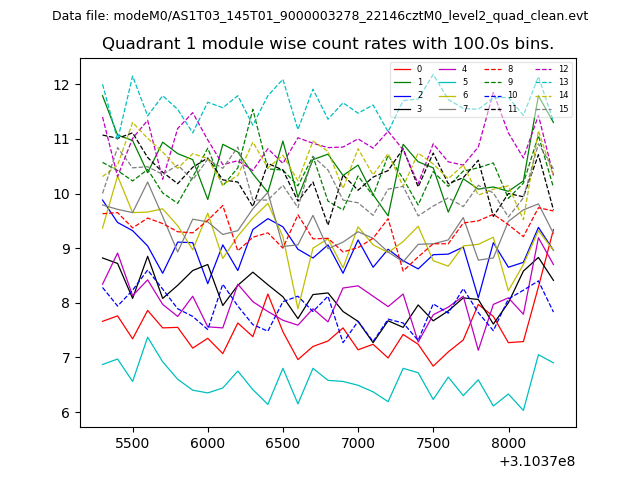
| Module-wise count rates for Quadrant A Data is divided into 100 sec bins |
 |
 |
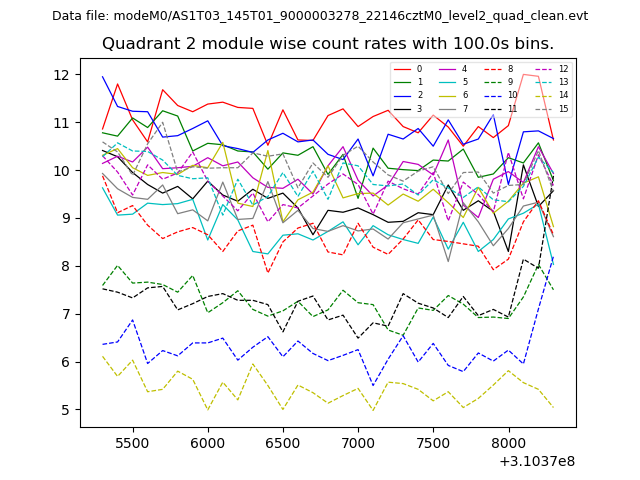
| Module-wise count rates for Quadrant B Data is divided into 100 sec bins |
 |
 |
| Module-wise count rates for Quadrant C Data is divided into 100 sec bins |
 |
 |
| Module-wise count rates for Quadrant D Data is divided into 100 sec bins |
 |
 |
| Parameter | Plot |
|---|---|
| CZT HV Monitor | 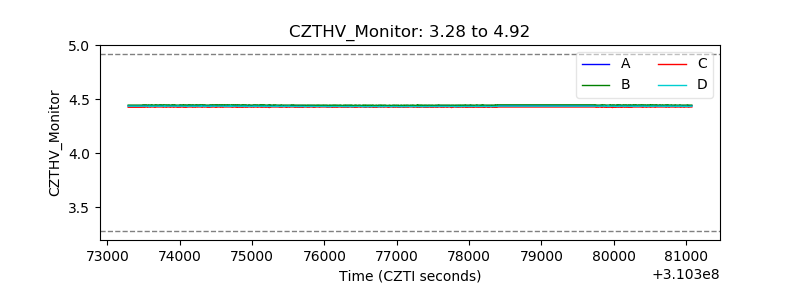 |
| D_VDD | 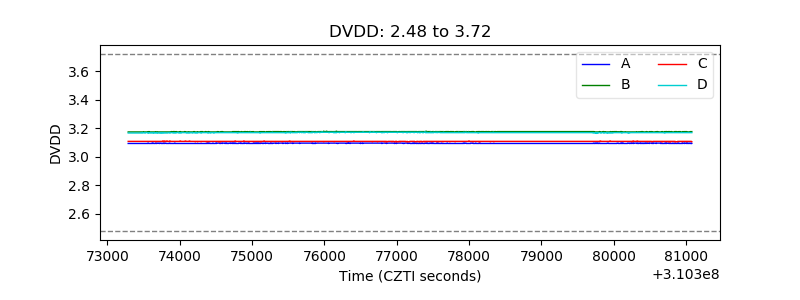 |
| Temperature 1 | 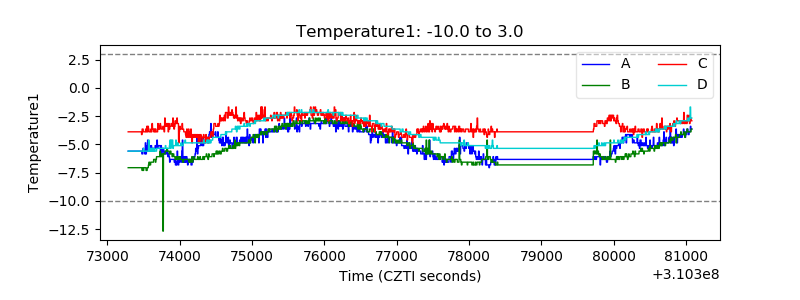 |
| Veto HV Monitor |  |
| Veto LLD | 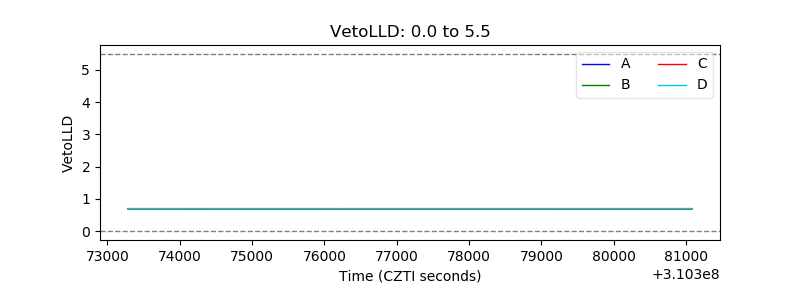 |
| Alpha Counter | 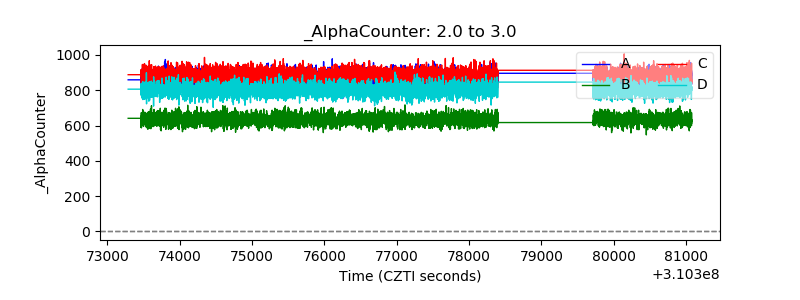 |
| _CPM_Rate | 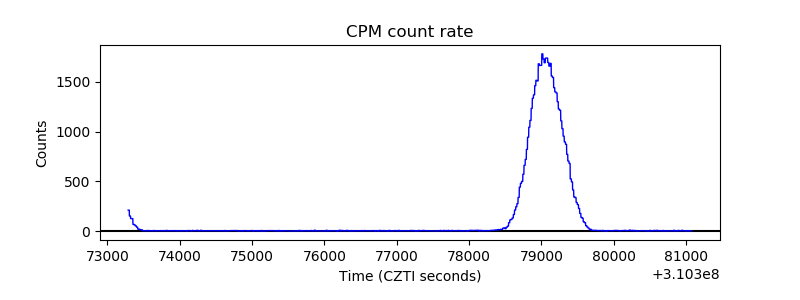 |
| CZT Counter | 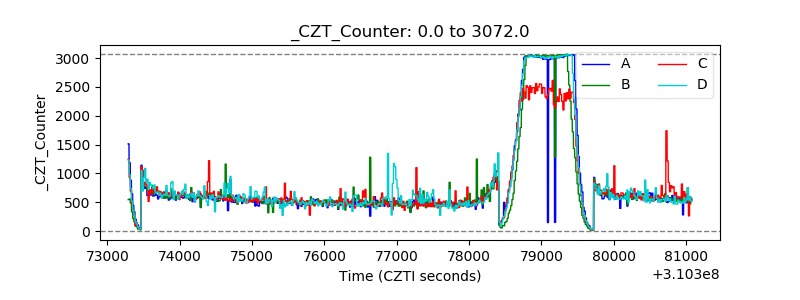 |
| +2.5 Volts monitor |  |
| +5 Volts monitor |  |
| _ROLL_ROT |  |
| _Roll_DEC | 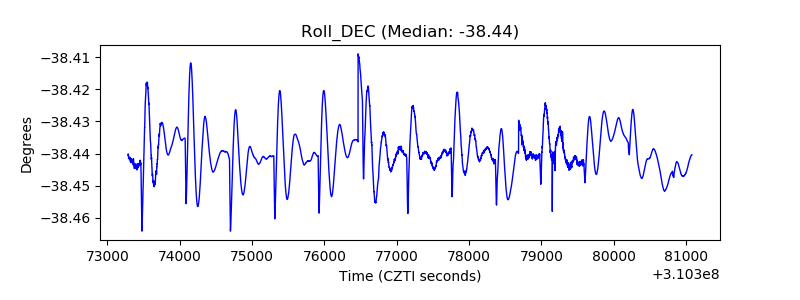 |
| _Roll_RA | 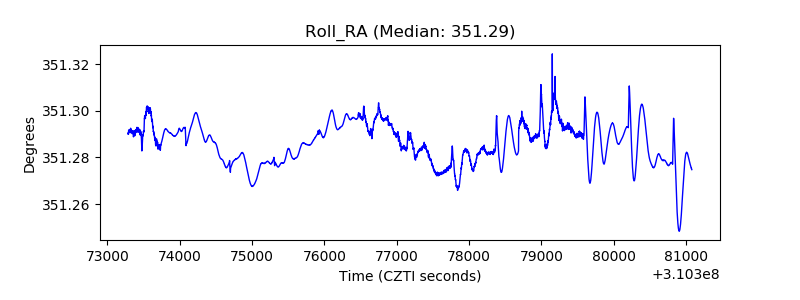 |
| Veto Counter | 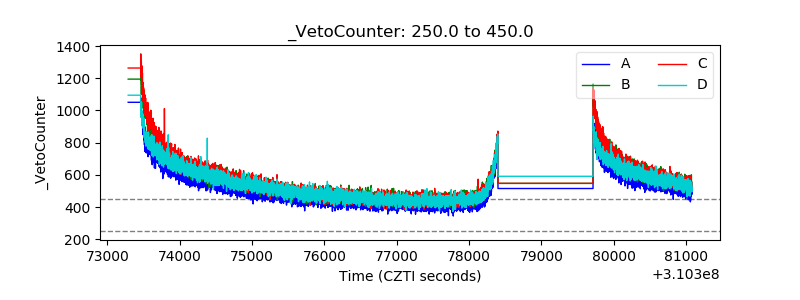 |