| Param | Original file | Final file |
|---|---|---|
| Filename | modeM0/AS1T03_145T01_9000003278_22148cztM0_level2.evt | modeM0/AS1T03_145T01_9000003278_22148cztM0_level2_quad_clean.evt |
| Size (bytes) | 466,248,960 | 97,142,400 |
| Size | 444.6 MB | 92.6 MB |
| Events in quadrant A | 3,363,725 | 628,813 |
| Events in quadrant B | 3,453,425 | 637,389 |
| Events in quadrant C | 3,470,728 | 608,512 |
| Events in quadrant D | 3,381,183 | 604,305 |
| Mode M0 | |||
|---|---|---|---|
| Quadrant | BADHDUFLAG | Total packets | Discarded packets |
| A | 0 | 13985 | 2 |
| B | 0 | 14277 | 2 |
| C | 0 | 14418 | 2 |
| D | 0 | 14201 | 2 |
| Mode SS | |||
|---|---|---|---|
| Quadrant | BADHDUFLAG | Total packets | Discarded packets |
| A | 0 | 136 | 0 |
| B | 0 | 136 | 0 |
| C | 0 | 136 | 0 |
| D | 0 | 136 | 0 |
| Mode M9 | |||
|---|---|---|---|
| Quadrant | BADHDUFLAG | Total packets | Discarded packets |
| A | 0 | 19 | 0 |
| B | 0 | 20 | 0 |
| C | 0 | 20 | 0 |
| D | 0 | 20 | 0 |
| Quadrant | Total seconds | Saturated seconds | Saturation percentage |
|---|---|---|---|
| A | 6634 | 129 | 1.944528% |
| B | 6634 | 167 | 2.517335% |
| C | 6634 | 230 | 3.466988% |
| D | 6634 | 128 | 1.929454% |
Noise dominated data is calculated using 1-second bins in cleaned event files. If a bin has >2000 counts, and if more than 50% of those come from <1% of pixels, then it is considered to be noise-dominated and hence unusable.
| Quadrant | # 1 sec bins | Bins with >0 counts | Bins with >2000 counts | High rate bins dominated by noise | Noise dominated (total time) | Noise dominated (detector-on time) | Marked lightcurve |
|---|---|---|---|---|---|---|---|
| A | 7659 | 6635 | 0 | 0 | 0.00% | 0.00% | 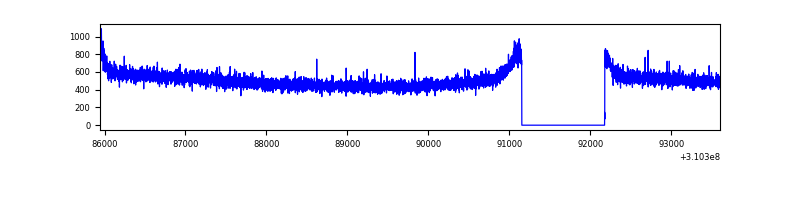 |
| B | 7659 | 6635 | 3 | 3 | 0.04% | 0.05% | 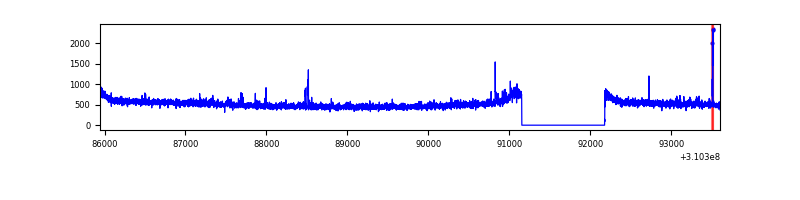 |
| C | 7659 | 6635 | 13 | 13 | 0.17% | 0.20% | 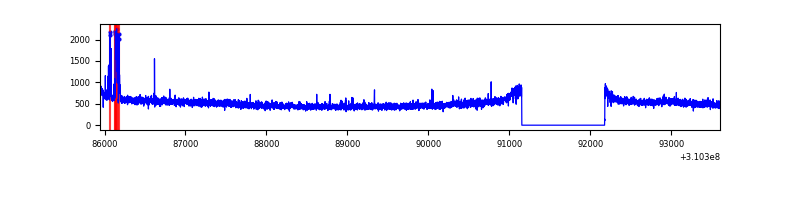 |
| D | 7659 | 6635 | 5 | 5 | 0.07% | 0.08% | 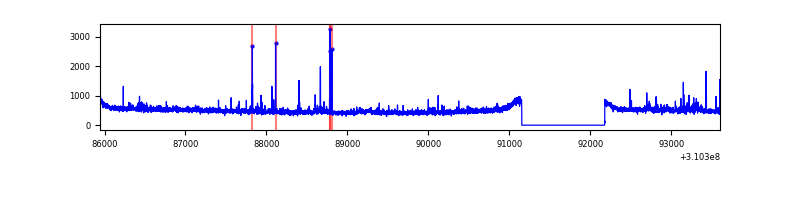 |
Top three noisy pixels from each quadrant. If the there are fewer than three noisy pixels in the level2.evt file, extra rows are filled as -1
| Pixel properties | Quadrant properties | ||||||
|---|---|---|---|---|---|---|---|
| Quadrant | DetID | PixID | Counts | Sigma | Mean | Median | Sigma |
| A | 13 | 254 | 10389 | 54.9 | 872 | 856 | 173.6 |
| A | 0 | 226 | 7507 | 38.31 | 872 | 856 | 173.6 |
| A | 3 | 137 | 7313 | 37.19 | 872 | 856 | 173.6 |
| B | 3 | 64 | 33183 | 196.6 | 866 | 843 | 164.5 |
| B | 12 | 111 | 19572 | 113.86 | 866 | 843 | 164.5 |
| B | 11 | 111 | 17693 | 102.43 | 866 | 843 | 164.5 |
| C | 14 | 238 | 133754 | 697.24 | 829 | 835 | 190.6 |
| C | 10 | 22 | 99414 | 517.11 | 829 | 835 | 190.6 |
| C | 13 | 61 | 5840 | 26.25 | 829 | 835 | 190.6 |
| D | 1 | 52 | 83391 | 404.8 | 850 | 827 | 204.0 |
| D | 2 | 234 | 29537 | 140.76 | 850 | 827 | 204.0 |
| D | 2 | 120 | 26081 | 123.82 | 850 | 827 | 204.0 |
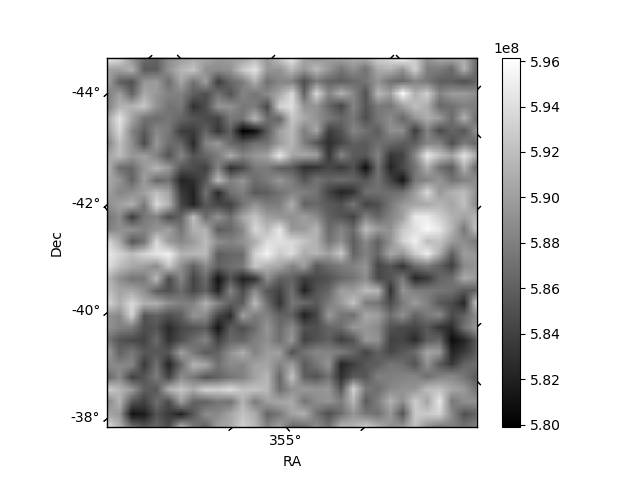
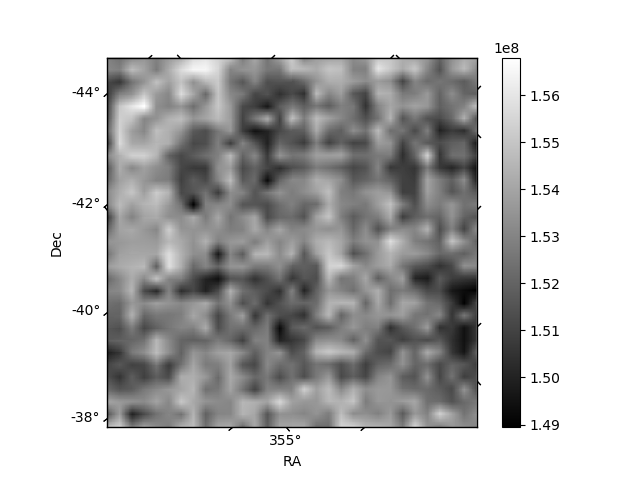
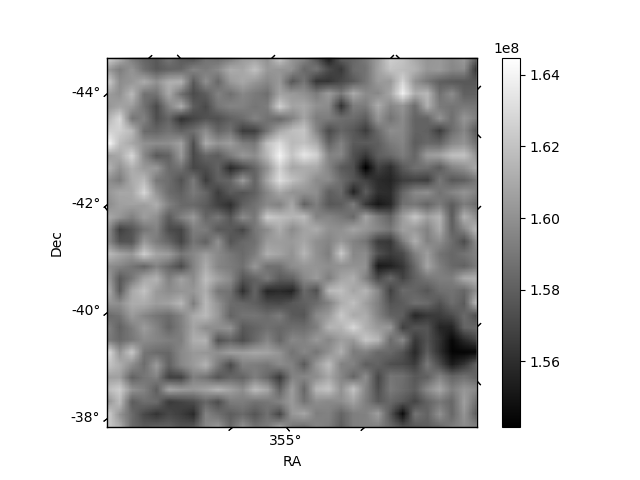
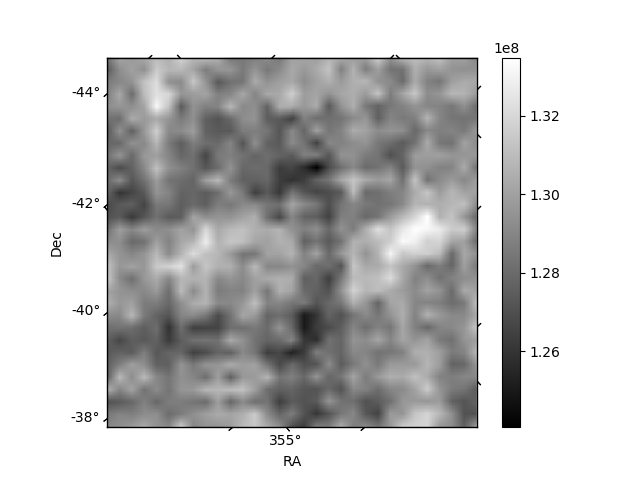
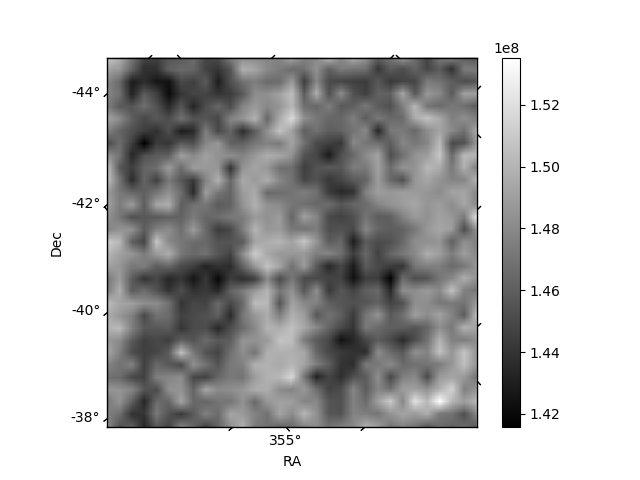
Histogram calculated using DETX and DETY for each event in the final _common_clean file
| Quadrant A | 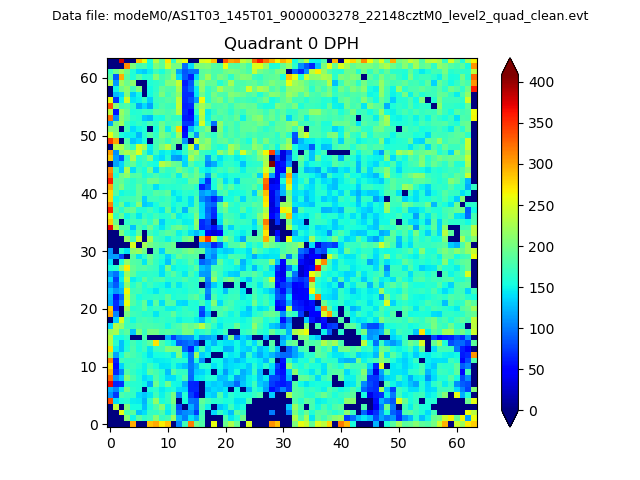 |
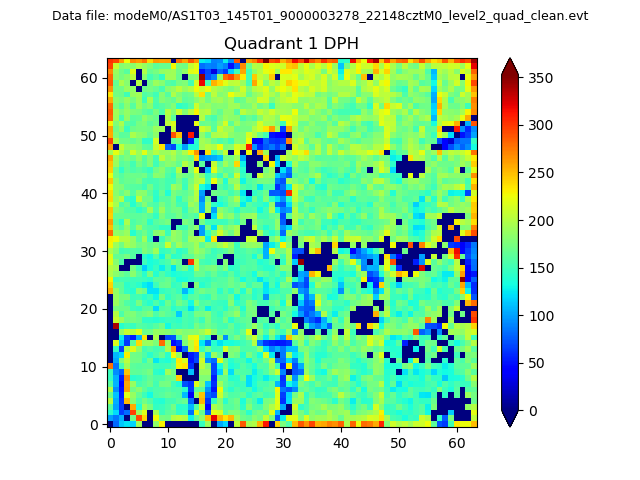 |
Quadrant B |
|---|---|---|---|
| Quadrant D | 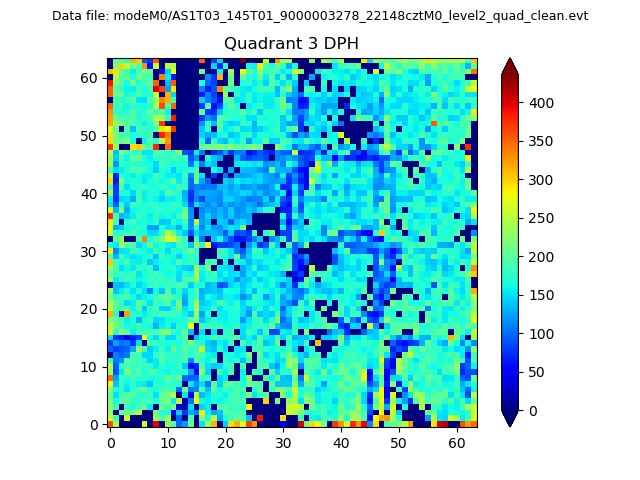 |
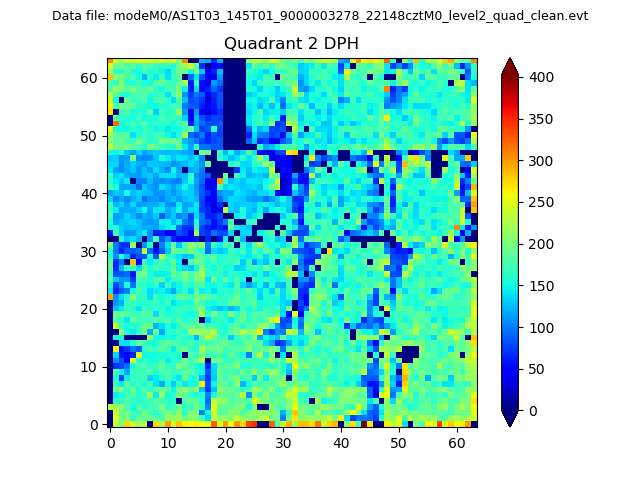 |
Quadrant C |
| Plot type | Count rate plots | Images |
|---|---|---|
| Comparison with Poisson distribution Blue bars denote a histogram of data divided into 1 sec bins. Red curve is a Poisson curve with rate = median count rate of data. |
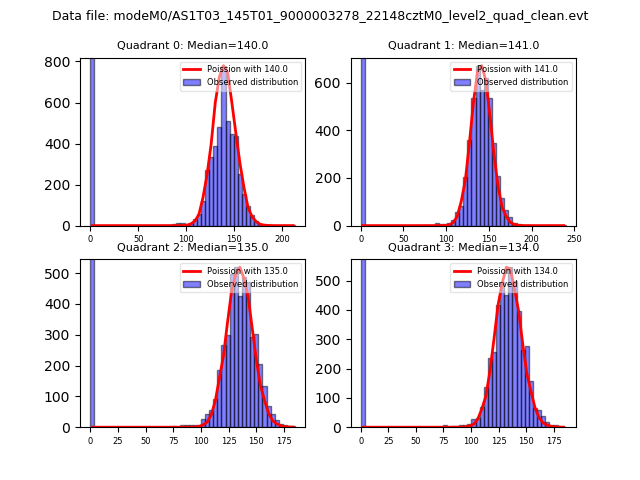 |
 |
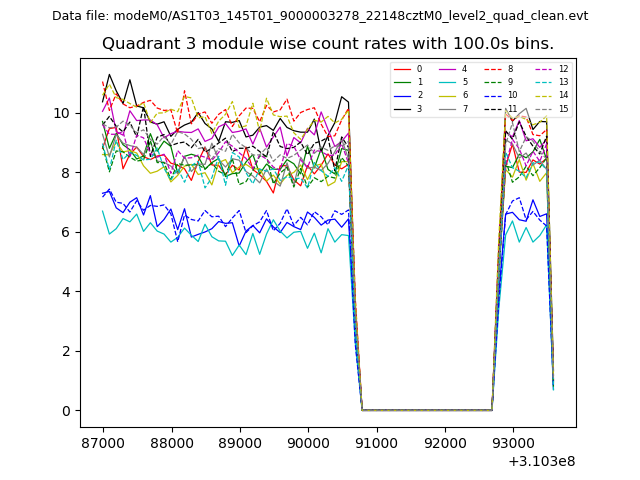
| Quadrant-wise count rates Data is divided into 100 sec bins |
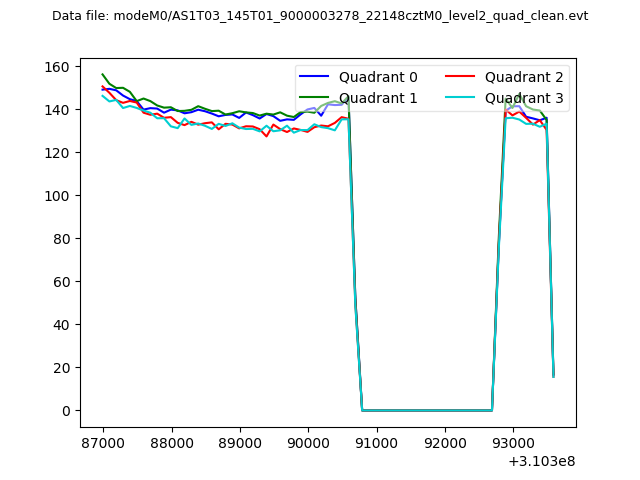 |
|
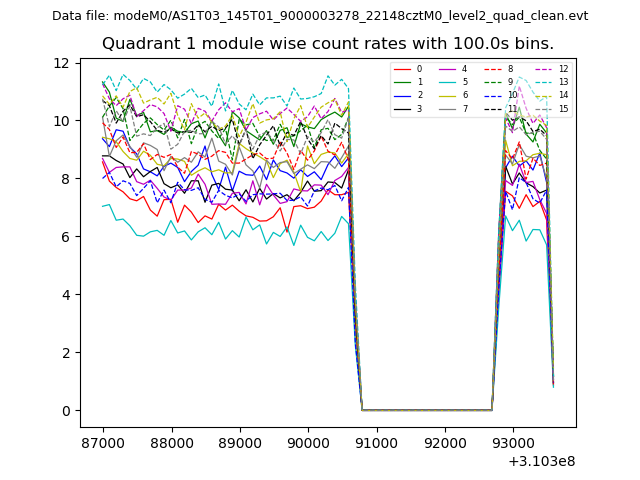
| Module-wise count rates for Quadrant A Data is divided into 100 sec bins |
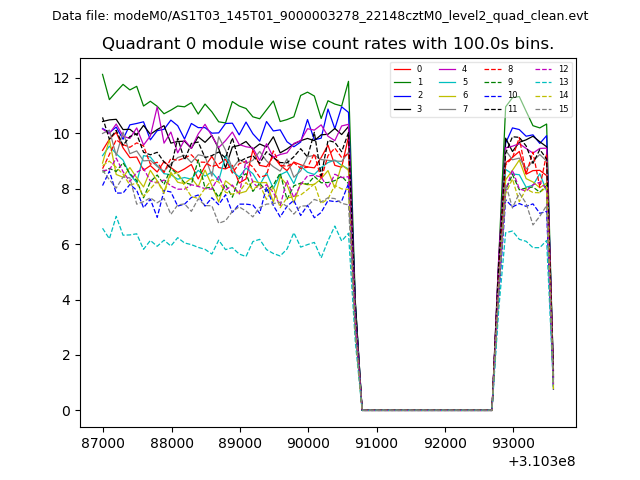 |
 |
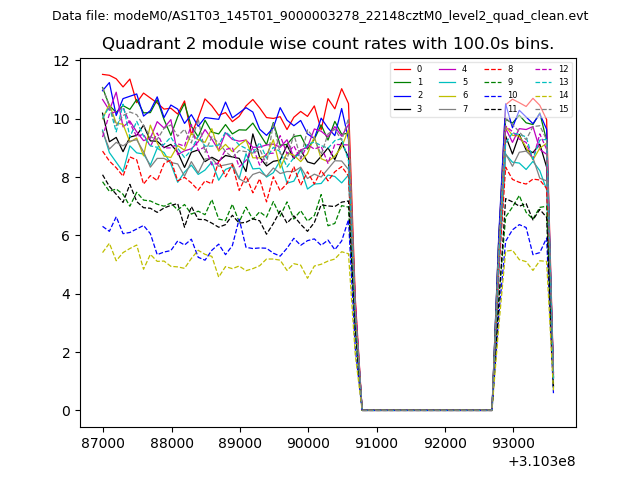
| Module-wise count rates for Quadrant B Data is divided into 100 sec bins |
 |
 |
| Module-wise count rates for Quadrant C Data is divided into 100 sec bins |
 |
 |
| Module-wise count rates for Quadrant D Data is divided into 100 sec bins |
 |
 |
| Parameter | Plot |
|---|---|
| CZT HV Monitor | 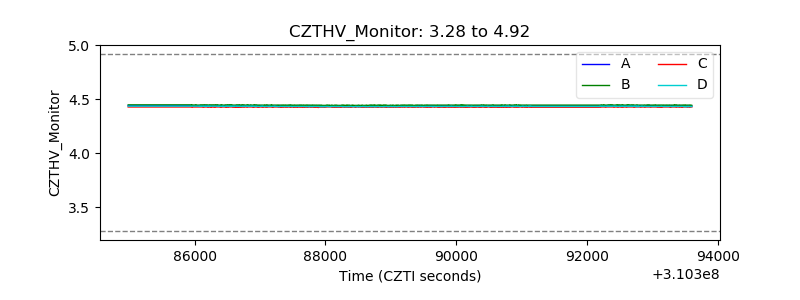 |
| D_VDD | 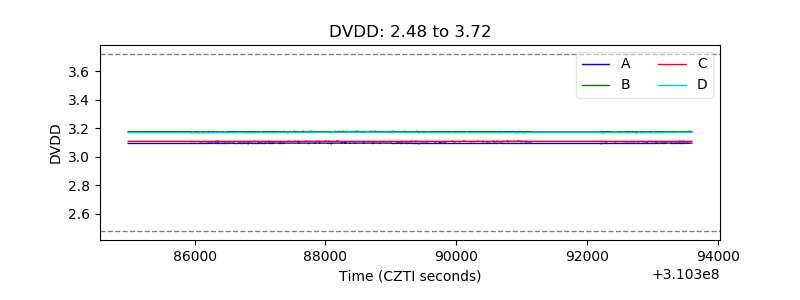 |
| Temperature 1 | 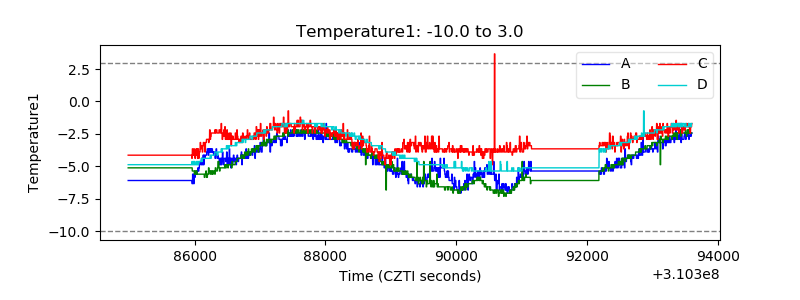 |
| Veto HV Monitor | 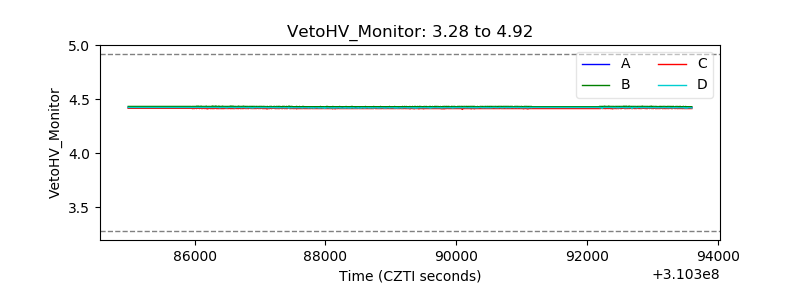 |
| Veto LLD |  |
| Alpha Counter | 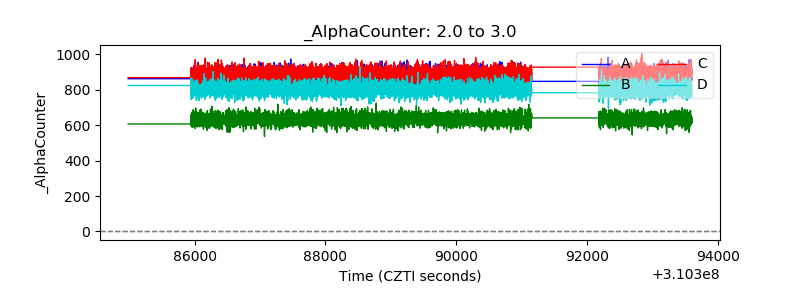 |
| _CPM_Rate | 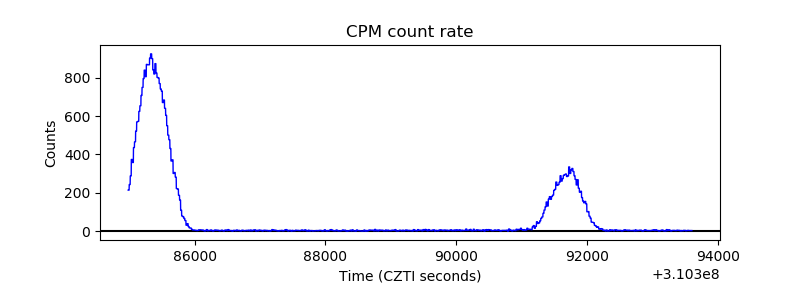 |
| CZT Counter | 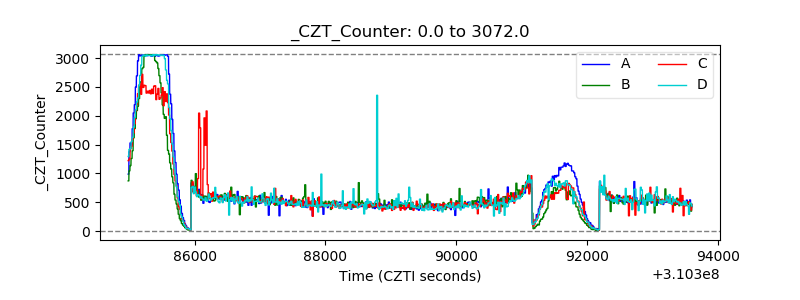 |
| +2.5 Volts monitor |  |
| +5 Volts monitor |  |
| _ROLL_ROT |  |
| _Roll_DEC | 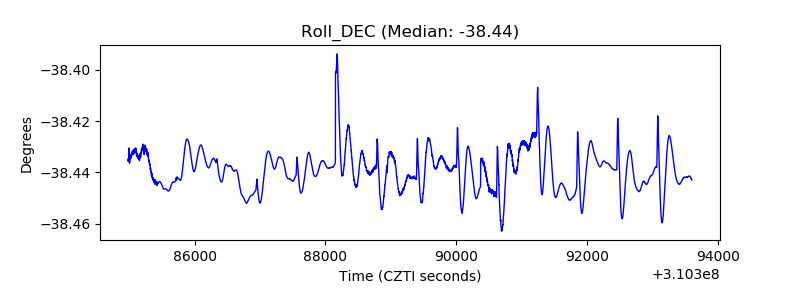 |
| _Roll_RA | 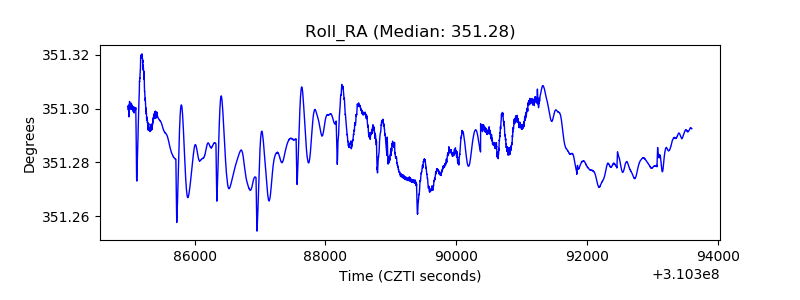 |
| Veto Counter | 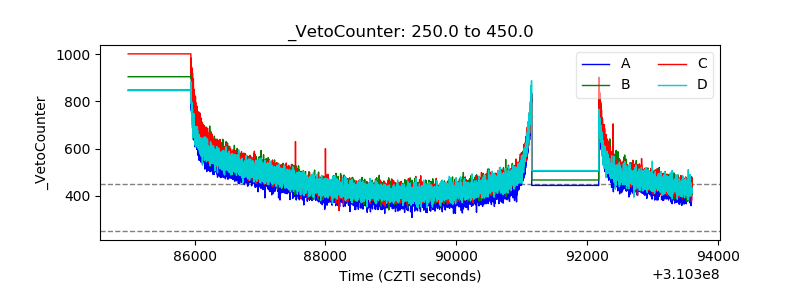 |