| Param | Original file | Final file |
|---|---|---|
| Filename | modeM0/AS1T03_145T01_9000003278_22149cztM0_level2.evt | modeM0/AS1T03_145T01_9000003278_22149cztM0_level2_quad_clean.evt |
| Size (bytes) | 454,190,400 | 99,293,760 |
| Size | 433.1 MB | 94.7 MB |
| Events in quadrant A | 3,174,581 | 645,061 |
| Events in quadrant B | 3,423,054 | 655,187 |
| Events in quadrant C | 3,494,799 | 621,339 |
| Events in quadrant D | 3,211,082 | 622,338 |
| Mode M0 | |||
|---|---|---|---|
| Quadrant | BADHDUFLAG | Total packets | Discarded packets |
| A | 0 | 13634 | 1 |
| B | 0 | 14380 | 1 |
| C | 0 | 14606 | 1 |
| D | 0 | 13917 | 1 |
| Mode SS | |||
|---|---|---|---|
| Quadrant | BADHDUFLAG | Total packets | Discarded packets |
| A | 0 | 136 | 0 |
| B | 0 | 136 | 0 |
| C | 0 | 136 | 0 |
| D | 0 | 136 | 0 |
| Mode M9 | |||
|---|---|---|---|
| Quadrant | BADHDUFLAG | Total packets | Discarded packets |
| A | 0 | 7 | 0 |
| B | 0 | 7 | 0 |
| C | 0 | 7 | 0 |
| D | 0 | 7 | 0 |
| Quadrant | Total seconds | Saturated seconds | Saturation percentage |
|---|---|---|---|
| A | 6639 | 72 | 1.084501% |
| B | 6640 | 117 | 1.762048% |
| C | 6640 | 197 | 2.966867% |
| D | 6640 | 55 | 0.828313% |
Noise dominated data is calculated using 1-second bins in cleaned event files. If a bin has >2000 counts, and if more than 50% of those come from <1% of pixels, then it is considered to be noise-dominated and hence unusable.
| Quadrant | # 1 sec bins | Bins with >0 counts | Bins with >2000 counts | High rate bins dominated by noise | Noise dominated (total time) | Noise dominated (detector-on time) | Marked lightcurve |
|---|---|---|---|---|---|---|---|
| A | 7374 | 6640 | 0 | 0 | 0.00% | 0.00% | 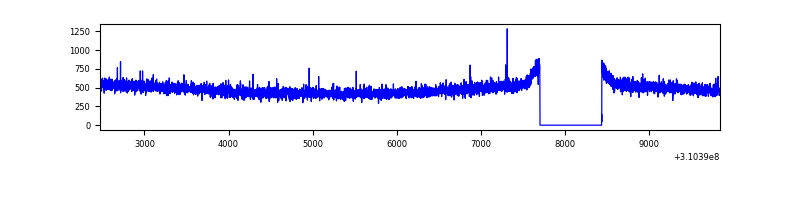 |
| B | 7375 | 6641 | 6 | 6 | 0.08% | 0.09% | 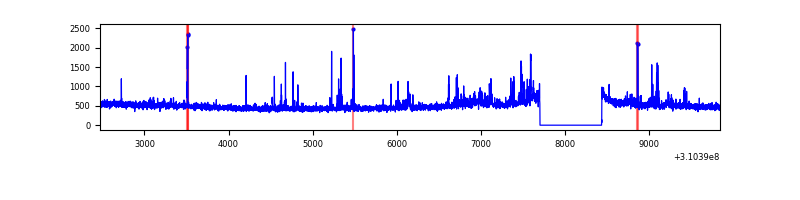 |
| C | 7375 | 6641 | 76 | 76 | 1.03% | 1.14% | 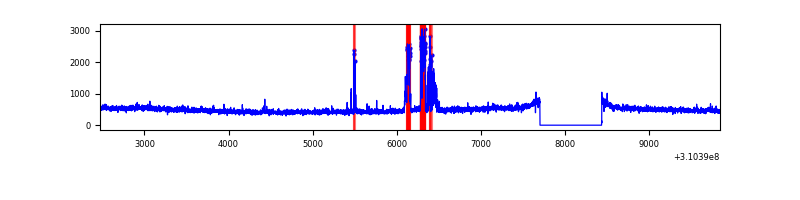 |
| D | 7375 | 6641 | 3 | 3 | 0.04% | 0.05% | 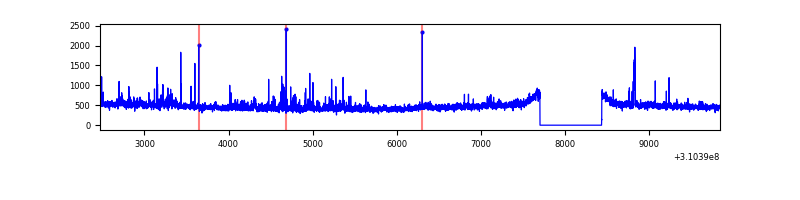 |
Top three noisy pixels from each quadrant. If the there are fewer than three noisy pixels in the level2.evt file, extra rows are filled as -1
| Pixel properties | Quadrant properties | ||||||
|---|---|---|---|---|---|---|---|
| Quadrant | DetID | PixID | Counts | Sigma | Mean | Median | Sigma |
| A | 13 | 254 | 10513 | 59.24 | 822 | 805 | 163.9 |
| A | 3 | 137 | 7058 | 38.16 | 822 | 805 | 163.9 |
| A | 0 | 226 | 7007 | 37.85 | 822 | 805 | 163.9 |
| B | 3 | 64 | 146965 | 937.26 | 816 | 795 | 156.0 |
| B | 10 | 246 | 61695 | 390.5 | 816 | 795 | 156.0 |
| B | 12 | 111 | 19135 | 117.6 | 816 | 795 | 156.0 |
| C | 10 | 22 | 327584 | 1790.68 | 781 | 787 | 182.5 |
| C | 14 | 238 | 124227 | 676.39 | 781 | 787 | 182.5 |
| C | 13 | 61 | 5306 | 24.76 | 781 | 787 | 182.5 |
| D | 1 | 52 | 132146 | 682.63 | 800 | 778 | 192.4 |
| D | 2 | 234 | 30119 | 152.46 | 800 | 778 | 192.4 |
| D | 7 | 222 | 20573 | 102.86 | 800 | 778 | 192.4 |
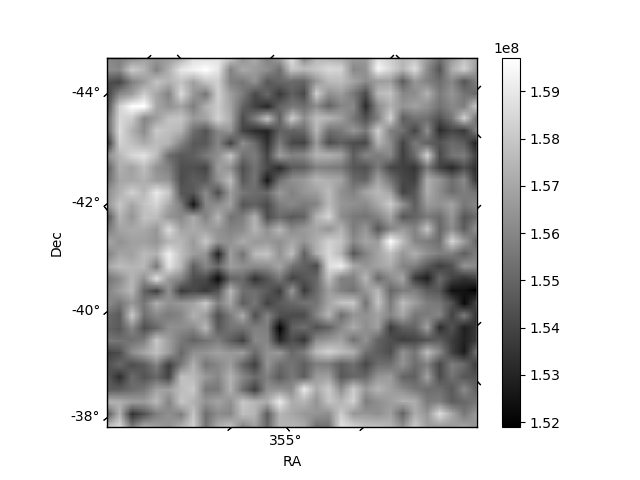
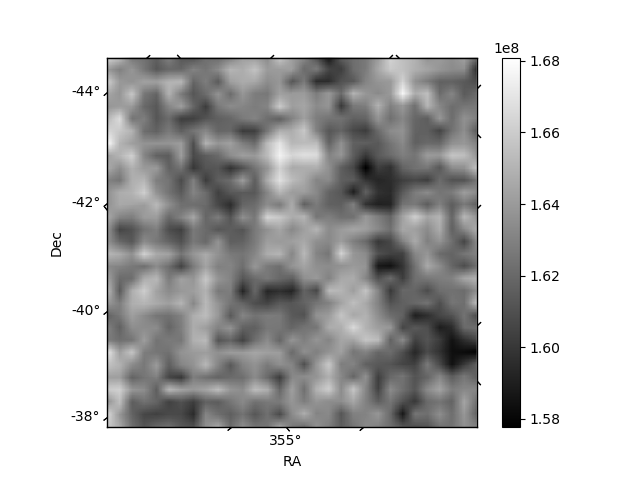
Histogram calculated using DETX and DETY for each event in the final _common_clean file
| Quadrant A | 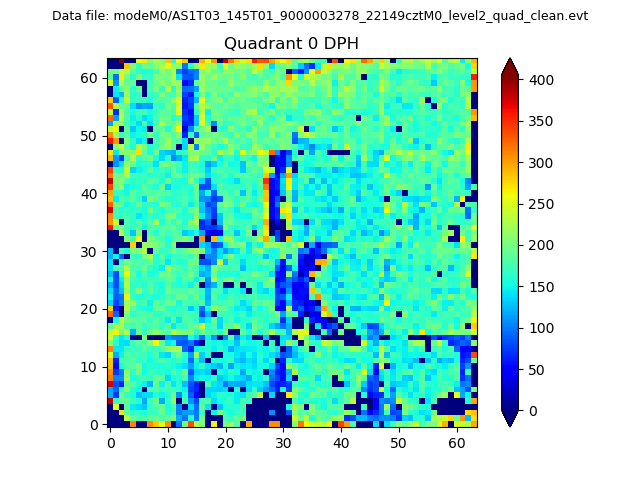 |
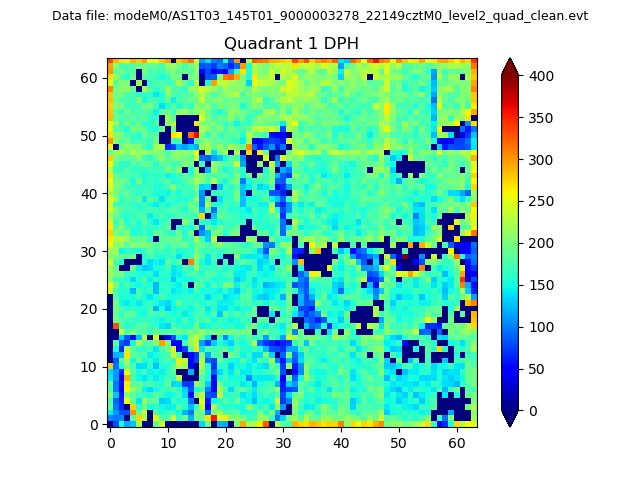 |
Quadrant B |
|---|---|---|---|
| Quadrant D | 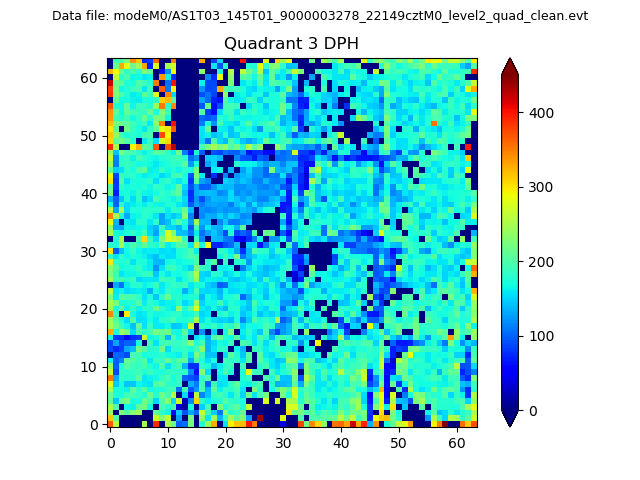 |
 |
Quadrant C |
| Plot type | Count rate plots | Images |
|---|---|---|
| Comparison with Poisson distribution Blue bars denote a histogram of data divided into 1 sec bins. Red curve is a Poisson curve with rate = median count rate of data. |
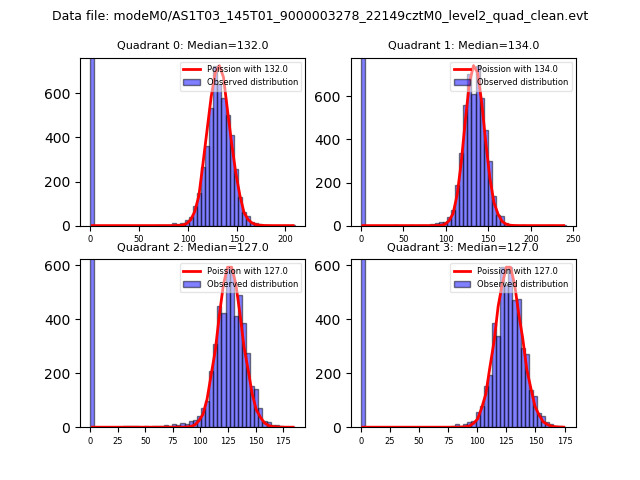 |
 |
| Quadrant-wise count rates Data is divided into 100 sec bins |
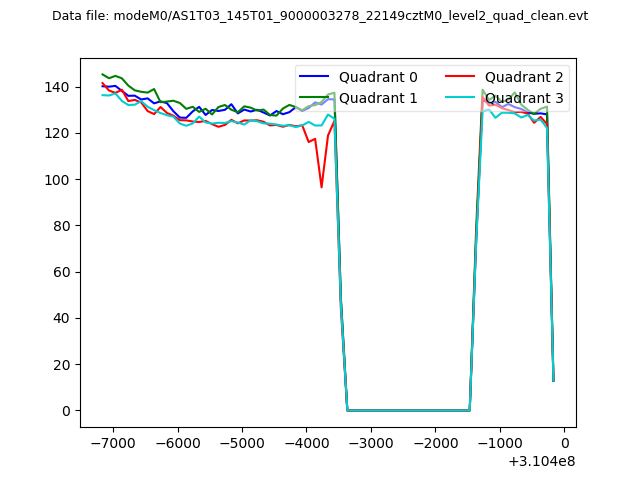 |
|
| Module-wise count rates for Quadrant A Data is divided into 100 sec bins |
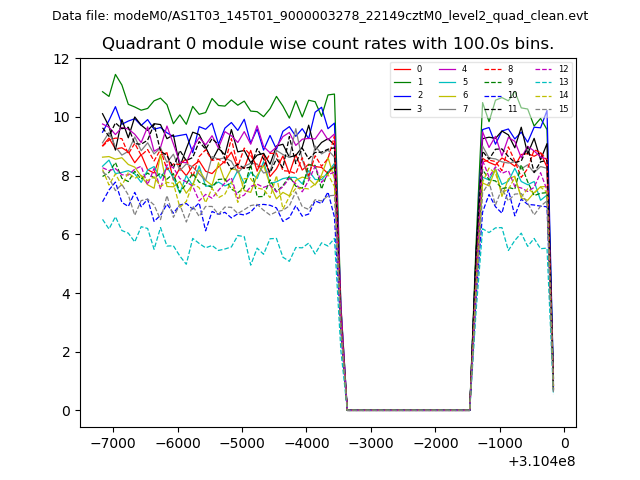 |
 |
| Module-wise count rates for Quadrant B Data is divided into 100 sec bins |
 |
 |
| Module-wise count rates for Quadrant C Data is divided into 100 sec bins |
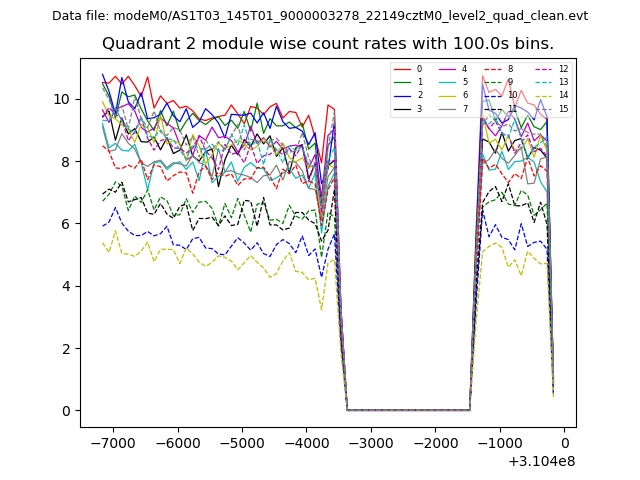 |
 |
| Module-wise count rates for Quadrant D Data is divided into 100 sec bins |
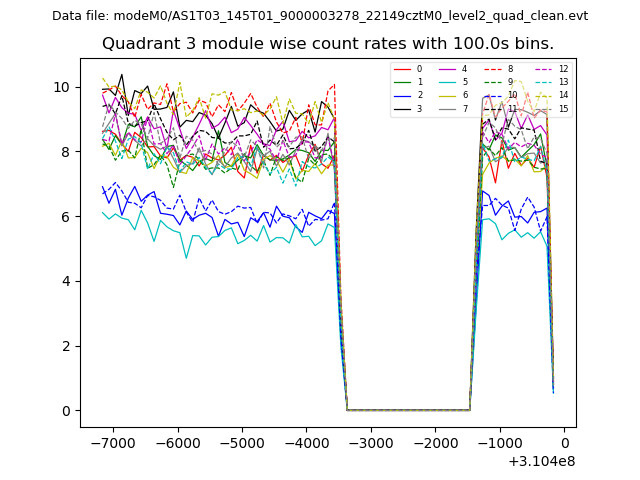 |
 |
| Parameter | Plot |
|---|---|
| CZT HV Monitor | 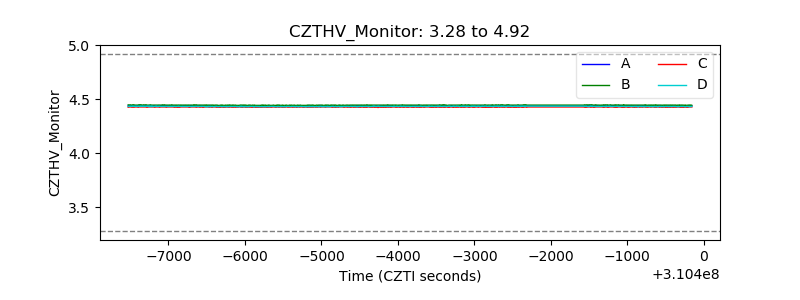 |
| D_VDD | 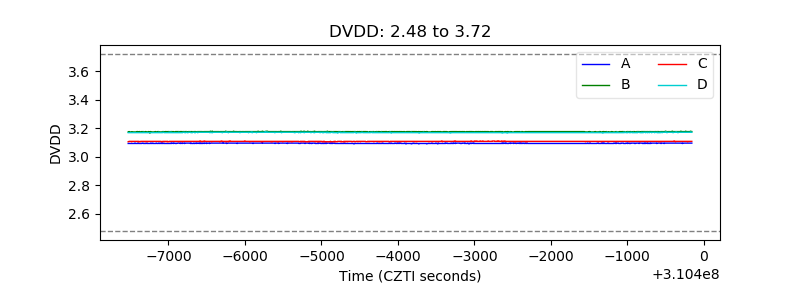 |
| Temperature 1 | 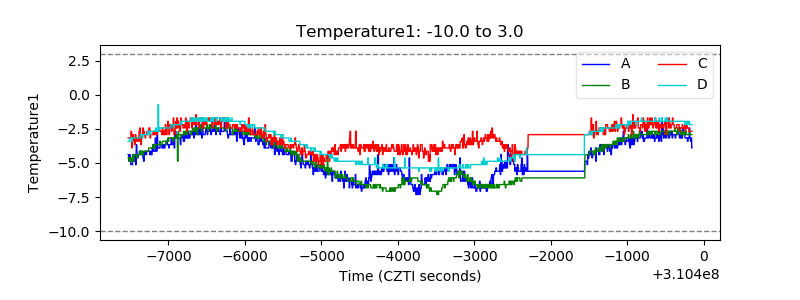 |
| Veto HV Monitor | 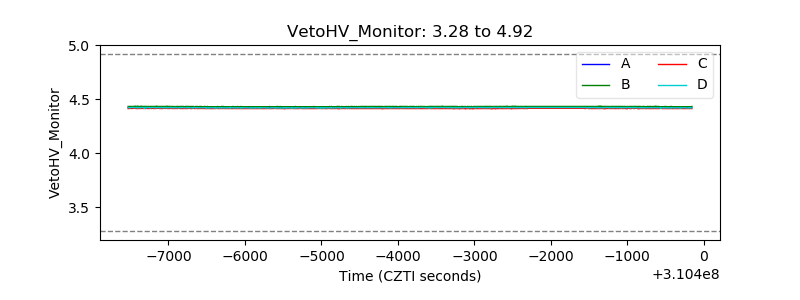 |
| Veto LLD | 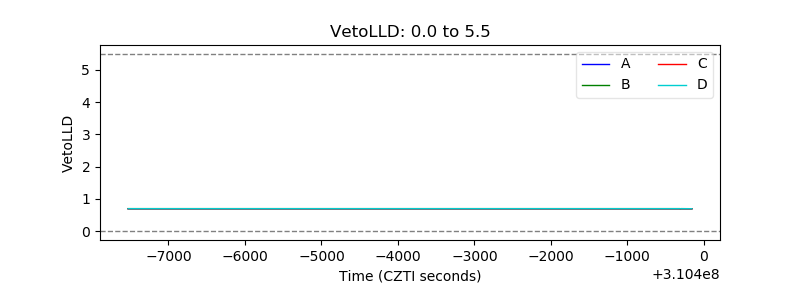 |
| Alpha Counter | 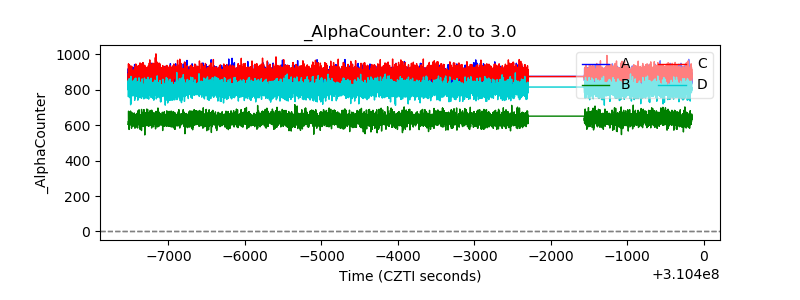 |
| _CPM_Rate | 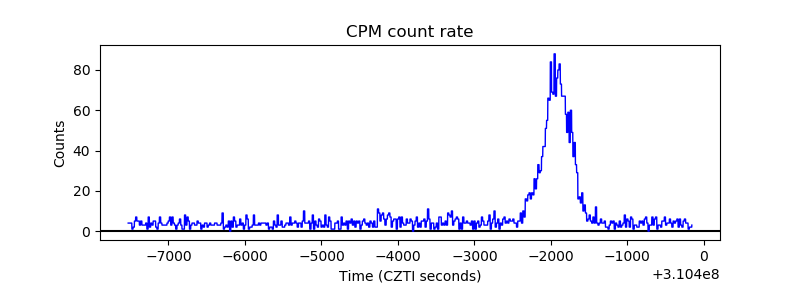 |
| CZT Counter |  |
| +2.5 Volts monitor |  |
| +5 Volts monitor |  |
| _ROLL_ROT | 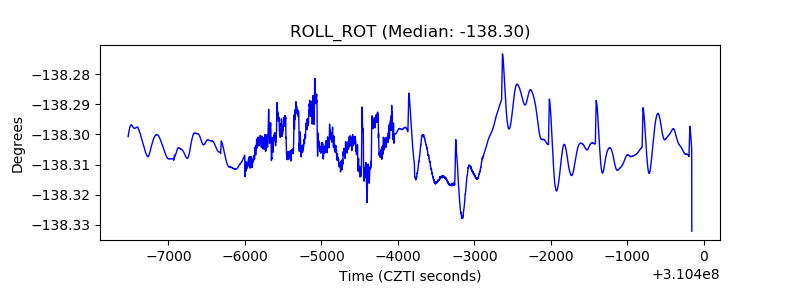 |
| _Roll_DEC |  |
| _Roll_RA | 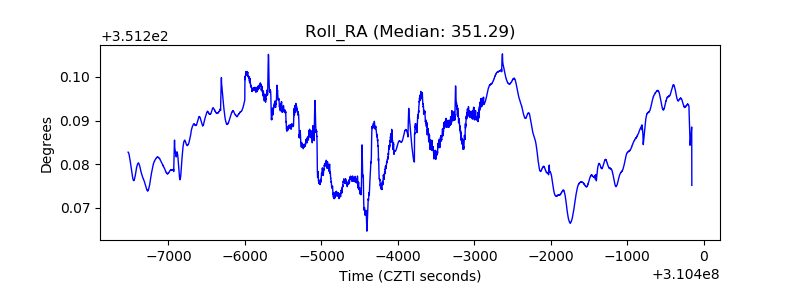 |
| Veto Counter | 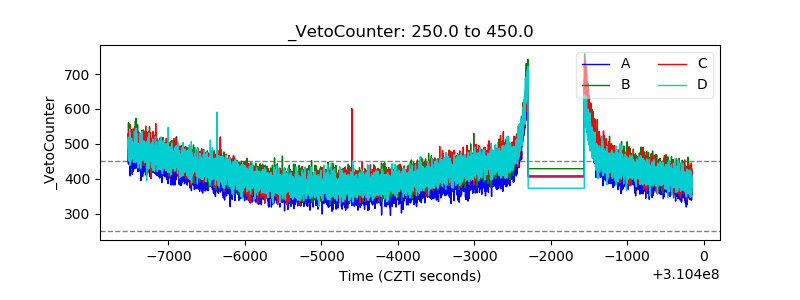 |