| Param | Original file | Final file |
|---|---|---|
| Filename | modeM0/AS1T03_145T01_9000003278_22150cztM0_level2.evt | modeM0/AS1T03_145T01_9000003278_22150cztM0_level2_quad_clean.evt |
| Size (bytes) | 447,981,120 | 98,858,880 |
| Size | 427.2 MB | 94.3 MB |
| Events in quadrant A | 3,235,305 | 637,915 |
| Events in quadrant B | 3,342,429 | 645,141 |
| Events in quadrant C | 3,245,277 | 616,844 |
| Events in quadrant D | 3,274,686 | 612,958 |
| Mode M0 | |||
|---|---|---|---|
| Quadrant | BADHDUFLAG | Total packets | Discarded packets |
| A | 0 | 14177 | 1 |
| B | 0 | 14437 | 1 |
| C | 0 | 14259 | 2 |
| D | 0 | 14469 | 1 |
| Mode SS | |||
|---|---|---|---|
| Quadrant | BADHDUFLAG | Total packets | Discarded packets |
| A | 0 | 140 | 0 |
| B | 0 | 140 | 0 |
| C | 0 | 140 | 0 |
| D | 0 | 140 | 0 |
| Mode M9 | |||
|---|---|---|---|
| Quadrant | BADHDUFLAG | Total packets | Discarded packets |
| A | 0 | 4 | 0 |
| B | 0 | 4 | 0 |
| C | 0 | 4 | 0 |
| D | 0 | 4 | 0 |
| Quadrant | Total seconds | Saturated seconds | Saturation percentage |
|---|---|---|---|
| A | 6904 | 78 | 1.129780% |
| B | 6905 | 98 | 1.419261% |
| C | 6904 | 104 | 1.506373% |
| D | 6904 | 50 | 0.724218% |
Noise dominated data is calculated using 1-second bins in cleaned event files. If a bin has >2000 counts, and if more than 50% of those come from <1% of pixels, then it is considered to be noise-dominated and hence unusable.
| Quadrant | # 1 sec bins | Bins with >0 counts | Bins with >2000 counts | High rate bins dominated by noise | Noise dominated (total time) | Noise dominated (detector-on time) | Marked lightcurve |
|---|---|---|---|---|---|---|---|
| A | 7284 | 6905 | 0 | 0 | 0.00% | 0.00% | 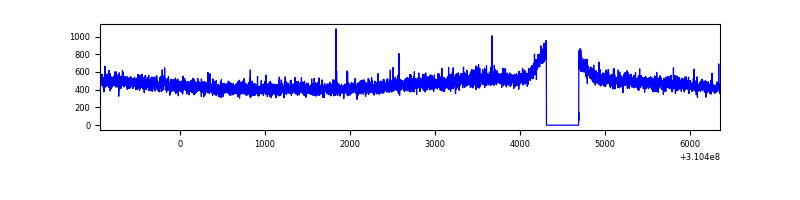 |
| B | 7285 | 6906 | 3 | 3 | 0.04% | 0.04% | 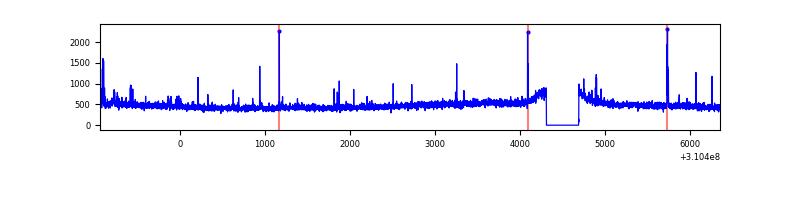 |
| C | 7284 | 6905 | 0 | 0 | 0.00% | 0.00% | 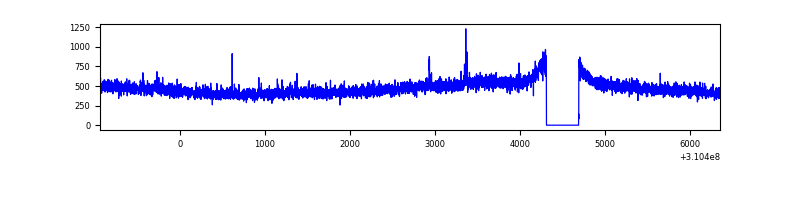 |
| D | 7284 | 6905 | 7 | 7 | 0.10% | 0.10% | 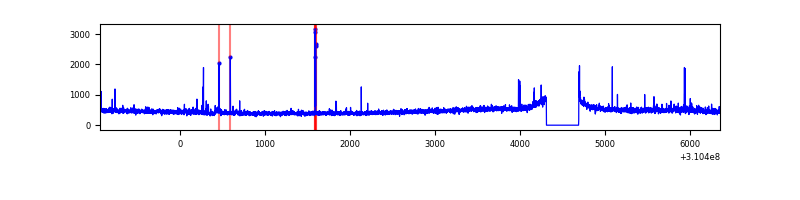 |
Top three noisy pixels from each quadrant. If the there are fewer than three noisy pixels in the level2.evt file, extra rows are filled as -1
| Pixel properties | Quadrant properties | ||||||
|---|---|---|---|---|---|---|---|
| Quadrant | DetID | PixID | Counts | Sigma | Mean | Median | Sigma |
| A | 13 | 254 | 10384 | 56.41 | 839 | 821 | 169.5 |
| A | 3 | 137 | 7266 | 38.02 | 839 | 821 | 169.5 |
| A | 0 | 226 | 7108 | 37.09 | 839 | 821 | 169.5 |
| B | 10 | 246 | 55531 | 342.3 | 832 | 812 | 159.9 |
| B | 12 | 111 | 20127 | 120.83 | 832 | 812 | 159.9 |
| B | 11 | 111 | 17735 | 105.86 | 832 | 812 | 159.9 |
| C | 14 | 238 | 125542 | 667.77 | 796 | 801 | 186.8 |
| C | 10 | 22 | 15353 | 77.9 | 796 | 801 | 186.8 |
| C | 13 | 61 | 5535 | 25.34 | 796 | 801 | 186.8 |
| D | 7 | 238 | 79330 | 401.59 | 810 | 787 | 195.6 |
| D | 1 | 52 | 64658 | 326.58 | 810 | 787 | 195.6 |
| D | 2 | 234 | 32636 | 162.85 | 810 | 787 | 195.6 |
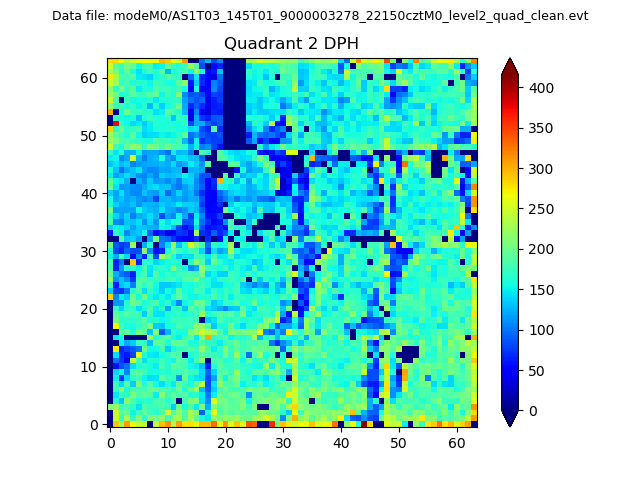
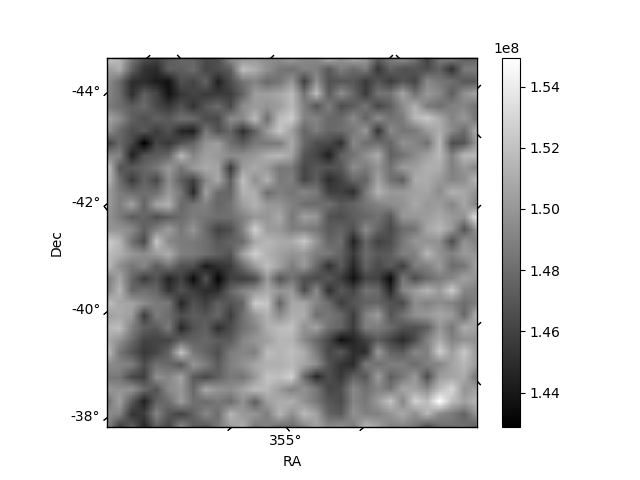
Histogram calculated using DETX and DETY for each event in the final _common_clean file
| Quadrant A |  |
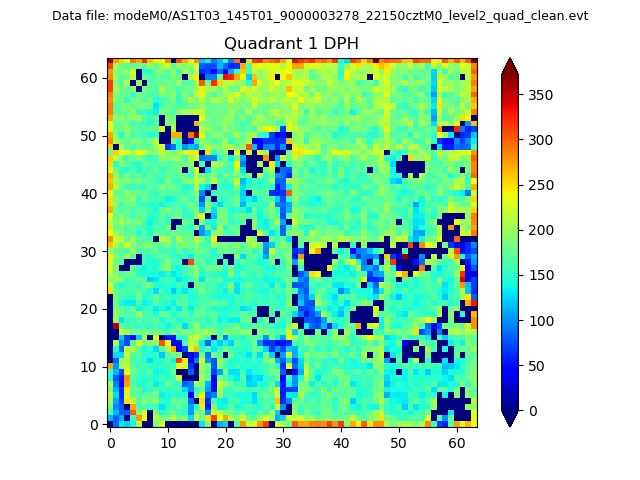 |
Quadrant B |
|---|---|---|---|
| Quadrant D | 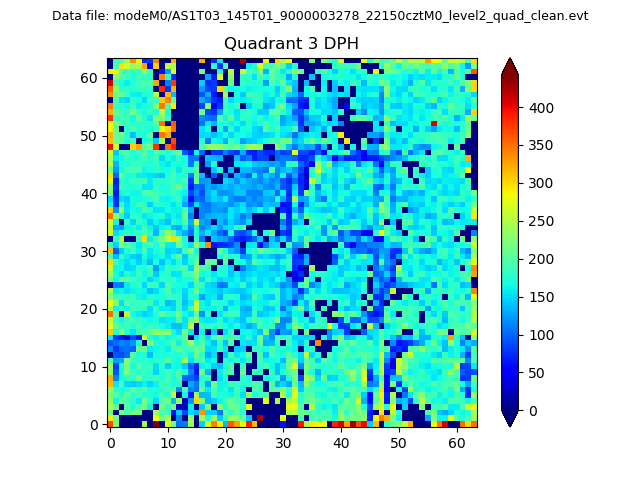 |
 |
Quadrant C |
| Plot type | Count rate plots | Images |
|---|---|---|
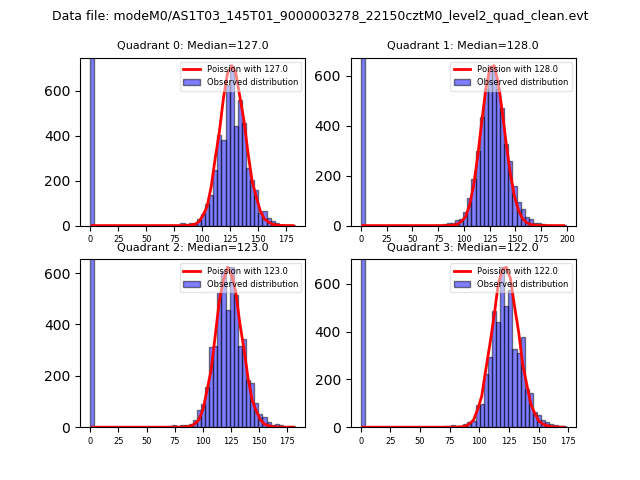
| Comparison with Poisson distribution Blue bars denote a histogram of data divided into 1 sec bins. Red curve is a Poisson curve with rate = median count rate of data. |
 |
 |
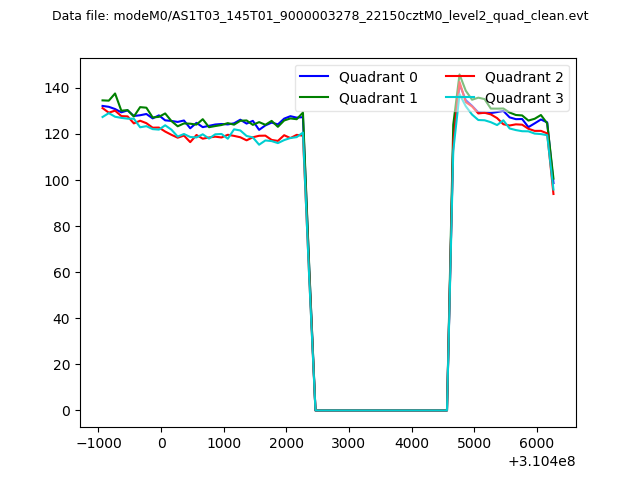
| Quadrant-wise count rates Data is divided into 100 sec bins |
 |
|
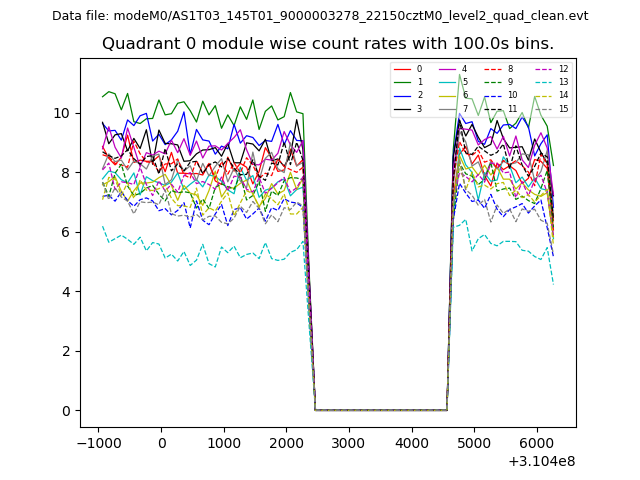
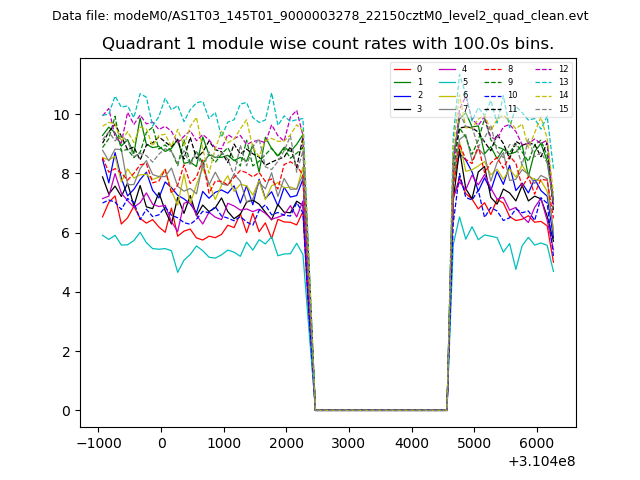
| Module-wise count rates for Quadrant A Data is divided into 100 sec bins |
 |
 |
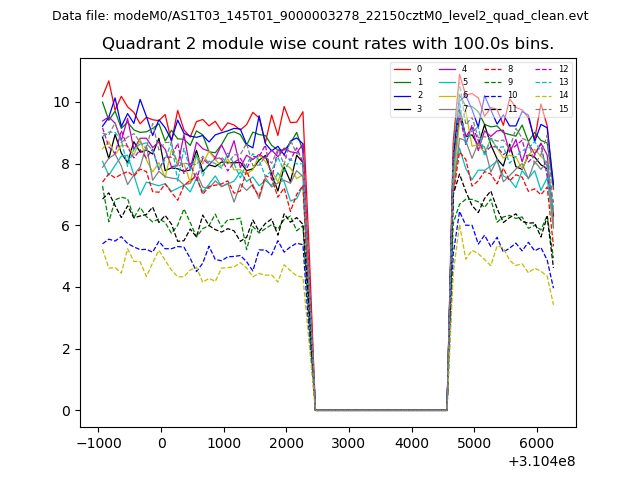
| Module-wise count rates for Quadrant B Data is divided into 100 sec bins |
 |
 |
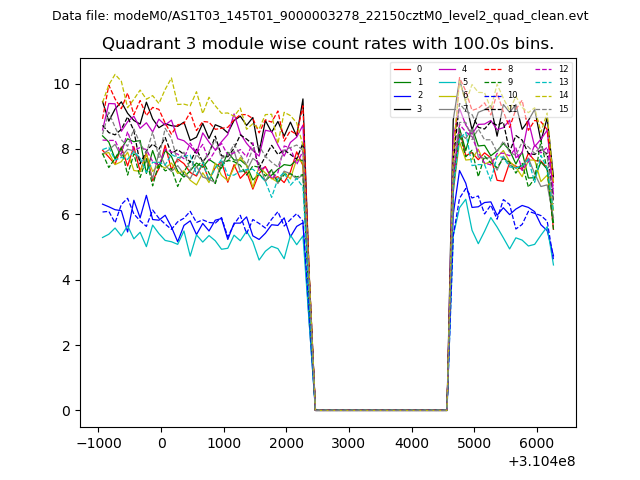
| Module-wise count rates for Quadrant C Data is divided into 100 sec bins |
 |
 |
| Module-wise count rates for Quadrant D Data is divided into 100 sec bins |
 |
 |
| Parameter | Plot |
|---|---|
| CZT HV Monitor | 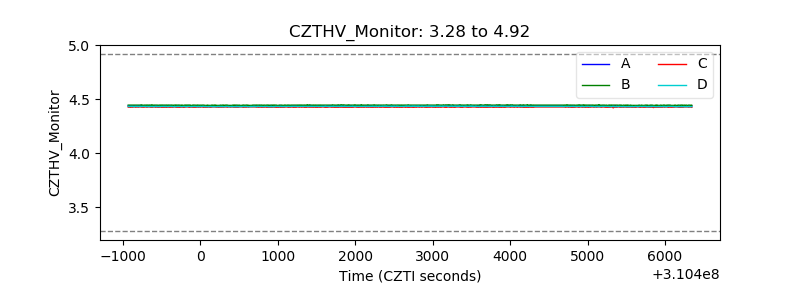 |
| D_VDD | 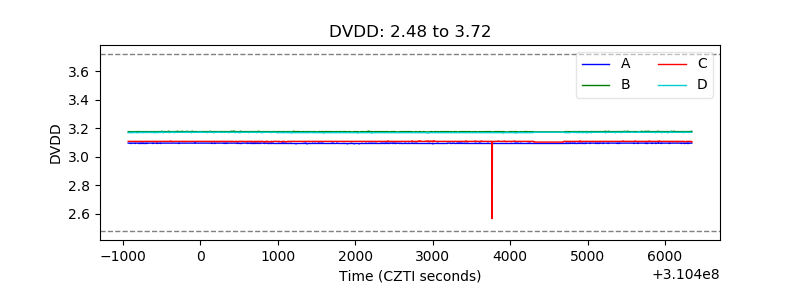 |
| Temperature 1 | 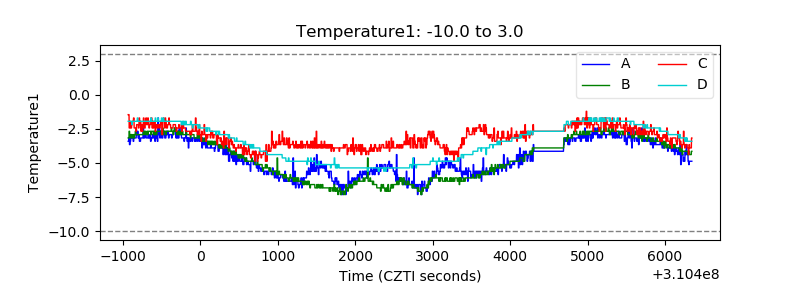 |
| Veto HV Monitor |  |
| Veto LLD | 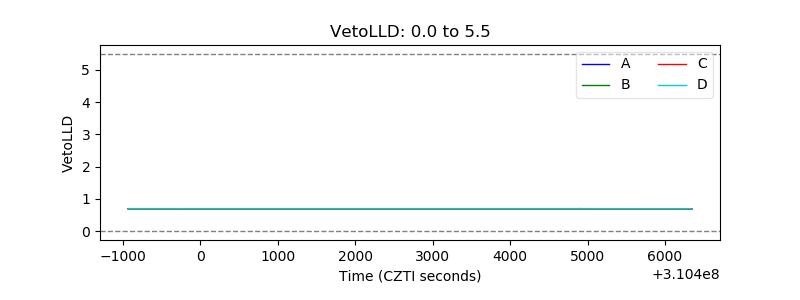 |
| Alpha Counter | 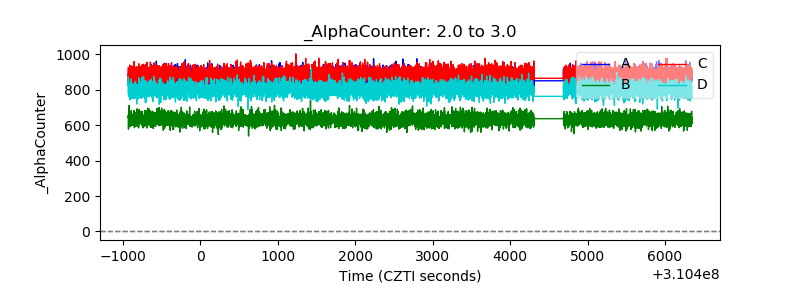 |
| _CPM_Rate | 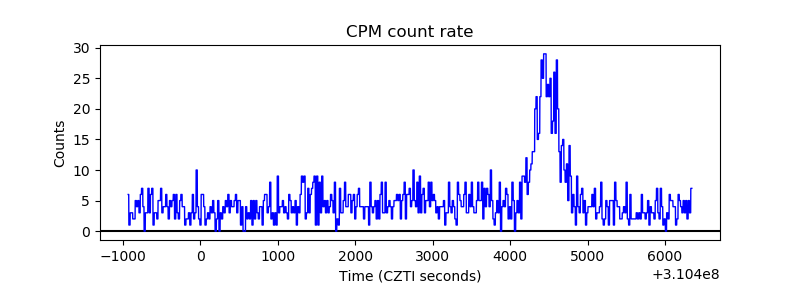 |
| CZT Counter | 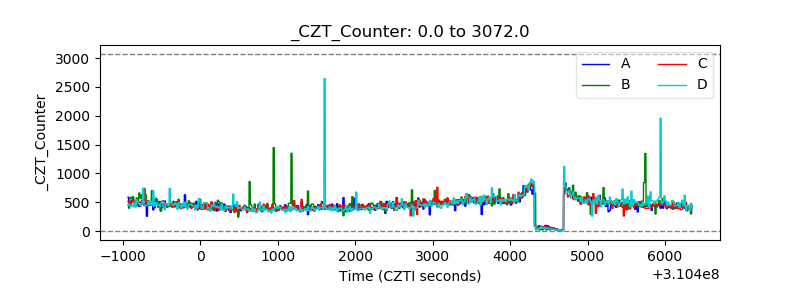 |
| +2.5 Volts monitor |  |
| +5 Volts monitor |  |
| _ROLL_ROT | 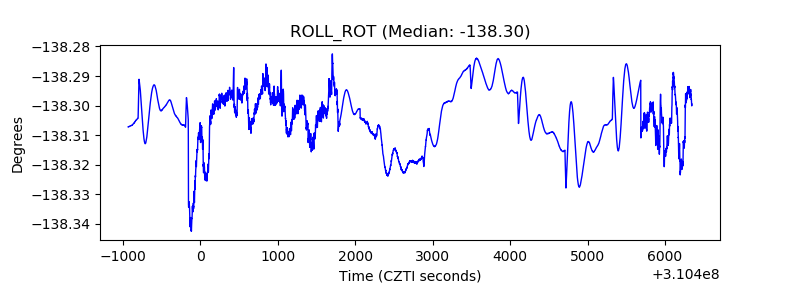 |
| _Roll_DEC | 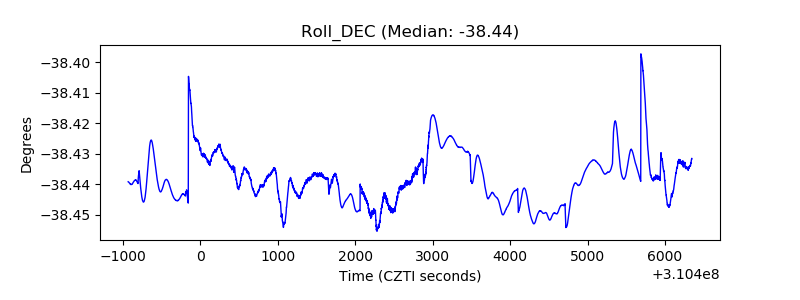 |
| _Roll_RA | 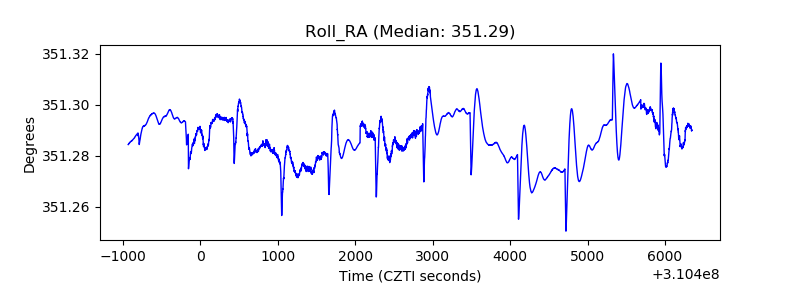 |
| Veto Counter | 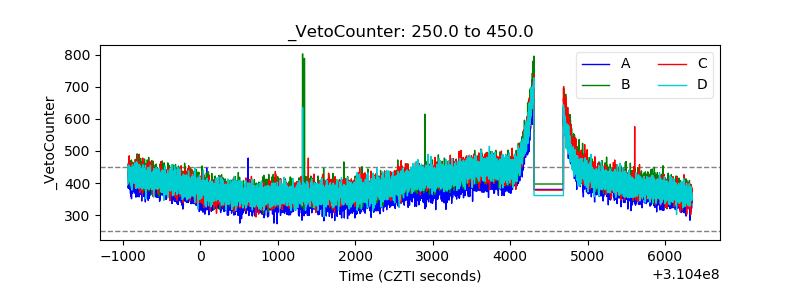 |