| Param | Original file | Final file |
|---|---|---|
| Filename | modeM0/AS1T03_145T01_9000003278_22151cztM0_level2.evt | modeM0/AS1T03_145T01_9000003278_22151cztM0_level2_quad_clean.evt |
| Size (bytes) | 492,759,360 | 104,590,080 |
| Size | 469.9 MB | 99.7 MB |
| Events in quadrant A | 3,502,629 | 673,494 |
| Events in quadrant B | 3,767,034 | 682,022 |
| Events in quadrant C | 3,520,833 | 651,951 |
| Events in quadrant D | 3,629,511 | 644,504 |
| Mode M0 | |||
|---|---|---|---|
| Quadrant | BADHDUFLAG | Total packets | Discarded packets |
| A | 0 | 15315 | 1 |
| B | 0 | 16010 | 1 |
| C | 0 | 15454 | 2 |
| D | 0 | 15614 | 1 |
| Mode SS | |||
|---|---|---|---|
| Quadrant | BADHDUFLAG | Total packets | Discarded packets |
| A | 0 | 148 | 0 |
| B | 0 | 148 | 0 |
| C | 0 | 148 | 0 |
| D | 0 | 148 | 0 |
| Mode M9 | |||
|---|---|---|---|
| Quadrant | BADHDUFLAG | Total packets | Discarded packets |
| A | 0 | 4 | 0 |
| B | 0 | 5 | 0 |
| C | 0 | 5 | 0 |
| D | 0 | 5 | 0 |
| Quadrant | Total seconds | Saturated seconds | Saturation percentage |
|---|---|---|---|
| A | 7416 | 28 | 0.377562% |
| B | 7416 | 93 | 1.254045% |
| C | 7415 | 66 | 0.890088% |
| D | 7415 | 31 | 0.418071% |
Noise dominated data is calculated using 1-second bins in cleaned event files. If a bin has >2000 counts, and if more than 50% of those come from <1% of pixels, then it is considered to be noise-dominated and hence unusable.
| Quadrant | # 1 sec bins | Bins with >0 counts | Bins with >2000 counts | High rate bins dominated by noise | Noise dominated (total time) | Noise dominated (detector-on time) | Marked lightcurve |
|---|---|---|---|---|---|---|---|
| A | 7771 | 7417 | 0 | 0 | 0.00% | 0.00% | 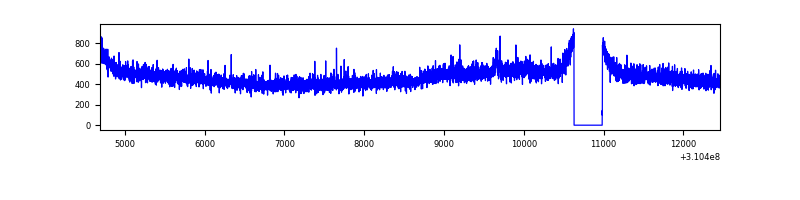 |
| B | 7771 | 7417 | 29 | 29 | 0.37% | 0.39% | 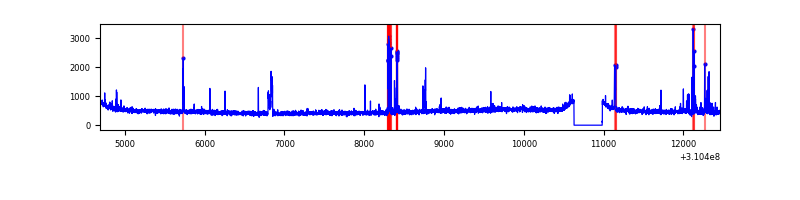 |
| C | 7770 | 7416 | 0 | 0 | 0.00% | 0.00% | 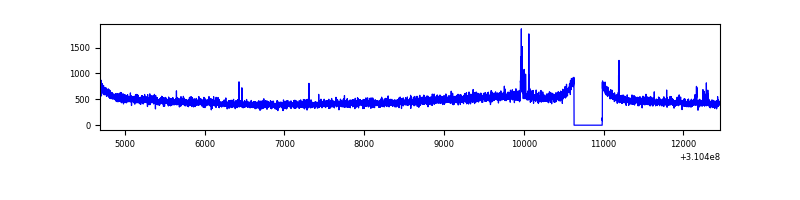 |
| D | 7770 | 7416 | 5 | 5 | 0.06% | 0.07% | 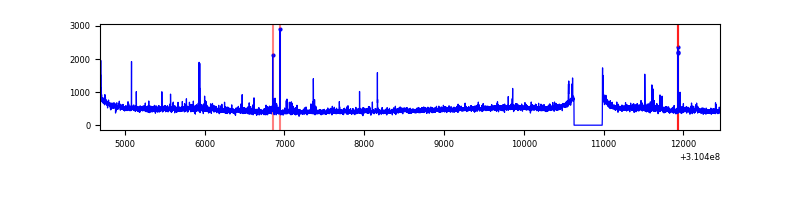 |
Top three noisy pixels from each quadrant. If the there are fewer than three noisy pixels in the level2.evt file, extra rows are filled as -1
| Pixel properties | Quadrant properties | ||||||
|---|---|---|---|---|---|---|---|
| Quadrant | DetID | PixID | Counts | Sigma | Mean | Median | Sigma |
| A | 3 | 1 | 19917 | 104.42 | 902 | 882 | 182.3 |
| A | 13 | 254 | 10697 | 53.84 | 902 | 882 | 182.3 |
| A | 3 | 137 | 8030 | 39.21 | 902 | 882 | 182.3 |
| B | 10 | 246 | 155116 | 887.14 | 897 | 874 | 173.9 |
| B | 3 | 64 | 68585 | 389.45 | 897 | 874 | 173.9 |
| B | 12 | 111 | 21747 | 120.05 | 897 | 874 | 173.9 |
| C | 14 | 238 | 136756 | 676.05 | 856 | 860 | 201.0 |
| C | 10 | 22 | 40893 | 199.15 | 856 | 860 | 201.0 |
| C | 13 | 61 | 6009 | 25.62 | 856 | 860 | 201.0 |
| D | 7 | 238 | 196649 | 926.81 | 874 | 850 | 211.3 |
| D | 12 | 235 | 48492 | 225.51 | 874 | 850 | 211.3 |
| D | 2 | 234 | 32047 | 147.67 | 874 | 850 | 211.3 |
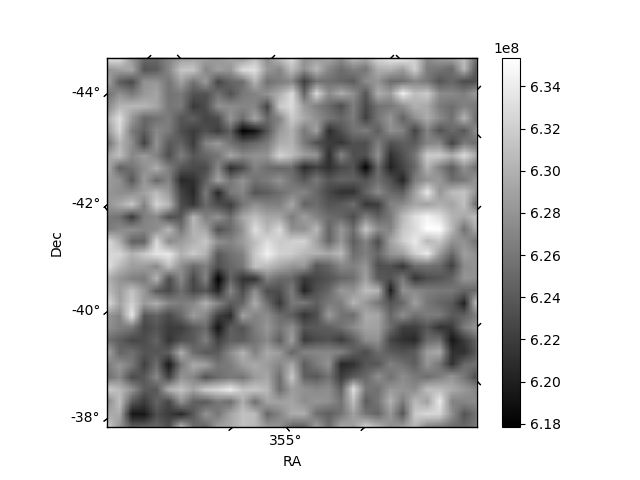
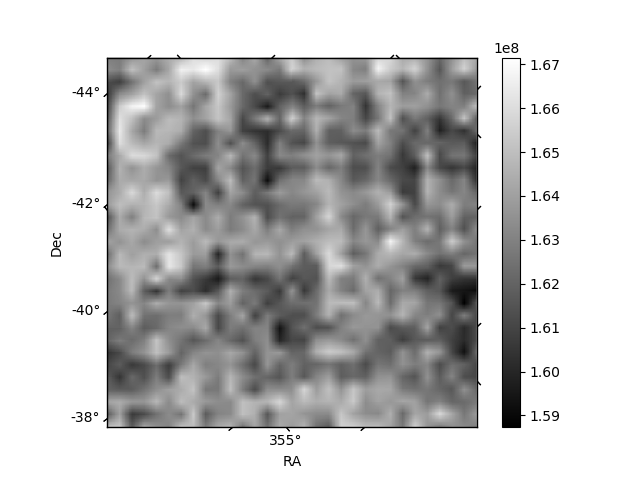
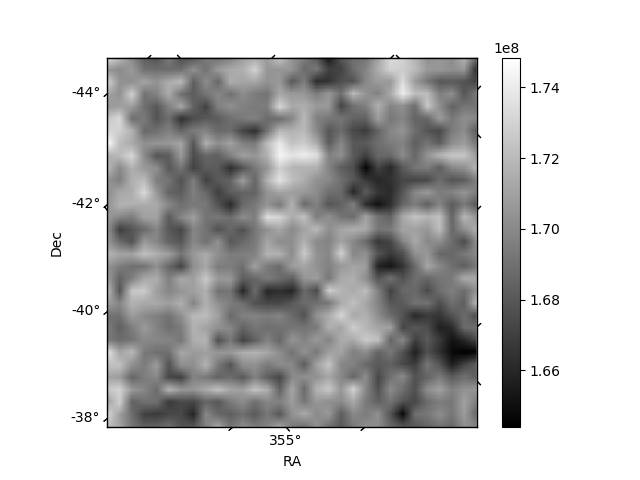
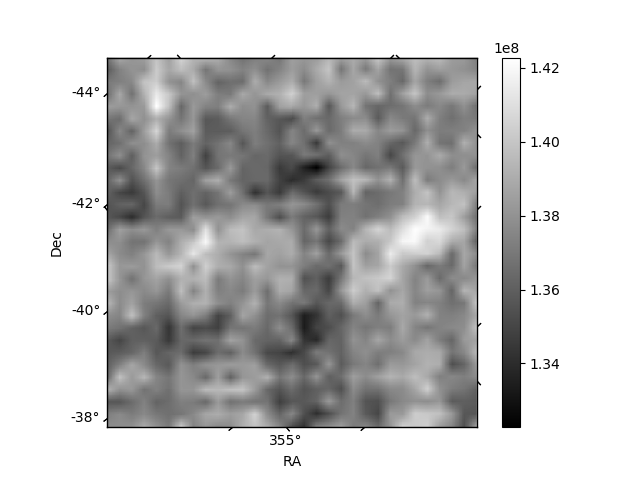
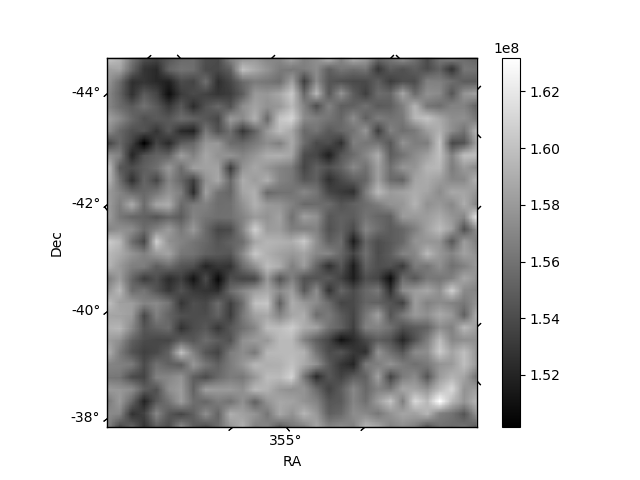
Histogram calculated using DETX and DETY for each event in the final _common_clean file
| Quadrant A | 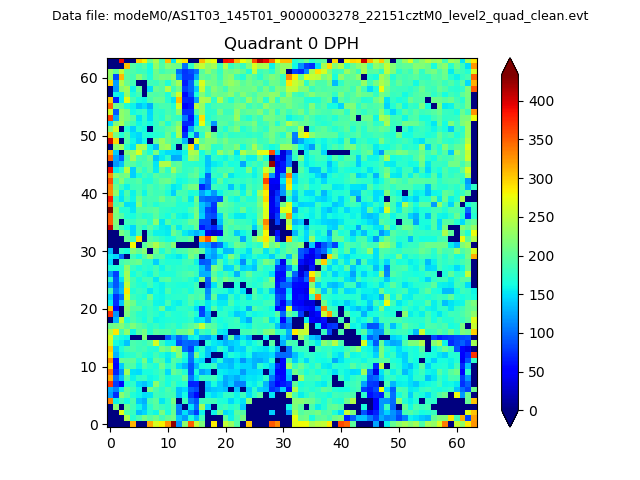 |
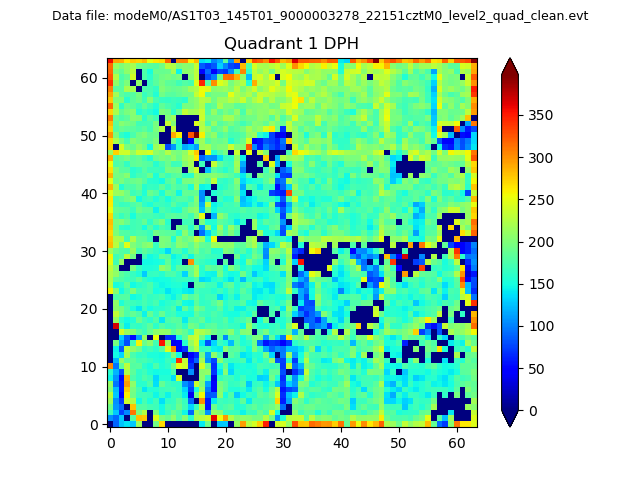 |
Quadrant B |
|---|---|---|---|
| Quadrant D | 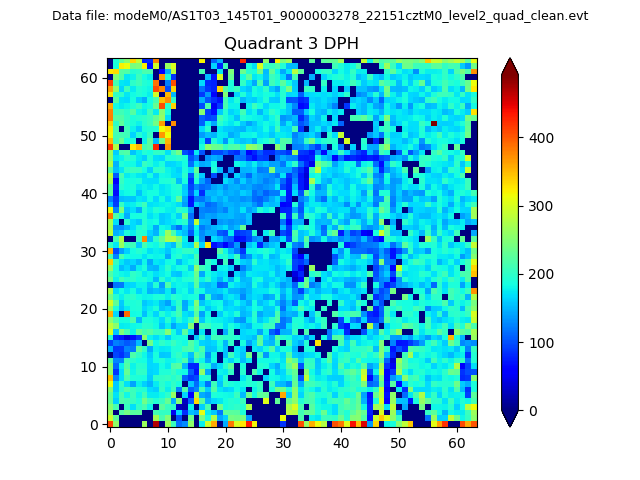 |
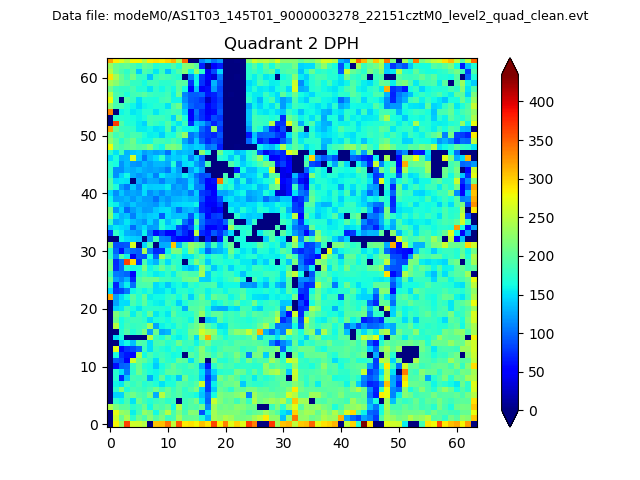 |
Quadrant C |
| Plot type | Count rate plots | Images |
|---|---|---|
| Comparison with Poisson distribution Blue bars denote a histogram of data divided into 1 sec bins. Red curve is a Poisson curve with rate = median count rate of data. |
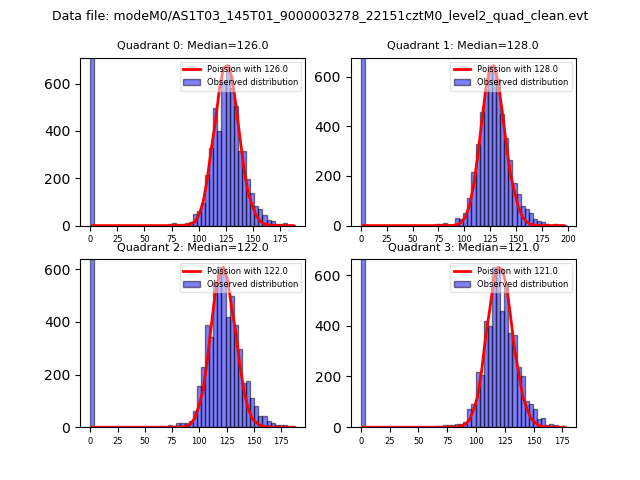 |
 |
| Quadrant-wise count rates Data is divided into 100 sec bins |
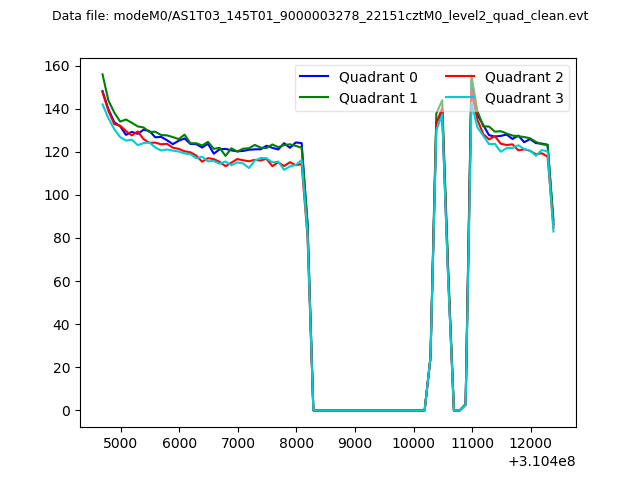 |
|
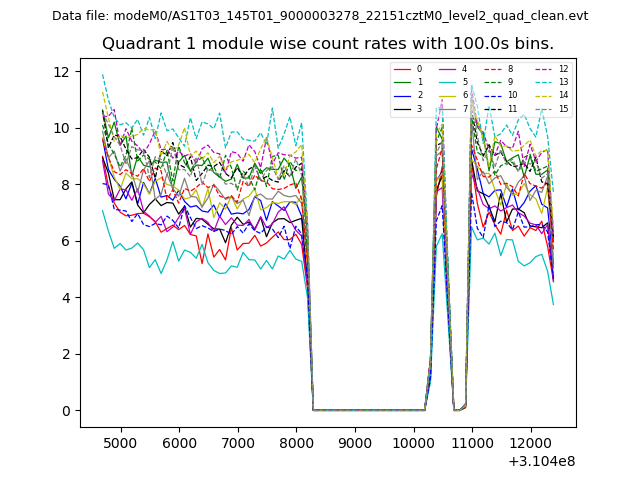
| Module-wise count rates for Quadrant A Data is divided into 100 sec bins |
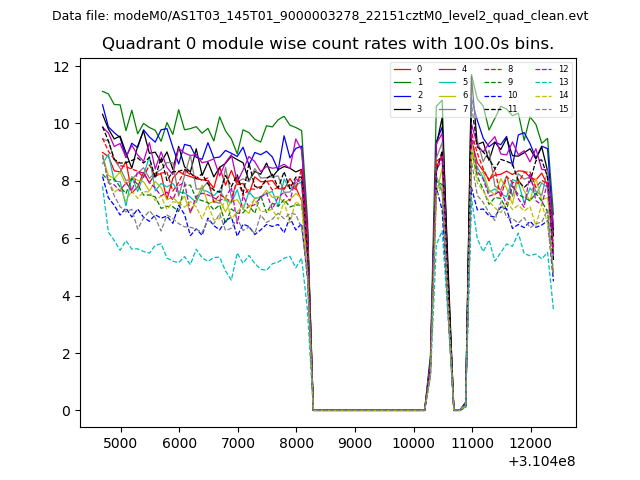 |
 |
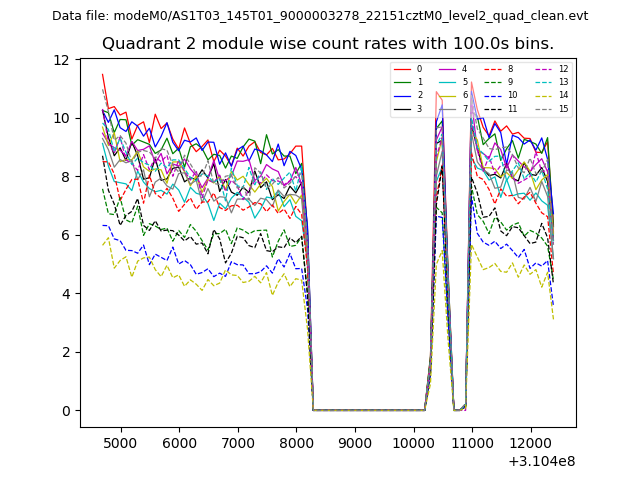
| Module-wise count rates for Quadrant B Data is divided into 100 sec bins |
 |
 |
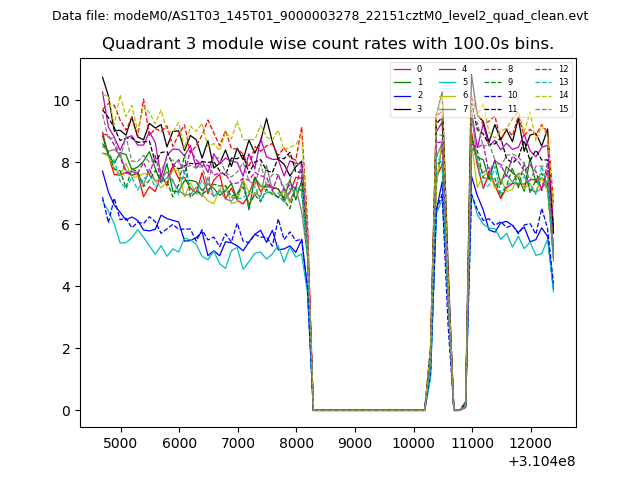
| Module-wise count rates for Quadrant C Data is divided into 100 sec bins |
 |
 |
| Module-wise count rates for Quadrant D Data is divided into 100 sec bins |
 |
 |
| Parameter | Plot |
|---|---|
| CZT HV Monitor | 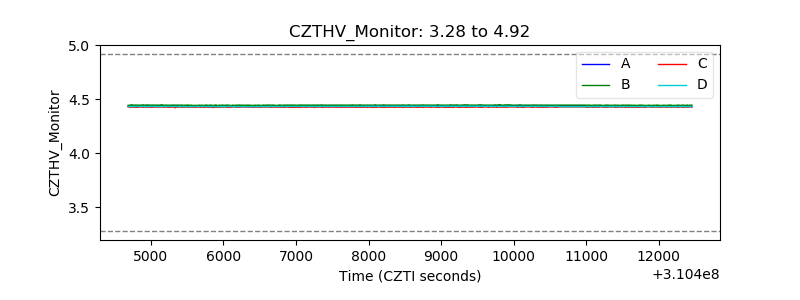 |
| D_VDD | 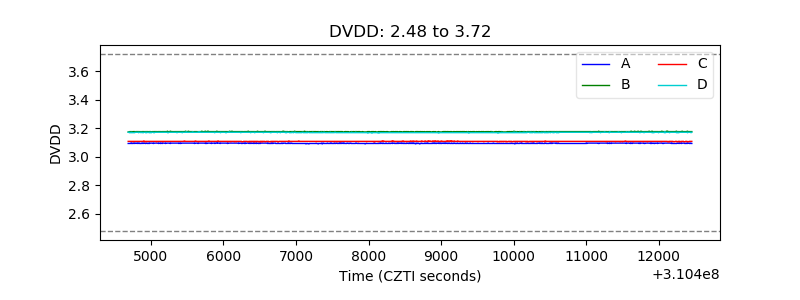 |
| Temperature 1 | 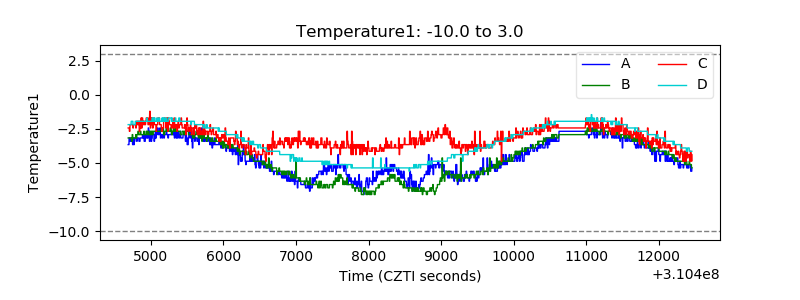 |
| Veto HV Monitor | 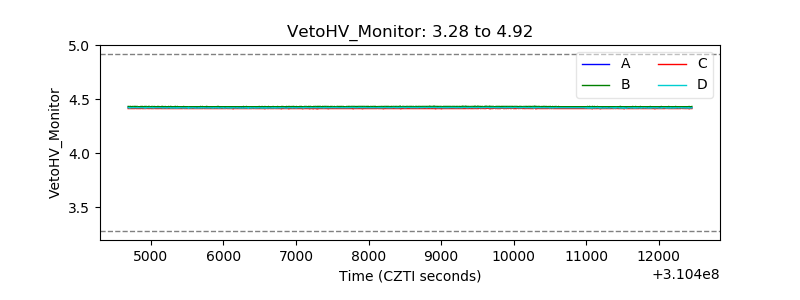 |
| Veto LLD | 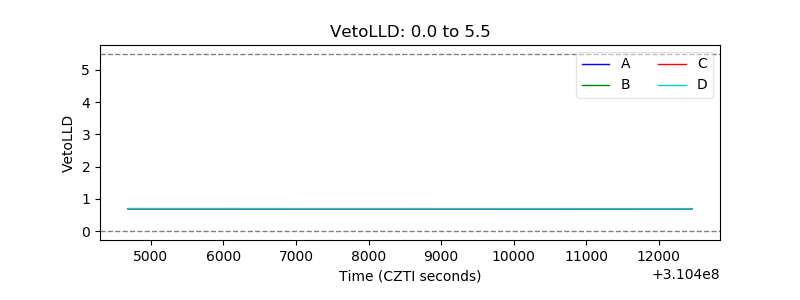 |
| Alpha Counter | 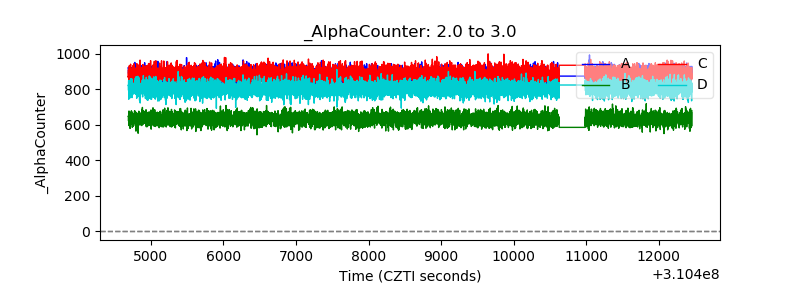 |
| _CPM_Rate | 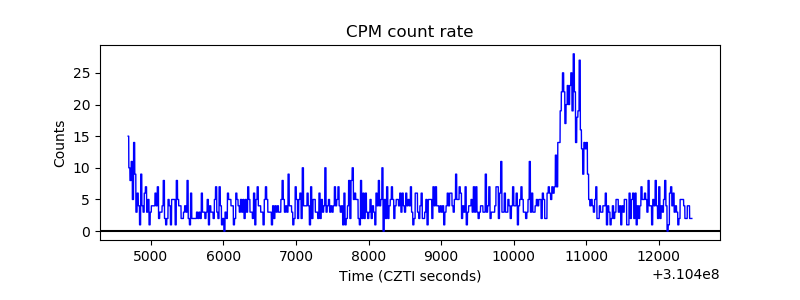 |
| CZT Counter | 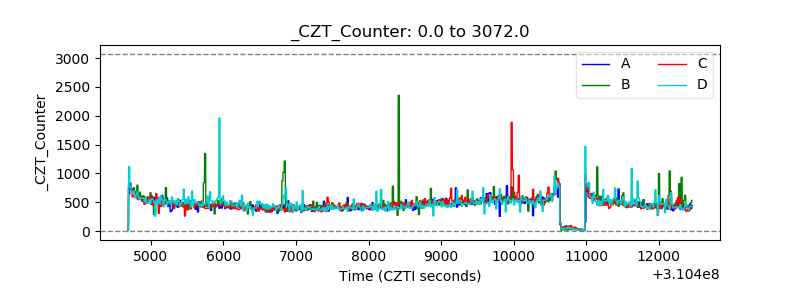 |
| +2.5 Volts monitor |  |
| +5 Volts monitor |  |
| _ROLL_ROT |  |
| _Roll_DEC | 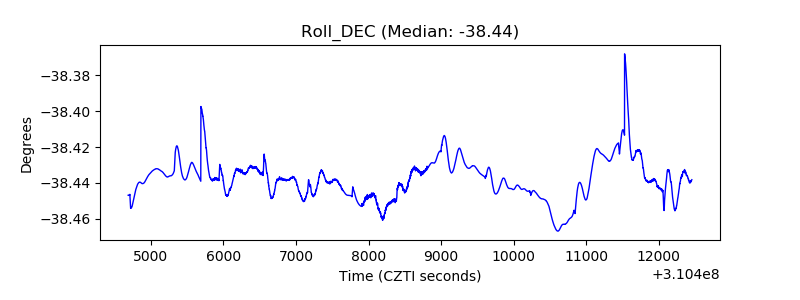 |
| _Roll_RA | 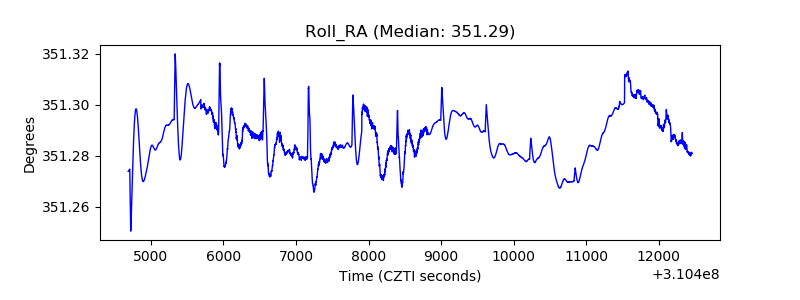 |
| Veto Counter |  |