| Param | Original file | Final file |
|---|---|---|
| Filename | modeM0/AS1T03_145T01_9000003278_22152cztM0_level2.evt | modeM0/AS1T03_145T01_9000003278_22152cztM0_level2_quad_clean.evt |
| Size (bytes) | 476,576,640 | 103,104,000 |
| Size | 454.5 MB | 98.3 MB |
| Events in quadrant A | 3,416,403 | 664,000 |
| Events in quadrant B | 3,591,852 | 670,187 |
| Events in quadrant C | 3,470,768 | 638,381 |
| Events in quadrant D | 3,452,156 | 635,890 |
| Mode M0 | |||
|---|---|---|---|
| Quadrant | BADHDUFLAG | Total packets | Discarded packets |
| A | 0 | 15160 | 1 |
| B | 0 | 15511 | 1 |
| C | 0 | 15287 | 1 |
| D | 0 | 15337 | 2 |
| Mode SS | |||
|---|---|---|---|
| Quadrant | BADHDUFLAG | Total packets | Discarded packets |
| A | 0 | 148 | 0 |
| B | 0 | 148 | 0 |
| C | 0 | 148 | 0 |
| D | 0 | 148 | 0 |
| Mode M9 | |||
|---|---|---|---|
| Quadrant | BADHDUFLAG | Total packets | Discarded packets |
| A | 0 | 5 | 0 |
| B | 0 | 5 | 0 |
| C | 0 | 5 | 0 |
| D | 0 | 5 | 0 |
| Quadrant | Total seconds | Saturated seconds | Saturation percentage |
|---|---|---|---|
| A | 7391 | 30 | 0.405899% |
| B | 7392 | 56 | 0.757576% |
| C | 7392 | 74 | 1.001082% |
| D | 7391 | 14 | 0.189420% |
Noise dominated data is calculated using 1-second bins in cleaned event files. If a bin has >2000 counts, and if more than 50% of those come from <1% of pixels, then it is considered to be noise-dominated and hence unusable.
| Quadrant | # 1 sec bins | Bins with >0 counts | Bins with >2000 counts | High rate bins dominated by noise | Noise dominated (total time) | Noise dominated (detector-on time) | Marked lightcurve |
|---|---|---|---|---|---|---|---|
| A | 7841 | 7392 | 0 | 0 | 0.00% | 0.00% | 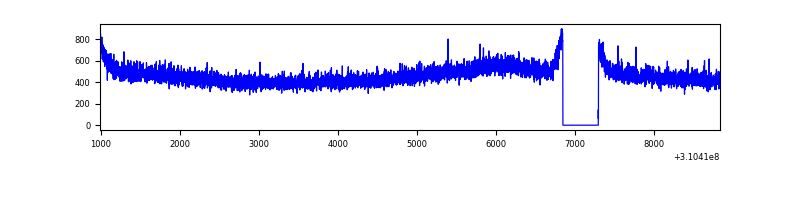 |
| B | 7842 | 7393 | 7 | 7 | 0.09% | 0.09% | 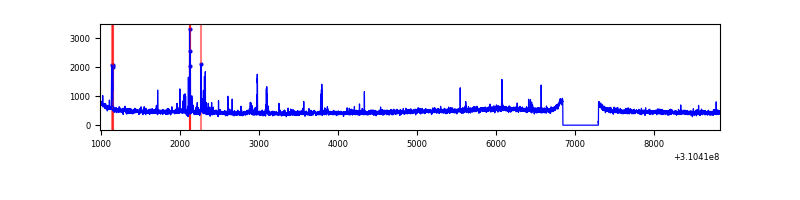 |
| C | 7842 | 7393 | 12 | 12 | 0.15% | 0.16% | 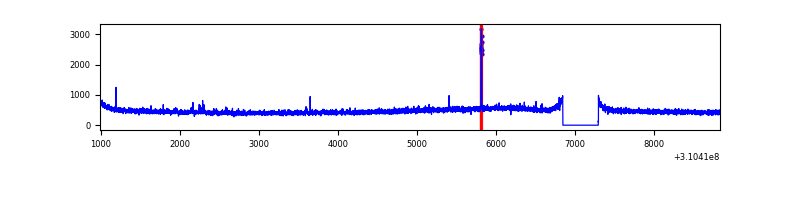 |
| D | 7841 | 7392 | 5 | 5 | 0.06% | 0.07% | 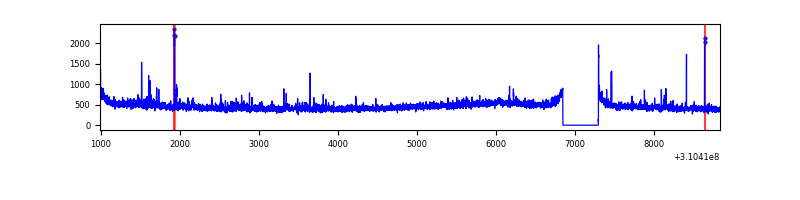 |
Top three noisy pixels from each quadrant. If the there are fewer than three noisy pixels in the level2.evt file, extra rows are filled as -1
| Pixel properties | Quadrant properties | ||||||
|---|---|---|---|---|---|---|---|
| Quadrant | DetID | PixID | Counts | Sigma | Mean | Median | Sigma |
| A | 13 | 254 | 11324 | 58.5 | 886 | 868 | 178.7 |
| A | 3 | 137 | 7932 | 39.52 | 886 | 868 | 178.7 |
| A | 0 | 226 | 7625 | 37.81 | 886 | 868 | 178.7 |
| B | 10 | 246 | 64131 | 370.77 | 882 | 857 | 170.7 |
| B | 3 | 64 | 52165 | 300.66 | 882 | 857 | 170.7 |
| B | 12 | 111 | 21328 | 119.96 | 882 | 857 | 170.7 |
| C | 14 | 238 | 132016 | 660.92 | 841 | 844 | 198.5 |
| C | 10 | 22 | 51976 | 257.63 | 841 | 844 | 198.5 |
| C | 13 | 61 | 5884 | 25.39 | 841 | 844 | 198.5 |
| D | 7 | 238 | 136411 | 650.98 | 855 | 829 | 208.3 |
| D | 13 | 172 | 33088 | 154.89 | 855 | 829 | 208.3 |
| D | 2 | 234 | 30833 | 144.06 | 855 | 829 | 208.3 |
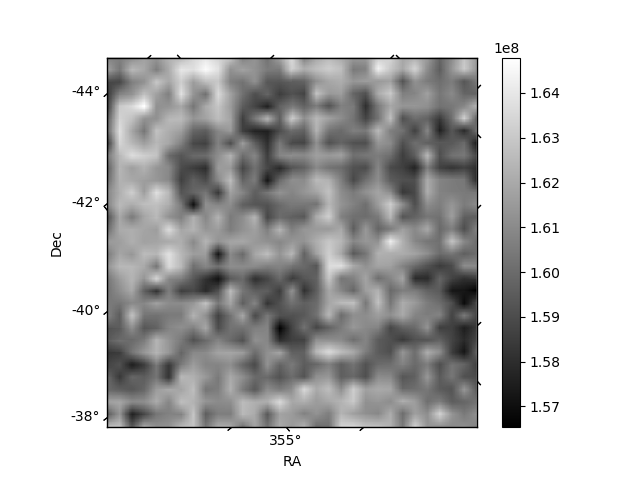
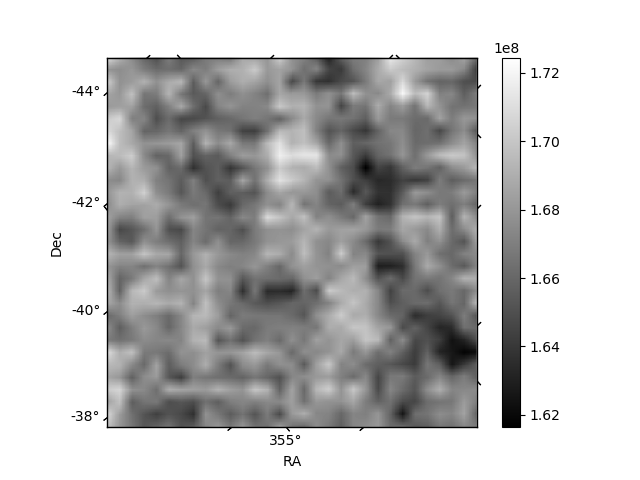
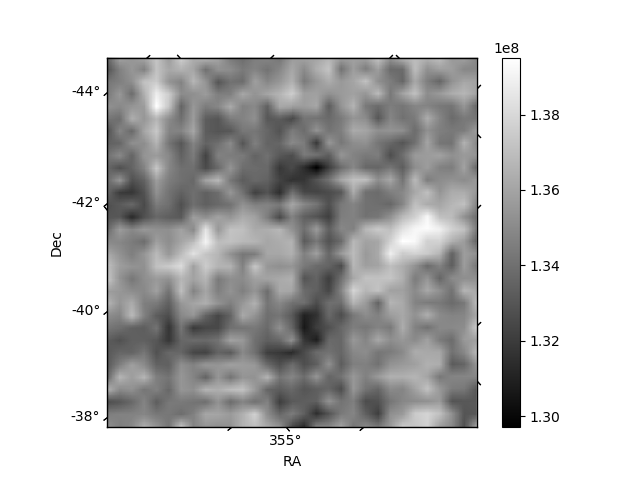
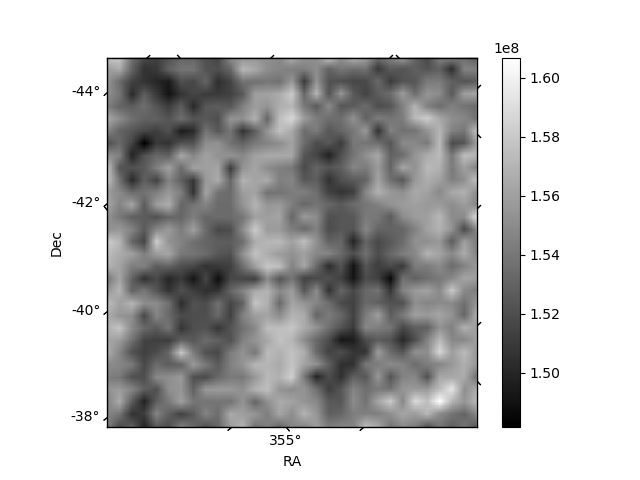
Histogram calculated using DETX and DETY for each event in the final _common_clean file
| Quadrant A | 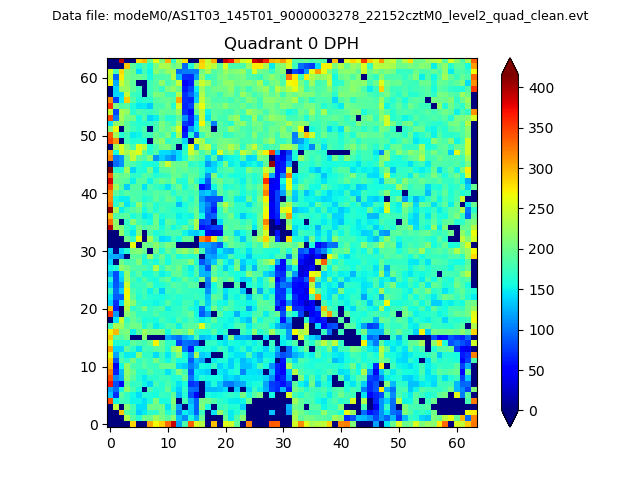 |
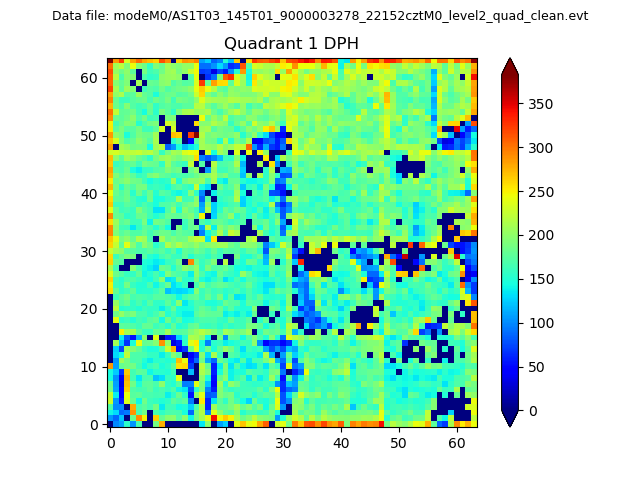 |
Quadrant B |
|---|---|---|---|
| Quadrant D |  |
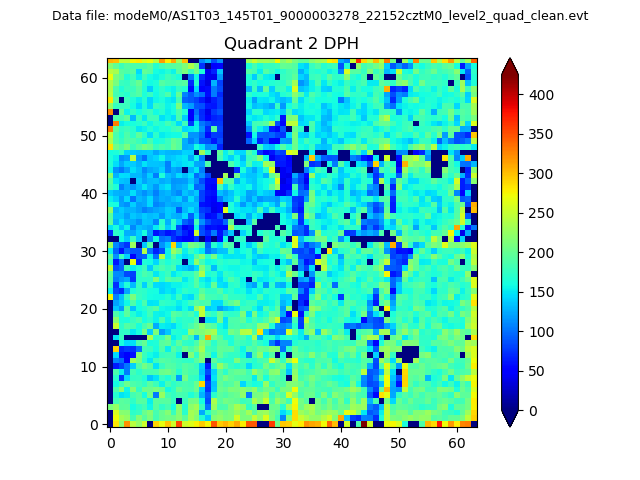 |
Quadrant C |
| Plot type | Count rate plots | Images |
|---|---|---|
| Comparison with Poisson distribution Blue bars denote a histogram of data divided into 1 sec bins. Red curve is a Poisson curve with rate = median count rate of data. |
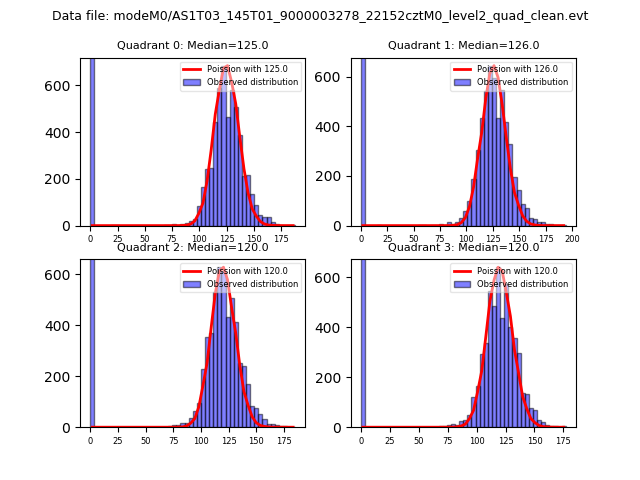 |
 |
| Quadrant-wise count rates Data is divided into 100 sec bins |
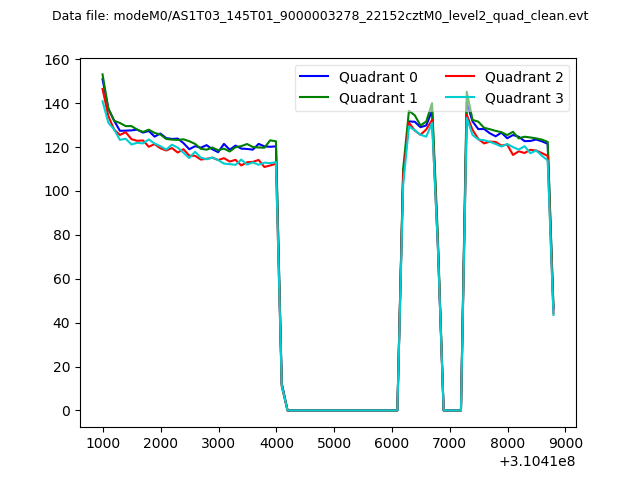 |
|
| Module-wise count rates for Quadrant A Data is divided into 100 sec bins |
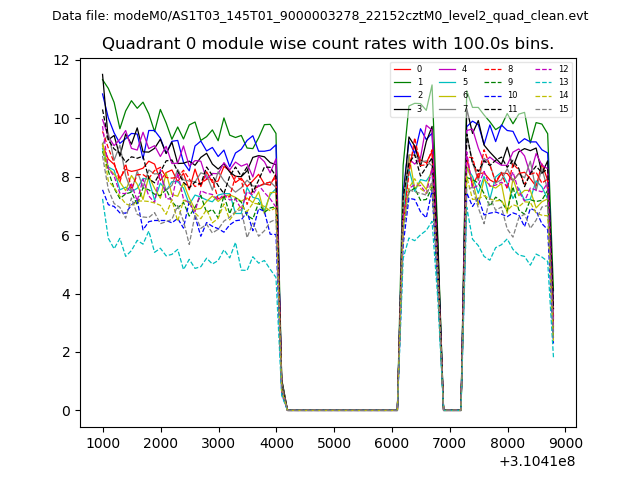 |
 |
| Module-wise count rates for Quadrant B Data is divided into 100 sec bins |
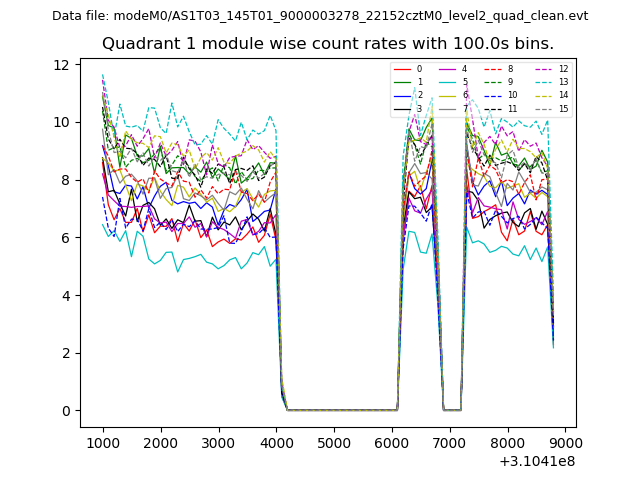 |
 |
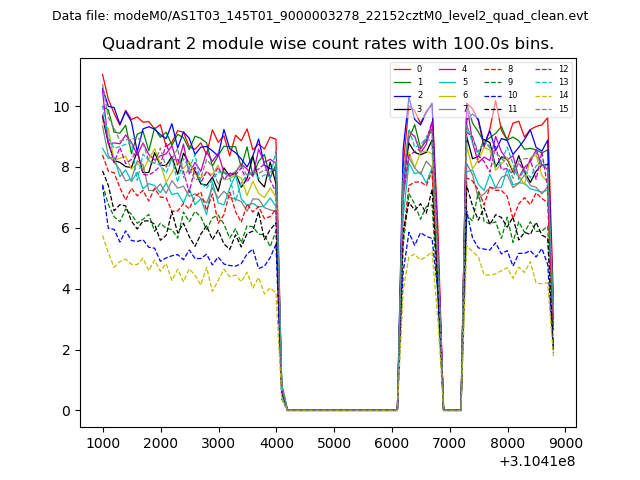
| Module-wise count rates for Quadrant C Data is divided into 100 sec bins |
 |
 |
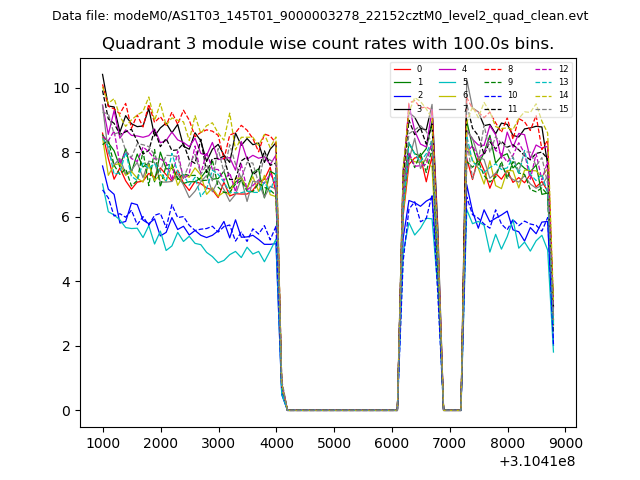
| Module-wise count rates for Quadrant D Data is divided into 100 sec bins |
 |
 |
| Parameter | Plot |
|---|---|
| CZT HV Monitor | 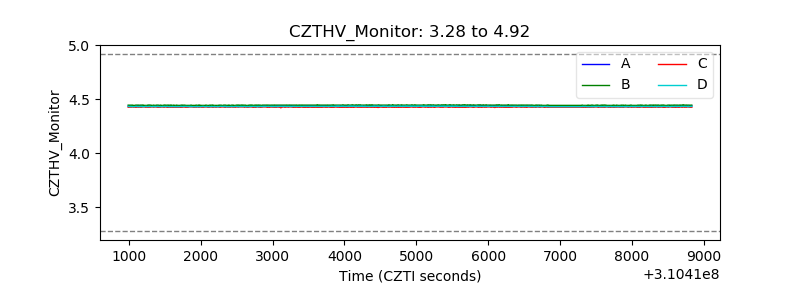 |
| D_VDD | 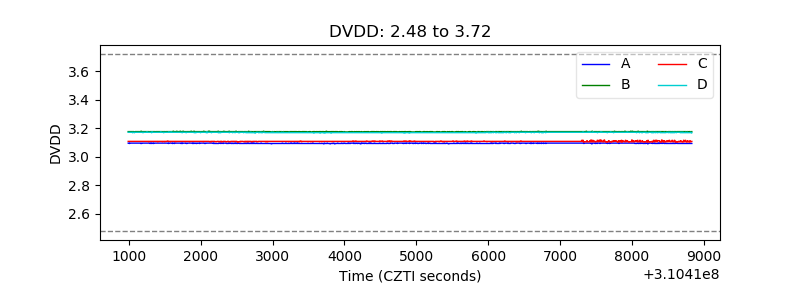 |
| Temperature 1 | 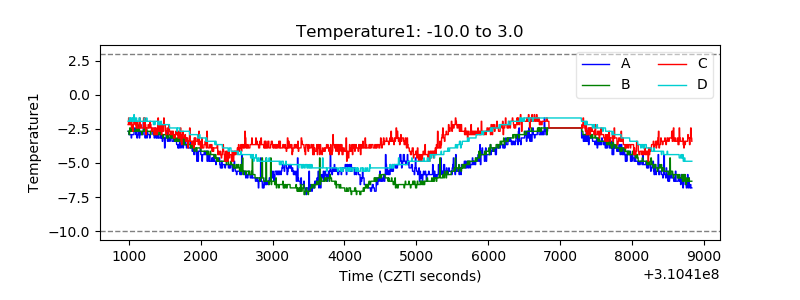 |
| Veto HV Monitor | 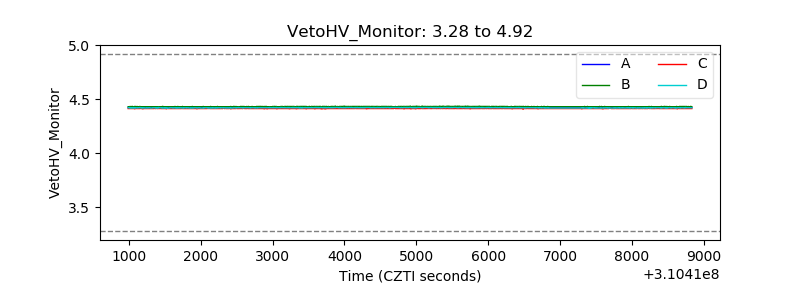 |
| Veto LLD | 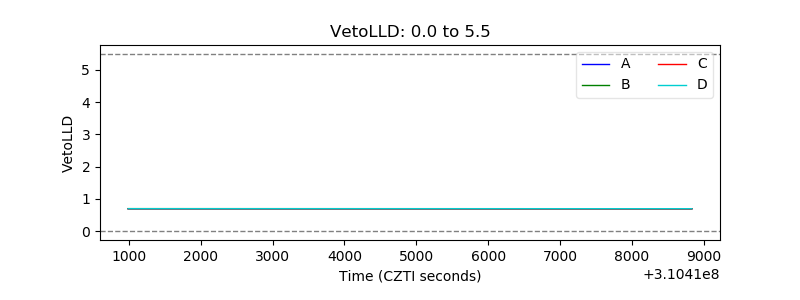 |
| Alpha Counter | 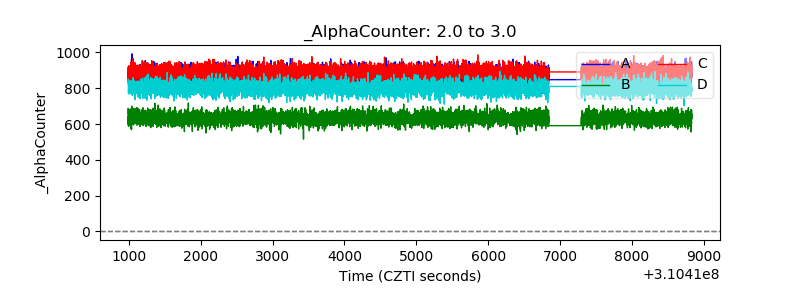 |
| _CPM_Rate | 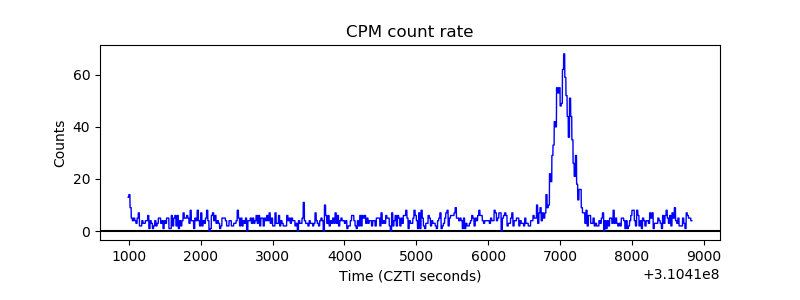 |
| CZT Counter |  |
| +2.5 Volts monitor | 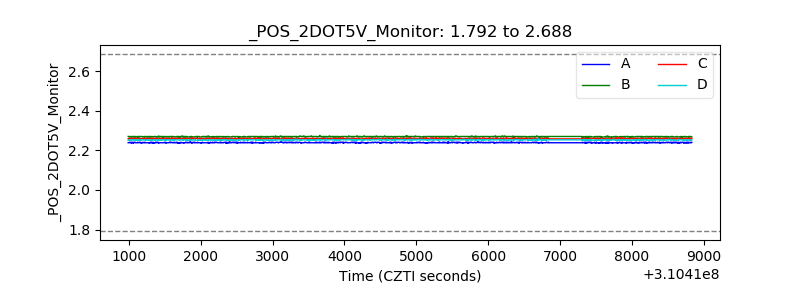 |
| +5 Volts monitor |  |
| _ROLL_ROT | 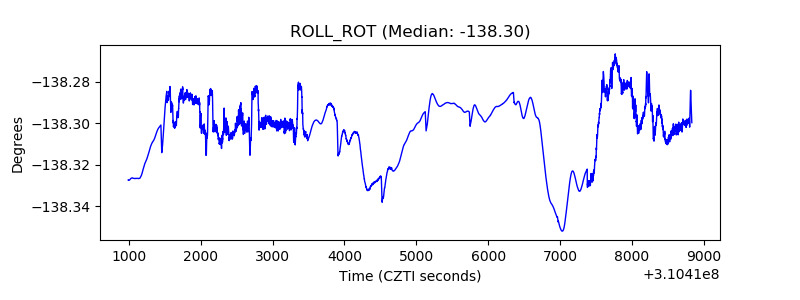 |
| _Roll_DEC |  |
| _Roll_RA | 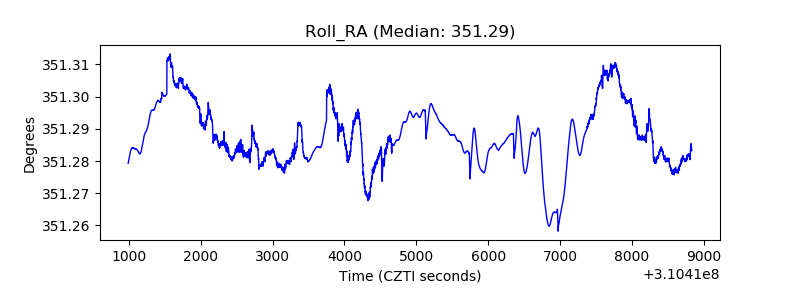 |
| Veto Counter | 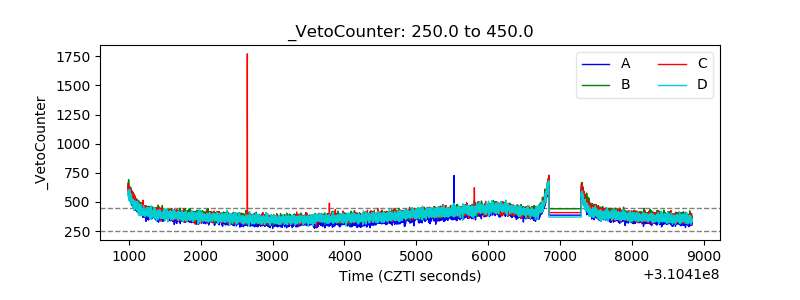 |