| Param | Original file | Final file |
|---|---|---|
| Filename | modeM0/AS1T03_145T01_9000003278_22155cztM0_level2.evt | modeM0/AS1T03_145T01_9000003278_22155cztM0_level2_quad_clean.evt |
| Size (bytes) | 436,656,960 | 93,182,400 |
| Size | 416.4 MB | 88.9 MB |
| Events in quadrant A | 3,124,717 | 596,472 |
| Events in quadrant B | 3,226,074 | 607,138 |
| Events in quadrant C | 3,179,538 | 578,101 |
| Events in quadrant D | 3,234,881 | 569,873 |
| Mode M0 | |||
|---|---|---|---|
| Quadrant | BADHDUFLAG | Total packets | Discarded packets |
| A | 0 | 13699 | 3 |
| B | 0 | 13872 | 2 |
| C | 0 | 13699 | 2 |
| D | 0 | 14323 | 2 |
| Mode SS | |||
|---|---|---|---|
| Quadrant | BADHDUFLAG | Total packets | Discarded packets |
| A | 0 | 134 | 0 |
| B | 0 | 134 | 0 |
| C | 0 | 134 | 0 |
| D | 0 | 134 | 0 |
| Mode M9 | |||
|---|---|---|---|
| Quadrant | BADHDUFLAG | Total packets | Discarded packets |
| A | 0 | 15 | 0 |
| B | 0 | 16 | 0 |
| C | 0 | 16 | 0 |
| D | 0 | 16 | 0 |
| Quadrant | Total seconds | Saturated seconds | Saturation percentage |
|---|---|---|---|
| A | 6759 | 16 | 0.236721% |
| B | 6759 | 38 | 0.562213% |
| C | 6759 | 50 | 0.739754% |
| D | 6759 | 52 | 0.769345% |
Noise dominated data is calculated using 1-second bins in cleaned event files. If a bin has >2000 counts, and if more than 50% of those come from <1% of pixels, then it is considered to be noise-dominated and hence unusable.
| Quadrant | # 1 sec bins | Bins with >0 counts | Bins with >2000 counts | High rate bins dominated by noise | Noise dominated (total time) | Noise dominated (detector-on time) | Marked lightcurve |
|---|---|---|---|---|---|---|---|
| A | 7684 | 6760 | 0 | 0 | 0.00% | 0.00% | 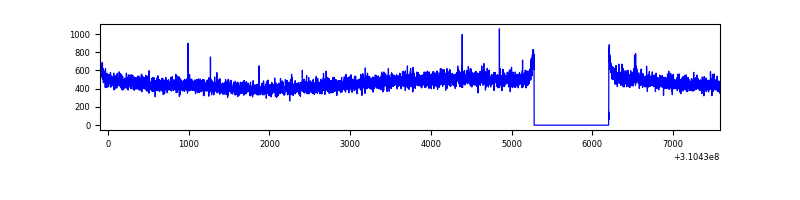 |
| B | 7684 | 6760 | 4 | 4 | 0.05% | 0.06% | 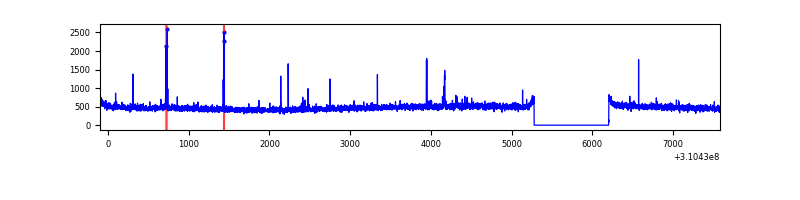 |
| C | 7684 | 6760 | 0 | 0 | 0.00% | 0.00% | 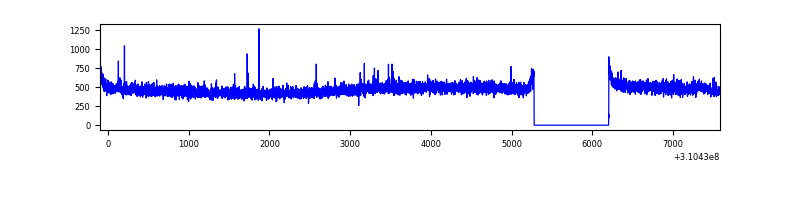 |
| D | 7684 | 6760 | 32 | 32 | 0.42% | 0.47% | 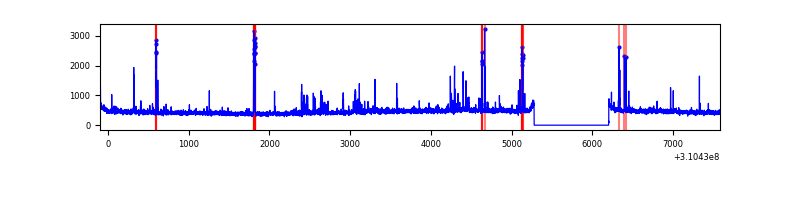 |
Top three noisy pixels from each quadrant. If the there are fewer than three noisy pixels in the level2.evt file, extra rows are filled as -1
| Pixel properties | Quadrant properties | ||||||
|---|---|---|---|---|---|---|---|
| Quadrant | DetID | PixID | Counts | Sigma | Mean | Median | Sigma |
| A | 3 | 1 | 16543 | 96.92 | 805 | 788 | 162.6 |
| A | 13 | 254 | 10923 | 62.35 | 805 | 788 | 162.6 |
| A | 3 | 137 | 7137 | 39.06 | 805 | 788 | 162.6 |
| B | 3 | 64 | 28815 | 179.65 | 808 | 785 | 156.0 |
| B | 12 | 111 | 19282 | 118.55 | 808 | 785 | 156.0 |
| B | 11 | 111 | 16959 | 103.66 | 808 | 785 | 156.0 |
| C | 14 | 238 | 123958 | 676.49 | 778 | 785 | 182.1 |
| C | 9 | 54 | 10088 | 51.09 | 778 | 785 | 182.1 |
| C | 10 | 22 | 9959 | 50.39 | 778 | 785 | 182.1 |
| D | 1 | 52 | 169011 | 887.29 | 783 | 760 | 189.6 |
| D | 13 | 104 | 55907 | 290.82 | 783 | 760 | 189.6 |
| D | 2 | 234 | 26331 | 134.85 | 783 | 760 | 189.6 |
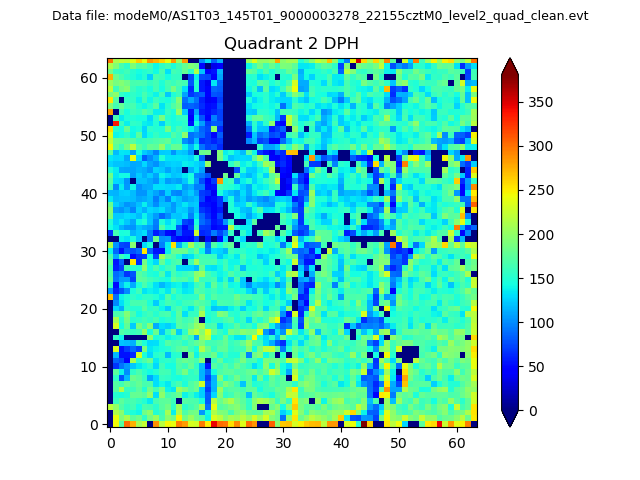
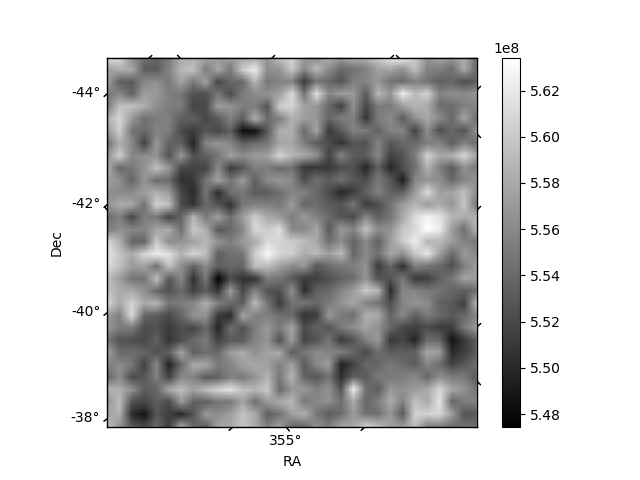
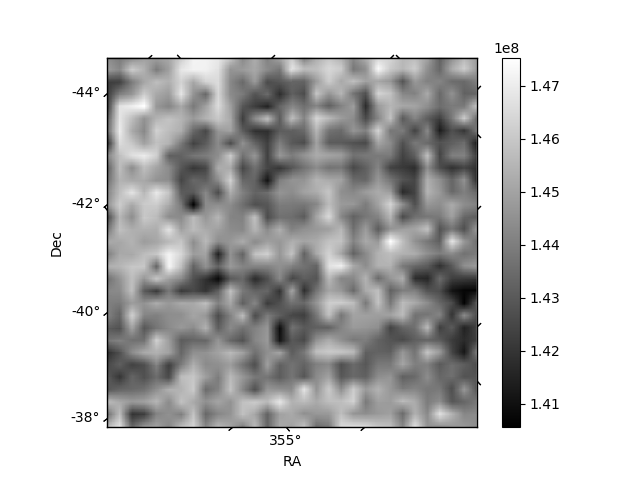
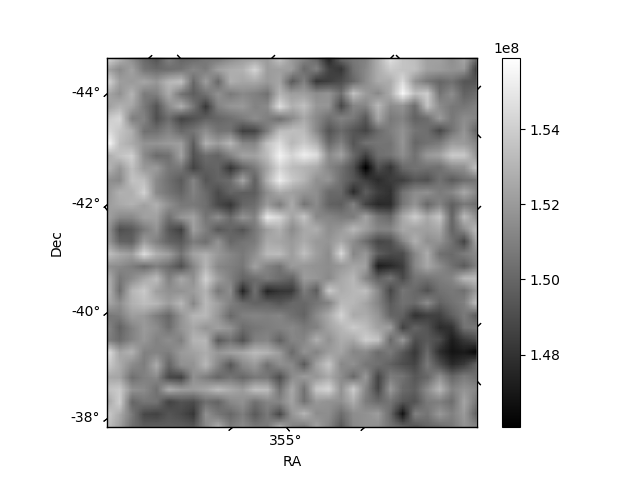
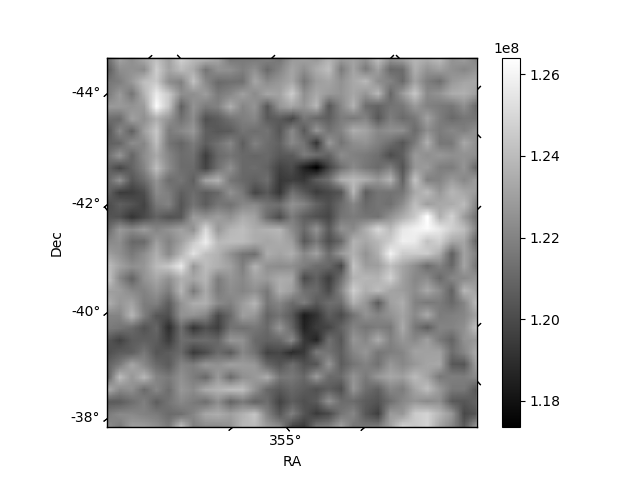
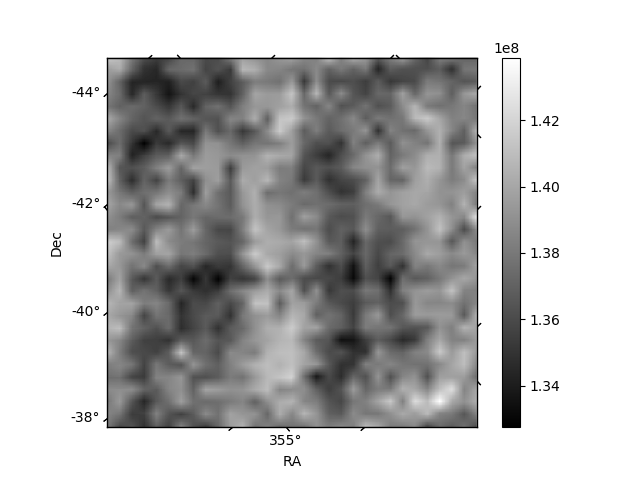
Histogram calculated using DETX and DETY for each event in the final _common_clean file
| Quadrant A | 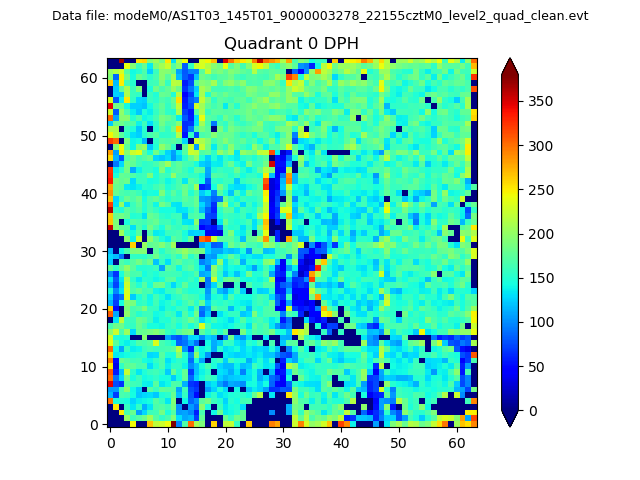 |
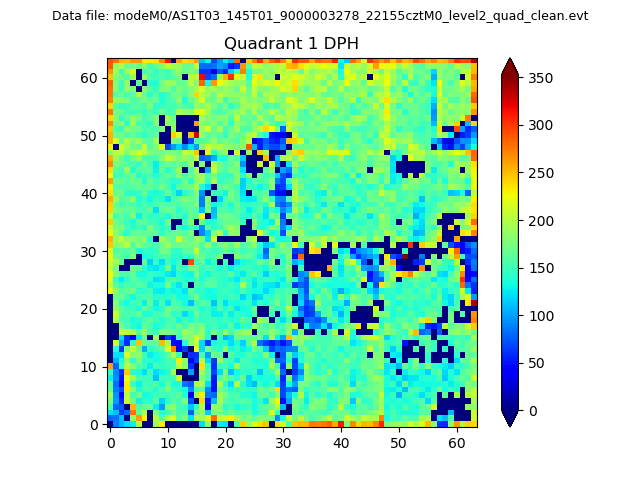 |
Quadrant B |
|---|---|---|---|
| Quadrant D | 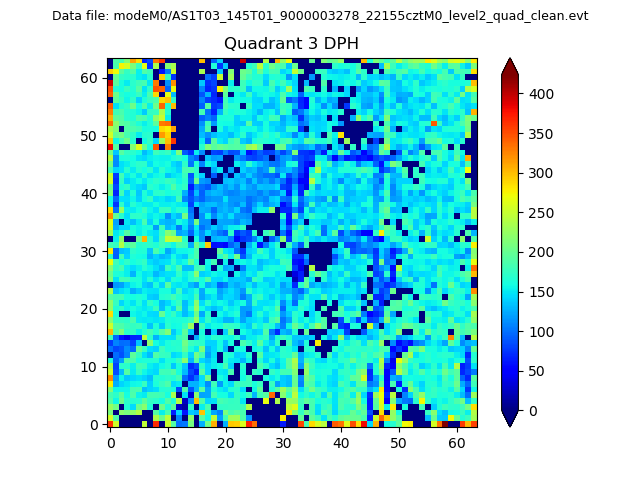 |
 |
Quadrant C |
| Plot type | Count rate plots | Images |
|---|---|---|
| Comparison with Poisson distribution Blue bars denote a histogram of data divided into 1 sec bins. Red curve is a Poisson curve with rate = median count rate of data. |
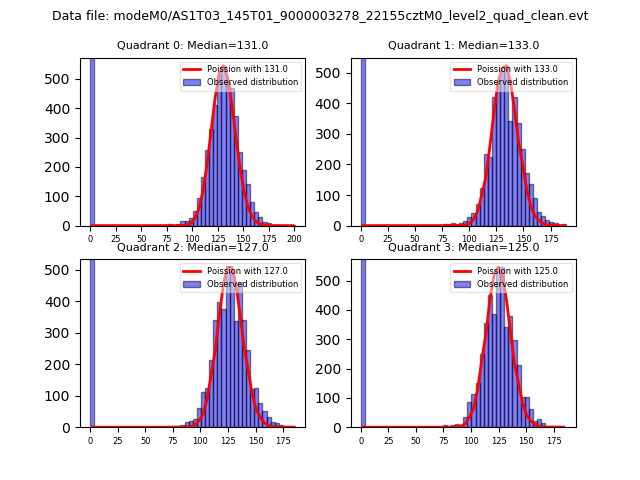 |
 |
| Quadrant-wise count rates Data is divided into 100 sec bins |
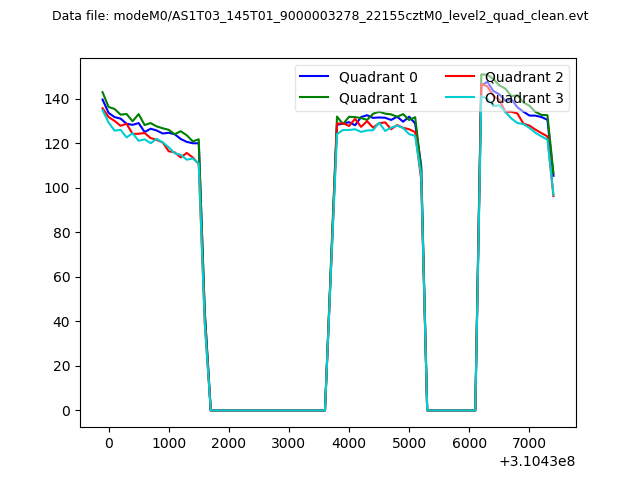 |
|
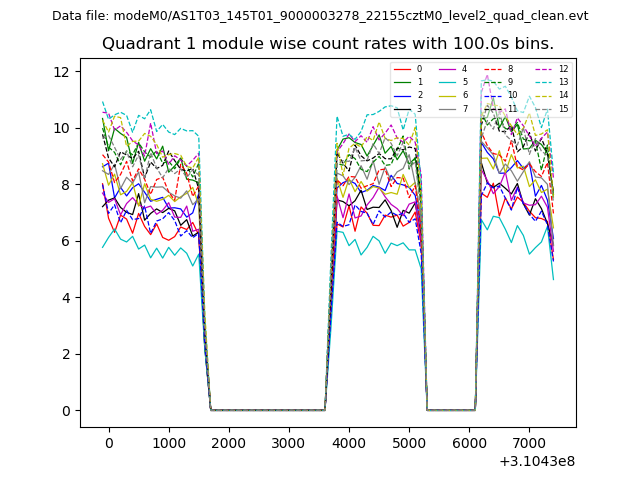
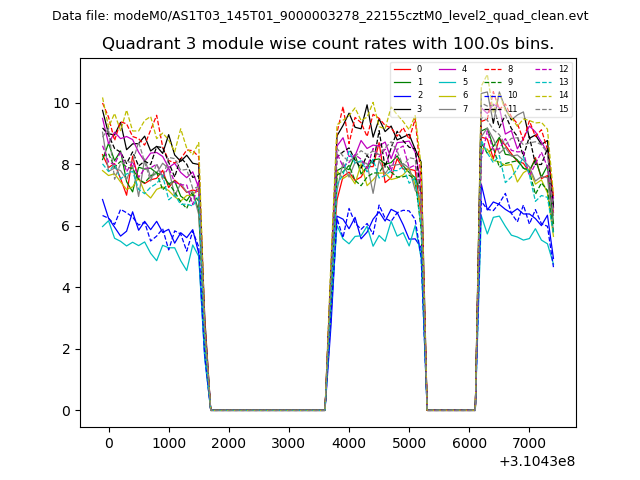
| Module-wise count rates for Quadrant A Data is divided into 100 sec bins |
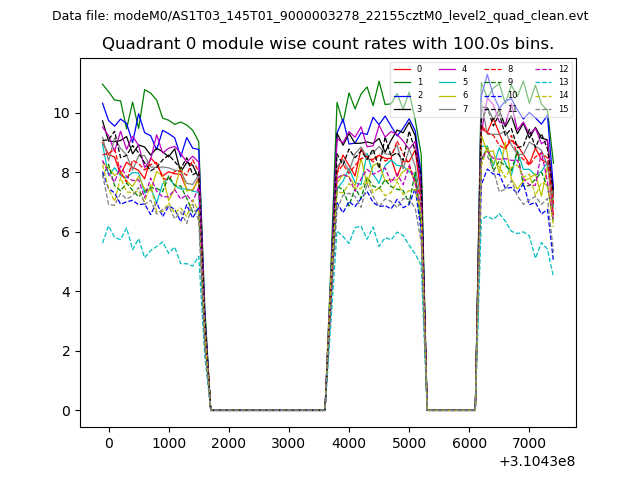 |
 |
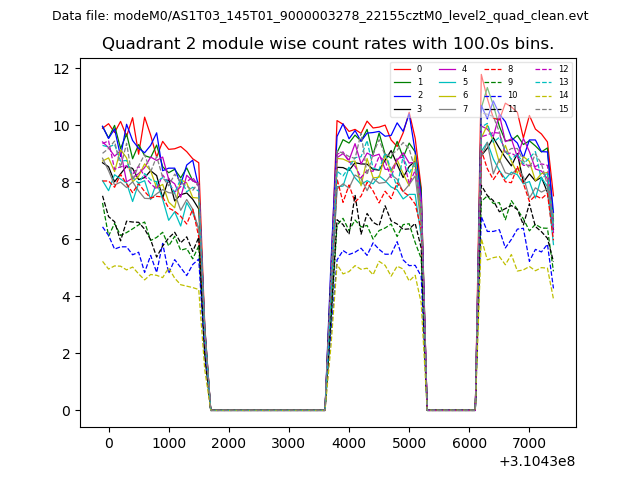
| Module-wise count rates for Quadrant B Data is divided into 100 sec bins |
 |
 |
| Module-wise count rates for Quadrant C Data is divided into 100 sec bins |
 |
 |
| Module-wise count rates for Quadrant D Data is divided into 100 sec bins |
 |
 |
| Parameter | Plot |
|---|---|
| CZT HV Monitor | 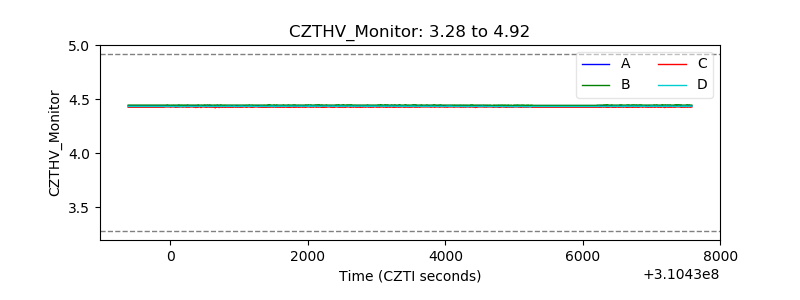 |
| D_VDD | 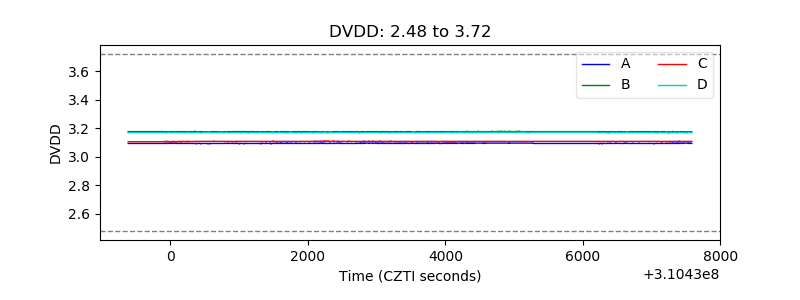 |
| Temperature 1 | 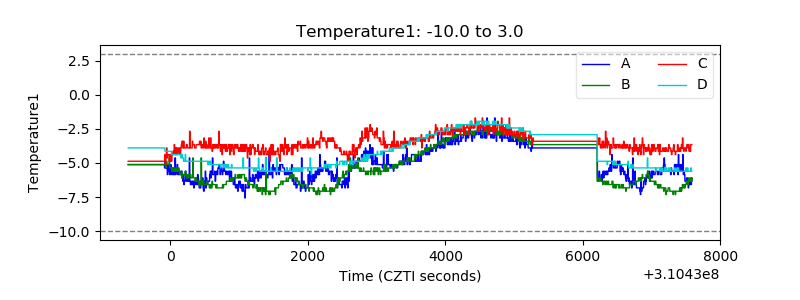 |
| Veto HV Monitor | 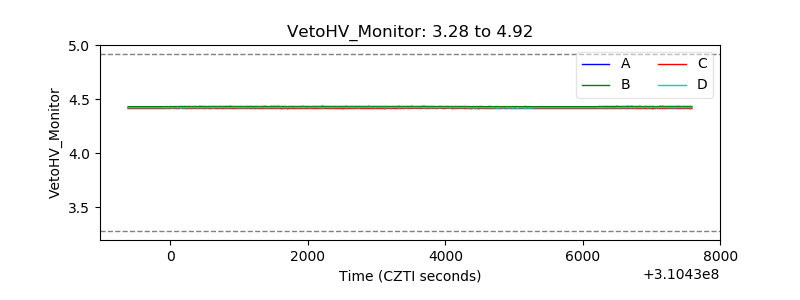 |
| Veto LLD | 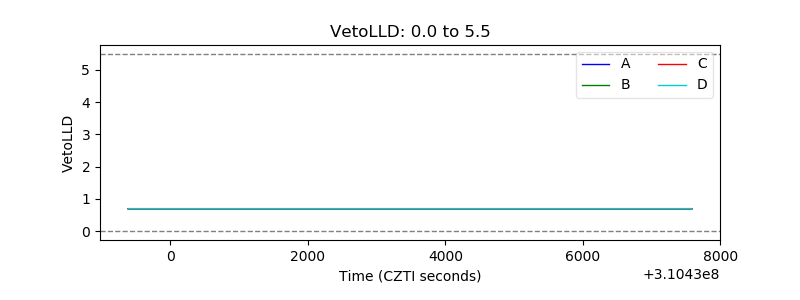 |
| Alpha Counter | 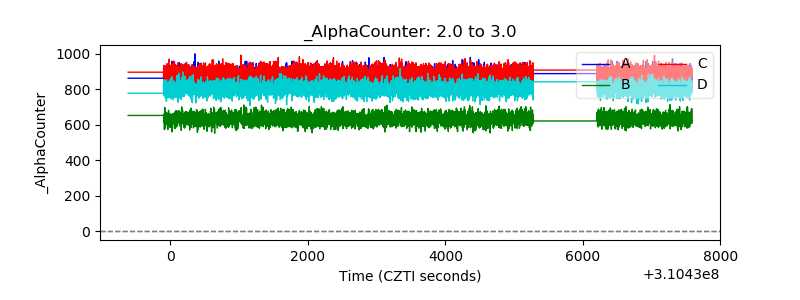 |
| _CPM_Rate | 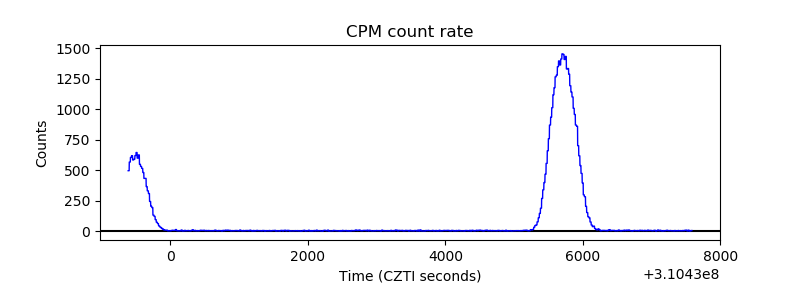 |
| CZT Counter | 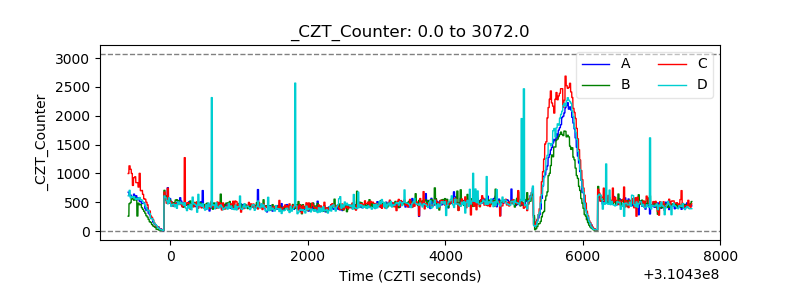 |
| +2.5 Volts monitor |  |
| +5 Volts monitor |  |
| _ROLL_ROT | 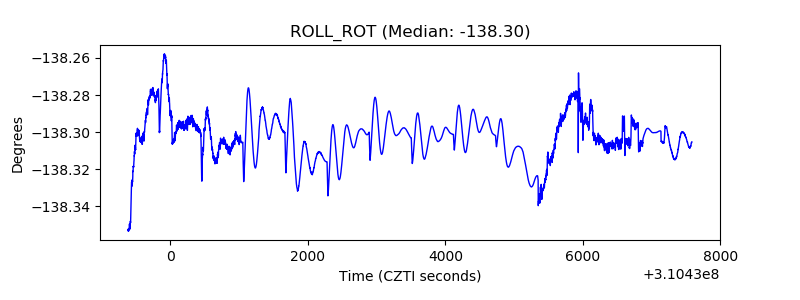 |
| _Roll_DEC | 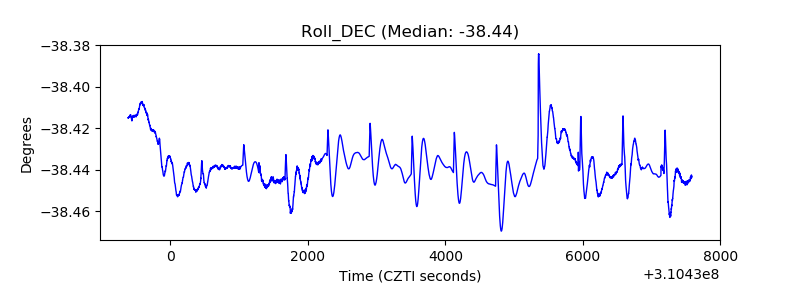 |
| _Roll_RA | 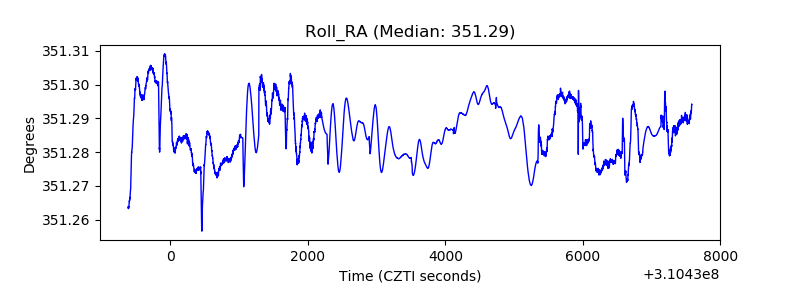 |
| Veto Counter | 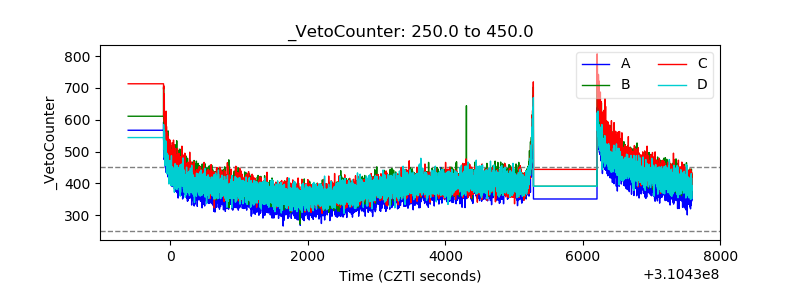 |