| Param | Original file | Final file |
|---|---|---|
| Filename | modeM0/AS1T03_145T01_9000003278_22156cztM0_level2.evt | modeM0/AS1T03_145T01_9000003278_22156cztM0_level2_quad_clean.evt |
| Size (bytes) | 475,251,840 | 97,194,240 |
| Size | 453.2 MB | 92.7 MB |
| Events in quadrant A | 3,394,425 | 618,278 |
| Events in quadrant B | 3,497,124 | 632,364 |
| Events in quadrant C | 3,468,989 | 603,772 |
| Events in quadrant D | 3,549,028 | 593,461 |
| Mode M0 | |||
|---|---|---|---|
| Quadrant | BADHDUFLAG | Total packets | Discarded packets |
| A | 0 | 14536 | 2 |
| B | 0 | 14750 | 2 |
| C | 0 | 14635 | 2 |
| D | 0 | 15244 | 2 |
| Mode SS | |||
|---|---|---|---|
| Quadrant | BADHDUFLAG | Total packets | Discarded packets |
| A | 0 | 146 | 0 |
| B | 0 | 146 | 0 |
| C | 0 | 146 | 0 |
| D | 0 | 146 | 0 |
| Mode M9 | |||
|---|---|---|---|
| Quadrant | BADHDUFLAG | Total packets | Discarded packets |
| A | 0 | 20 | 0 |
| B | 0 | 20 | 0 |
| C | 0 | 20 | 0 |
| D | 0 | 20 | 0 |
| Quadrant | Total seconds | Saturated seconds | Saturation percentage |
|---|---|---|---|
| A | 7117 | 22 | 0.309119% |
| B | 7118 | 42 | 0.590053% |
| C | 7118 | 60 | 0.842933% |
| D | 7118 | 47 | 0.660298% |
Noise dominated data is calculated using 1-second bins in cleaned event files. If a bin has >2000 counts, and if more than 50% of those come from <1% of pixels, then it is considered to be noise-dominated and hence unusable.
| Quadrant | # 1 sec bins | Bins with >0 counts | Bins with >2000 counts | High rate bins dominated by noise | Noise dominated (total time) | Noise dominated (detector-on time) | Marked lightcurve |
|---|---|---|---|---|---|---|---|
| A | 9123 | 7120 | 0 | 0 | 0.00% | 0.00% | 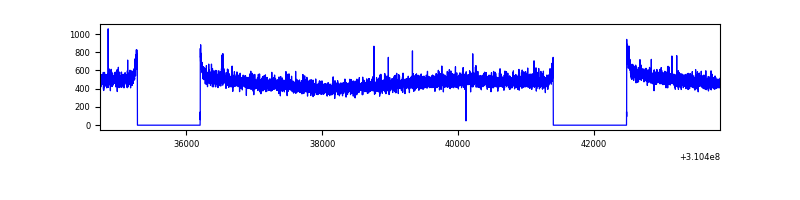 |
| B | 9124 | 7121 | 2 | 2 | 0.02% | 0.03% | 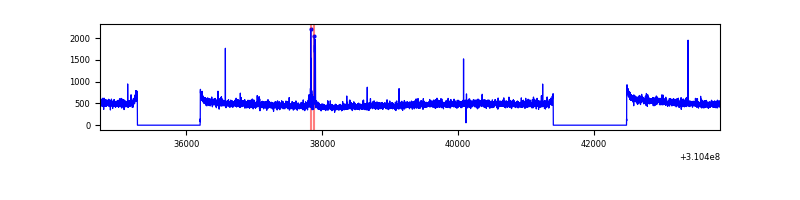 |
| C | 9124 | 7121 | 0 | 0 | 0.00% | 0.00% | 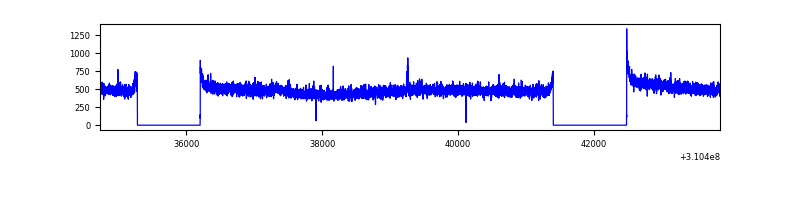 |
| D | 9124 | 7121 | 25 | 25 | 0.27% | 0.35% |  |
Top three noisy pixels from each quadrant. If the there are fewer than three noisy pixels in the level2.evt file, extra rows are filled as -1
| Pixel properties | Quadrant properties | ||||||
|---|---|---|---|---|---|---|---|
| Quadrant | DetID | PixID | Counts | Sigma | Mean | Median | Sigma |
| A | 3 | 1 | 12281 | 64.82 | 876 | 859 | 176.2 |
| A | 13 | 254 | 11850 | 62.37 | 876 | 859 | 176.2 |
| A | 3 | 137 | 7607 | 38.29 | 876 | 859 | 176.2 |
| B | 3 | 64 | 43135 | 251.53 | 880 | 858 | 168.1 |
| B | 12 | 111 | 20512 | 116.93 | 880 | 858 | 168.1 |
| B | 11 | 111 | 18491 | 104.91 | 880 | 858 | 168.1 |
| C | 14 | 238 | 135147 | 678.06 | 849 | 856 | 198.1 |
| C | 9 | 54 | 14176 | 67.26 | 849 | 856 | 198.1 |
| C | 13 | 61 | 5887 | 25.4 | 849 | 856 | 198.1 |
| D | 1 | 52 | 132403 | 634.69 | 856 | 831 | 207.3 |
| D | 10 | 230 | 73901 | 352.48 | 856 | 831 | 207.3 |
| D | 13 | 104 | 44195 | 209.18 | 856 | 831 | 207.3 |
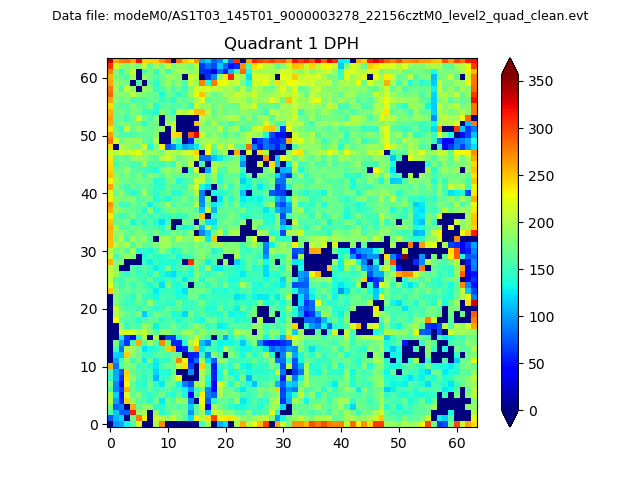
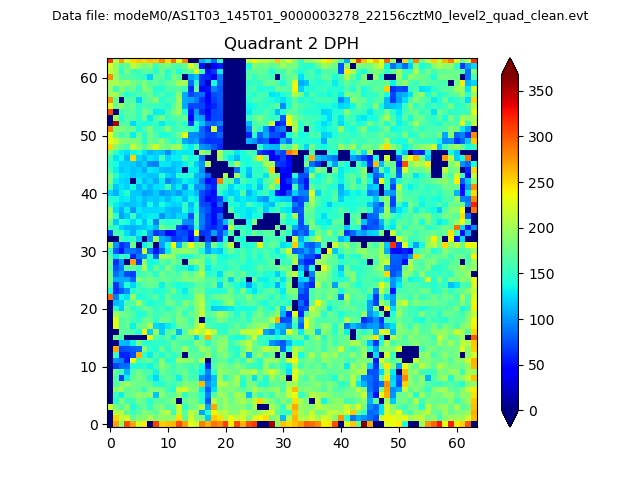
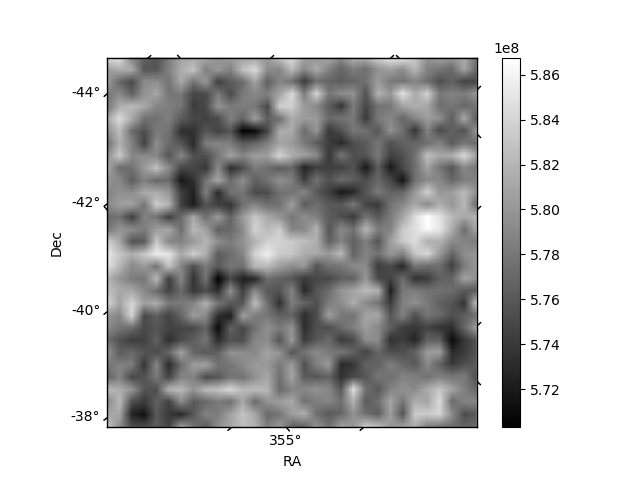
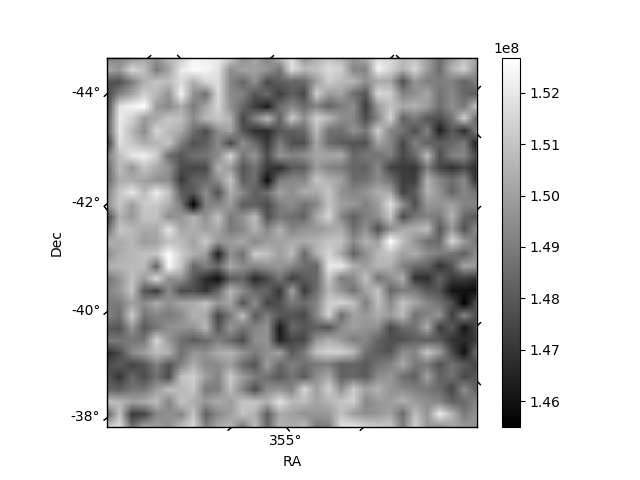
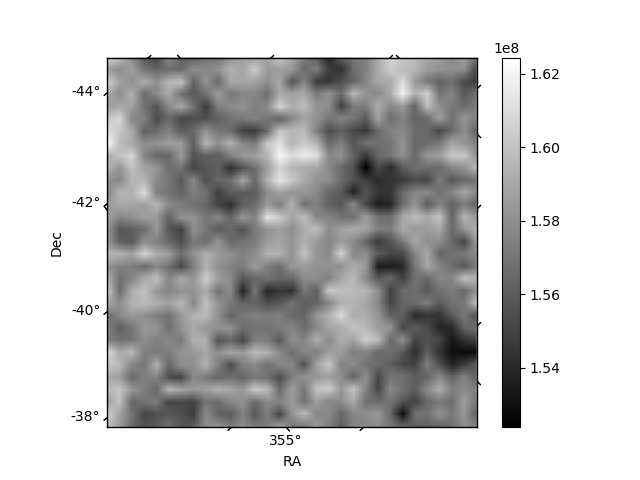
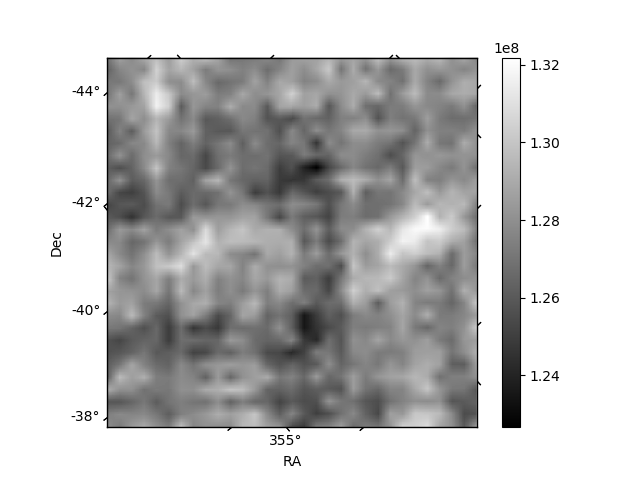
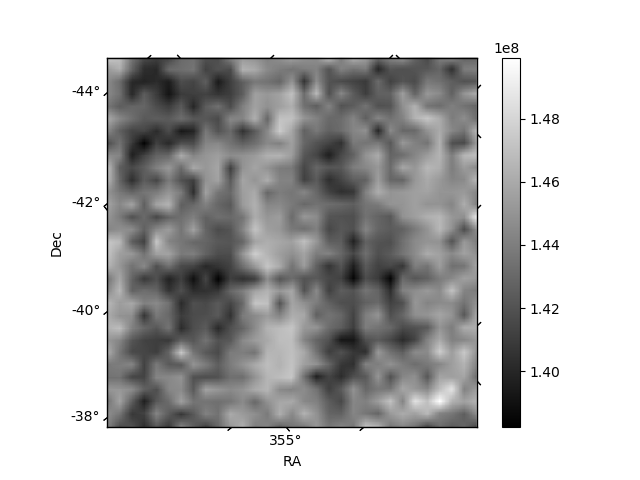
Histogram calculated using DETX and DETY for each event in the final _common_clean file
| Quadrant A | 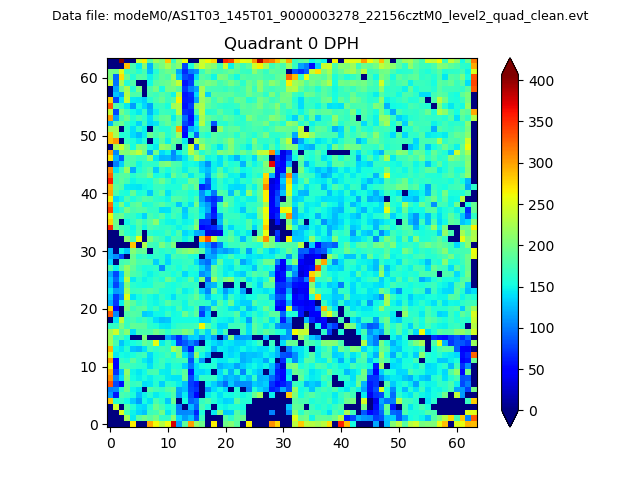 |
 |
Quadrant B |
|---|---|---|---|
| Quadrant D | 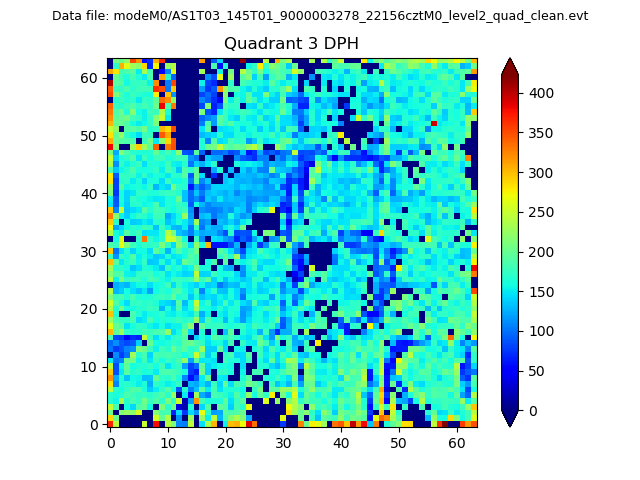 |
 |
Quadrant C |
| Plot type | Count rate plots | Images |
|---|---|---|
| Comparison with Poisson distribution Blue bars denote a histogram of data divided into 1 sec bins. Red curve is a Poisson curve with rate = median count rate of data. |
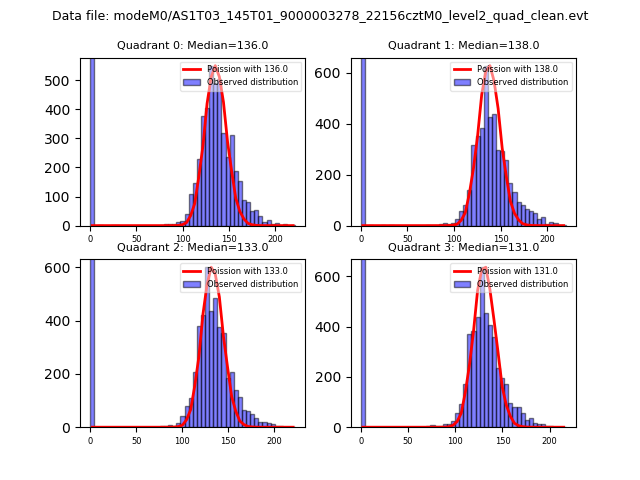 |
 |
| Quadrant-wise count rates Data is divided into 100 sec bins |
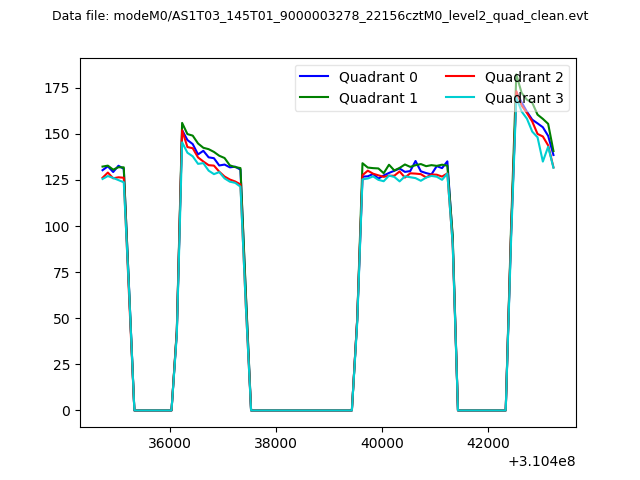 |
|
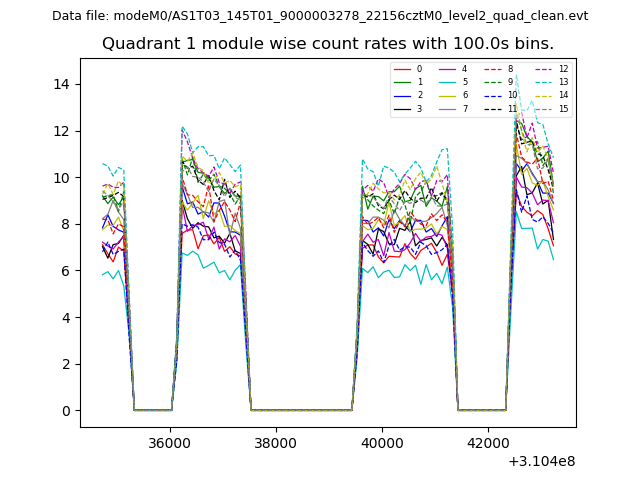
| Module-wise count rates for Quadrant A Data is divided into 100 sec bins |
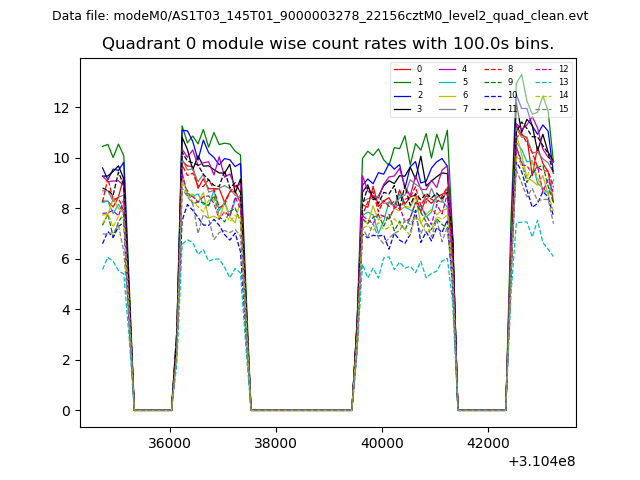 |
 |
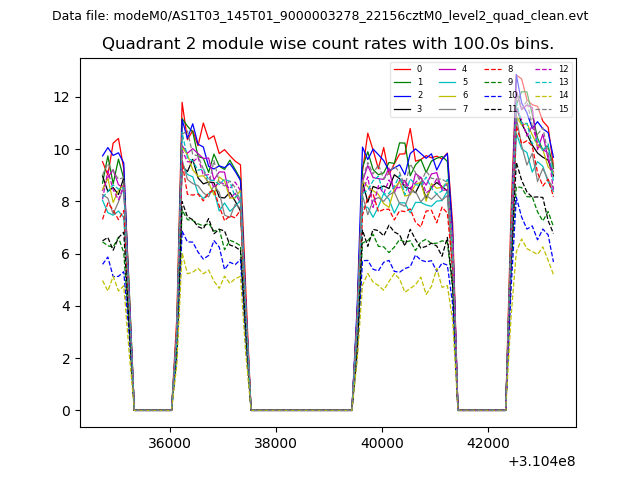
| Module-wise count rates for Quadrant B Data is divided into 100 sec bins |
 |
 |
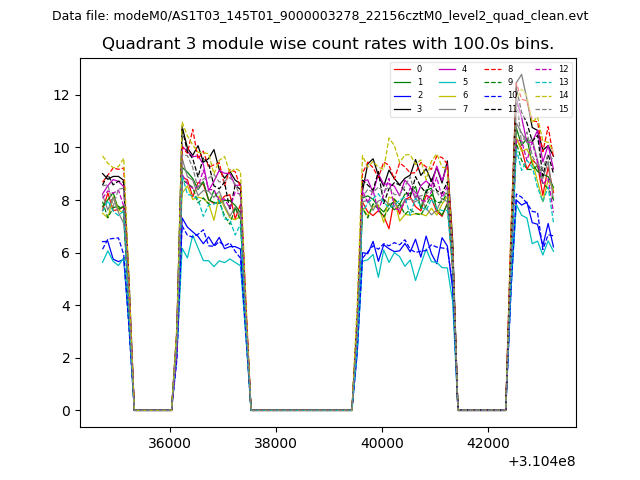
| Module-wise count rates for Quadrant C Data is divided into 100 sec bins |
 |
 |
| Module-wise count rates for Quadrant D Data is divided into 100 sec bins |
 |
 |
| Parameter | Plot |
|---|---|
| CZT HV Monitor | 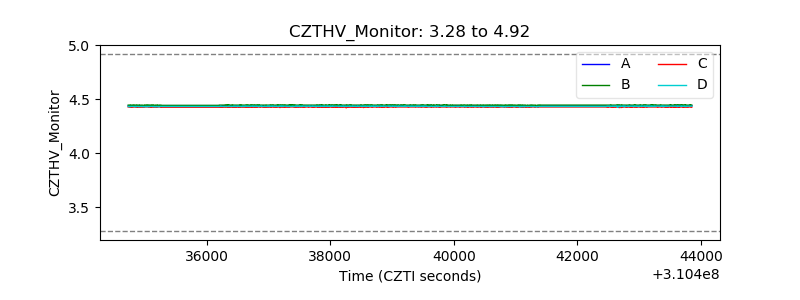 |
| D_VDD | 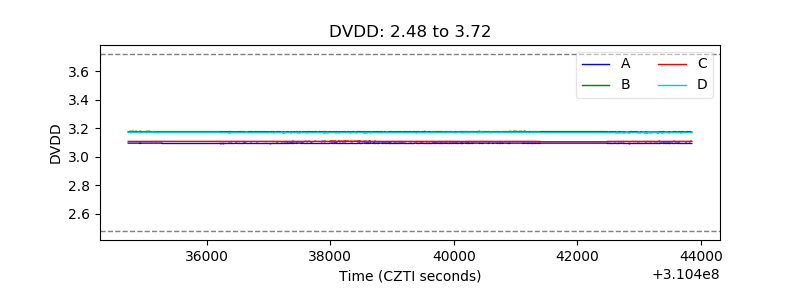 |
| Temperature 1 | 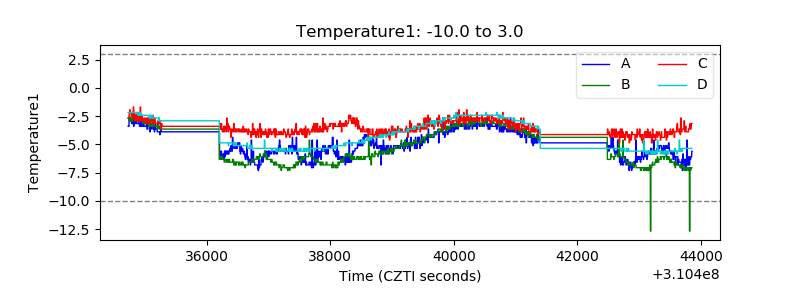 |
| Veto HV Monitor | 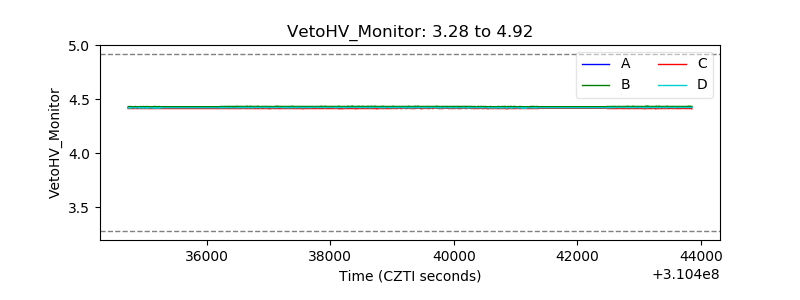 |
| Veto LLD | 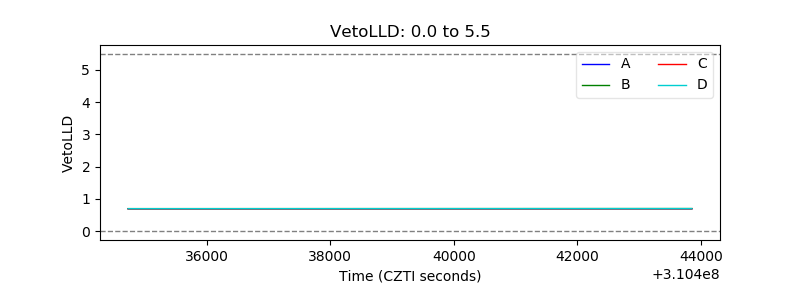 |
| Alpha Counter | 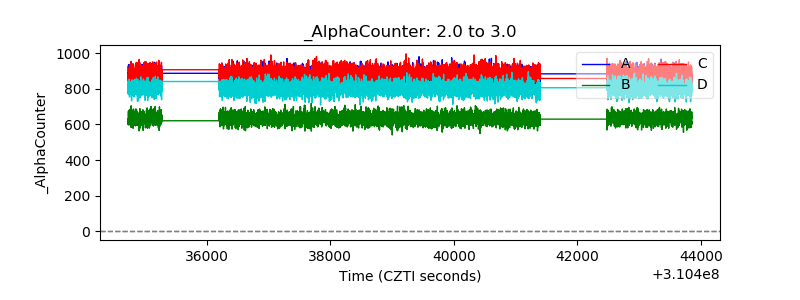 |
| _CPM_Rate | 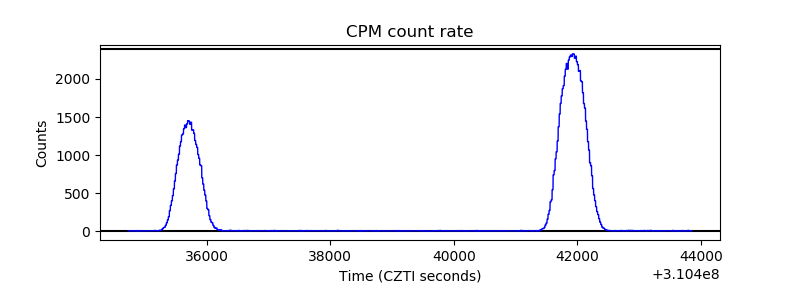 |
| CZT Counter | 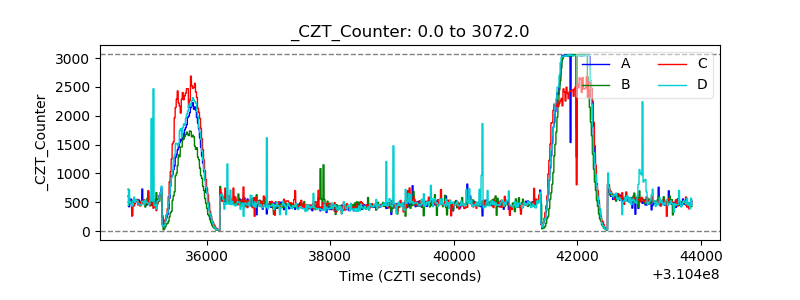 |
| +2.5 Volts monitor |  |
| +5 Volts monitor |  |
| _ROLL_ROT | 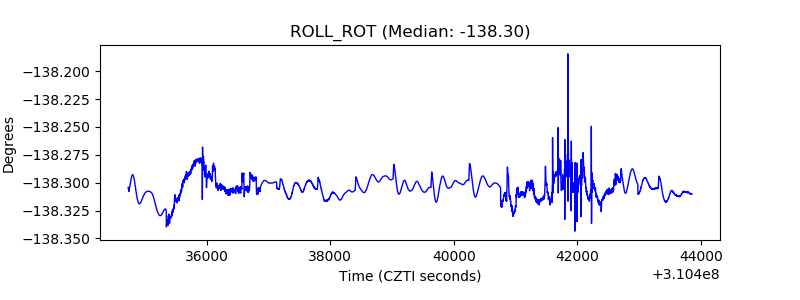 |
| _Roll_DEC | 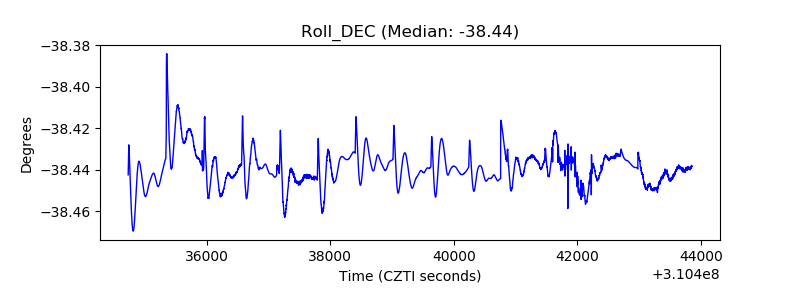 |
| _Roll_RA | 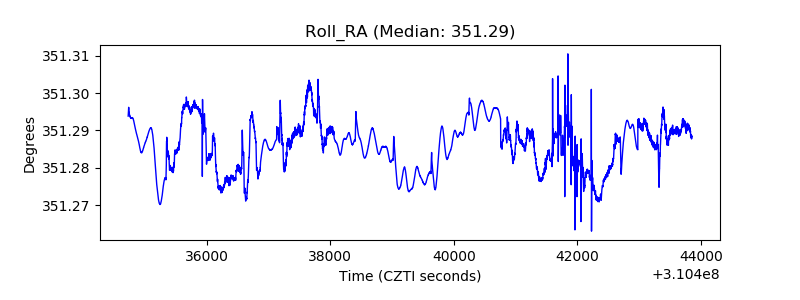 |
| Veto Counter | 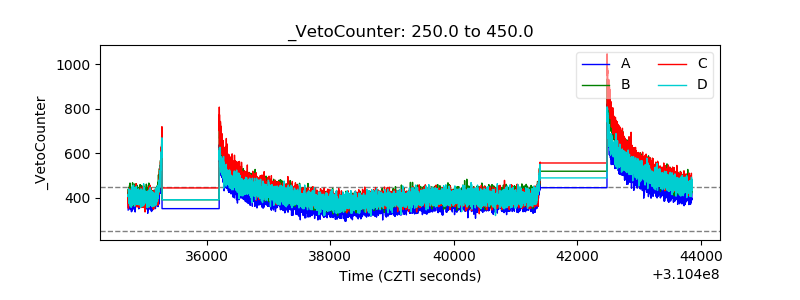 |