| Param | Original file | Final file |
|---|---|---|
| Filename | modeM0/AS1T03_145T01_9000003278_22158cztM0_level2.evt | modeM0/AS1T03_145T01_9000003278_22158cztM0_level2_quad_clean.evt |
| Size (bytes) | 460,342,080 | 81,092,160 |
| Size | 439.0 MB | 77.3 MB |
| Events in quadrant A | 3,223,519 | 504,115 |
| Events in quadrant B | 3,327,306 | 520,066 |
| Events in quadrant C | 3,320,604 | 498,597 |
| Events in quadrant D | 3,630,972 | 481,748 |
| Mode M0 | |||
|---|---|---|---|
| Quadrant | BADHDUFLAG | Total packets | Discarded packets |
| A | 0 | 13512 | 2 |
| B | 0 | 13824 | 2 |
| C | 0 | 13828 | 2 |
| D | 0 | 15033 | 2 |
| Mode SS | |||
|---|---|---|---|
| Quadrant | BADHDUFLAG | Total packets | Discarded packets |
| A | 0 | 134 | 0 |
| B | 0 | 134 | 0 |
| C | 0 | 134 | 0 |
| D | 0 | 134 | 0 |
| Mode M9 | |||
|---|---|---|---|
| Quadrant | BADHDUFLAG | Total packets | Discarded packets |
| A | 0 | 22 | 0 |
| B | 0 | 22 | 0 |
| C | 0 | 22 | 0 |
| D | 0 | 22 | 0 |
| Quadrant | Total seconds | Saturated seconds | Saturation percentage |
|---|---|---|---|
| A | 6460 | 38 | 0.588235% |
| B | 6460 | 59 | 0.913313% |
| C | 6460 | 86 | 1.331269% |
| D | 6461 | 149 | 2.306145% |
Noise dominated data is calculated using 1-second bins in cleaned event files. If a bin has >2000 counts, and if more than 50% of those come from <1% of pixels, then it is considered to be noise-dominated and hence unusable.
| Quadrant | # 1 sec bins | Bins with >0 counts | Bins with >2000 counts | High rate bins dominated by noise | Noise dominated (total time) | Noise dominated (detector-on time) | Marked lightcurve |
|---|---|---|---|---|---|---|---|
| A | 8705 | 6462 | 0 | 0 | 0.00% | 0.00% | 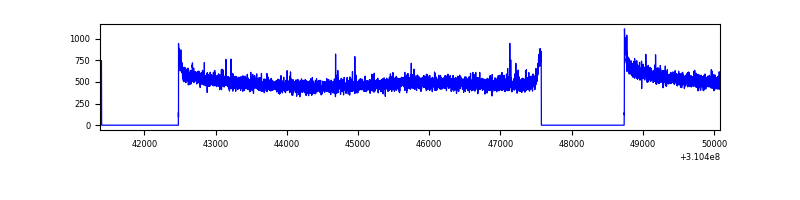 |
| B | 8705 | 6462 | 2 | 2 | 0.02% | 0.03% | 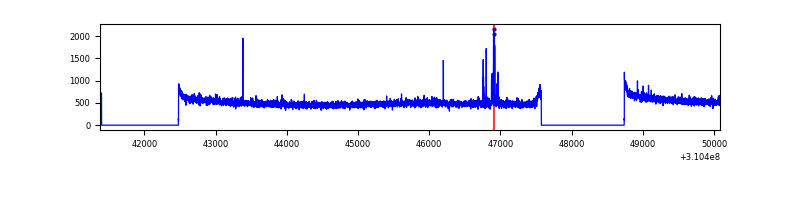 |
| C | 8705 | 6462 | 0 | 0 | 0.00% | 0.00% | 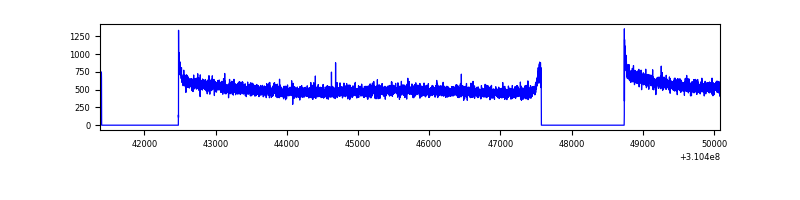 |
| D | 8706 | 6463 | 103 | 103 | 1.18% | 1.59% | 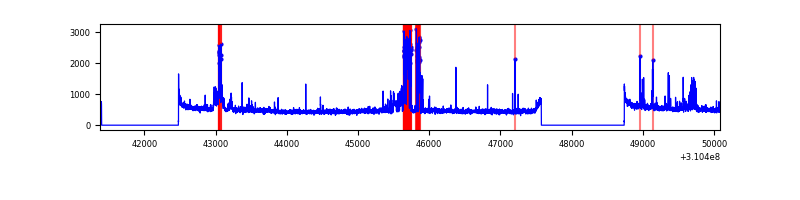 |
Top three noisy pixels from each quadrant. If the there are fewer than three noisy pixels in the level2.evt file, extra rows are filled as -1
| Pixel properties | Quadrant properties | ||||||
|---|---|---|---|---|---|---|---|
| Quadrant | DetID | PixID | Counts | Sigma | Mean | Median | Sigma |
| A | 13 | 254 | 9640 | 53.21 | 836 | 821 | 165.7 |
| A | 0 | 226 | 7075 | 37.73 | 836 | 821 | 165.7 |
| A | 3 | 137 | 7008 | 37.33 | 836 | 821 | 165.7 |
| B | 10 | 246 | 38765 | 240.89 | 838 | 818 | 157.5 |
| B | 12 | 111 | 18830 | 114.34 | 838 | 818 | 157.5 |
| B | 11 | 111 | 16762 | 101.21 | 838 | 818 | 157.5 |
| C | 14 | 238 | 130483 | 687.02 | 817 | 825 | 188.7 |
| C | 13 | 61 | 5538 | 24.97 | 817 | 825 | 188.7 |
| C | 0 | 10 | 3755 | 15.52 | 817 | 825 | 188.7 |
| D | 1 | 52 | 365935 | 1857.39 | 818 | 796 | 196.6 |
| D | 10 | 230 | 119958 | 606.15 | 818 | 796 | 196.6 |
| D | 2 | 136 | 32848 | 163.04 | 818 | 796 | 196.6 |
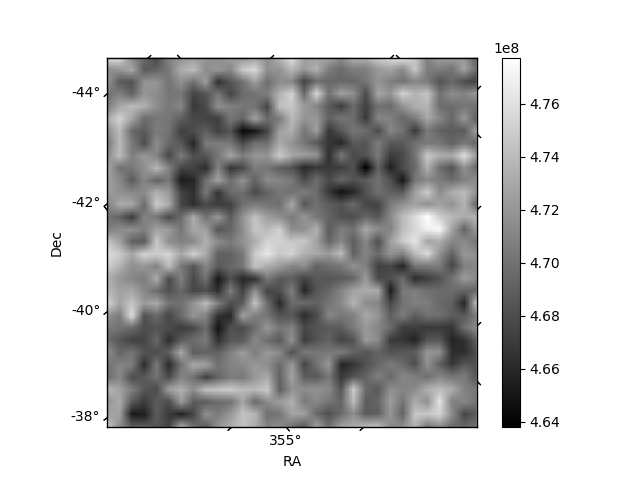
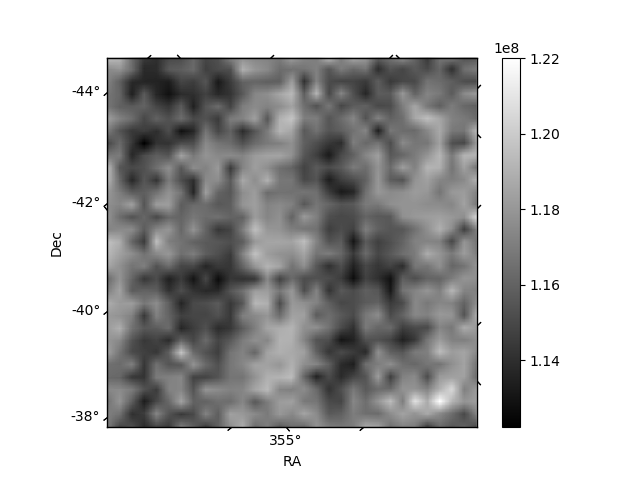
Histogram calculated using DETX and DETY for each event in the final _common_clean file
| Quadrant A | 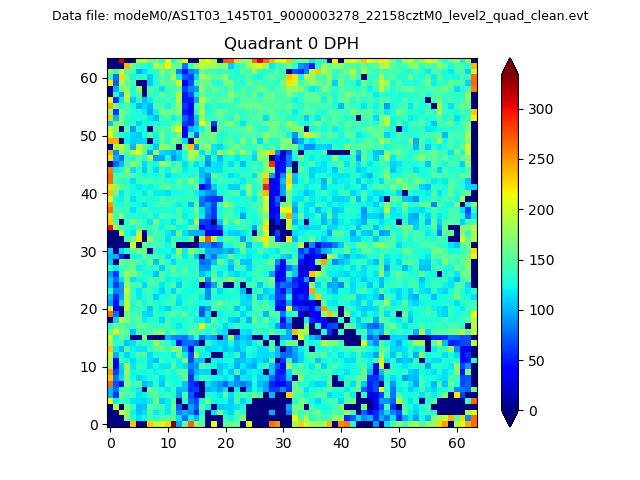 |
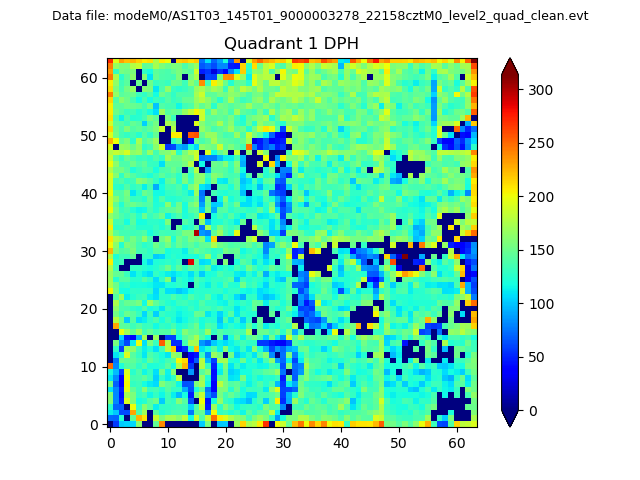 |
Quadrant B |
|---|---|---|---|
| Quadrant D | 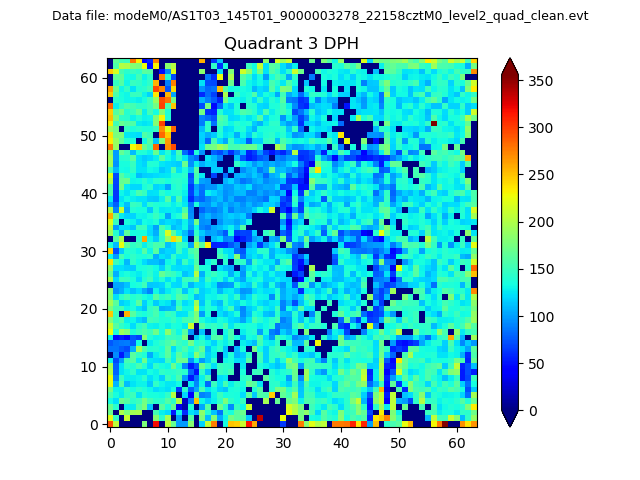 |
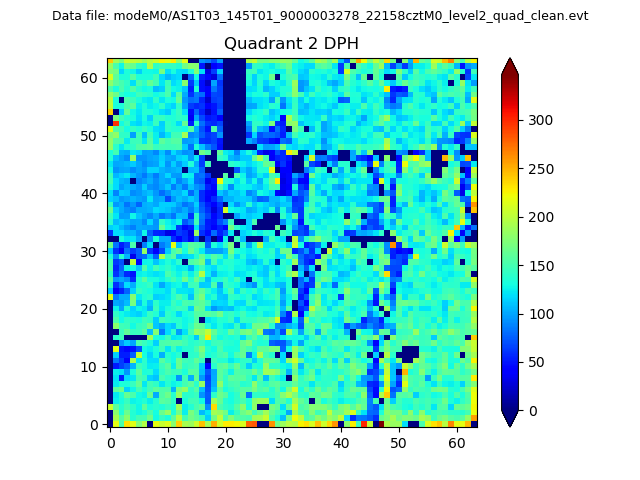 |
Quadrant C |
| Plot type | Count rate plots | Images |
|---|---|---|
| Comparison with Poisson distribution Blue bars denote a histogram of data divided into 1 sec bins. Red curve is a Poisson curve with rate = median count rate of data. |
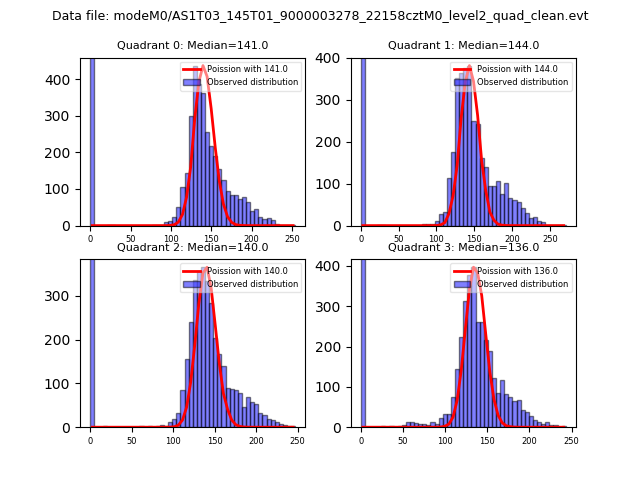 |
 |
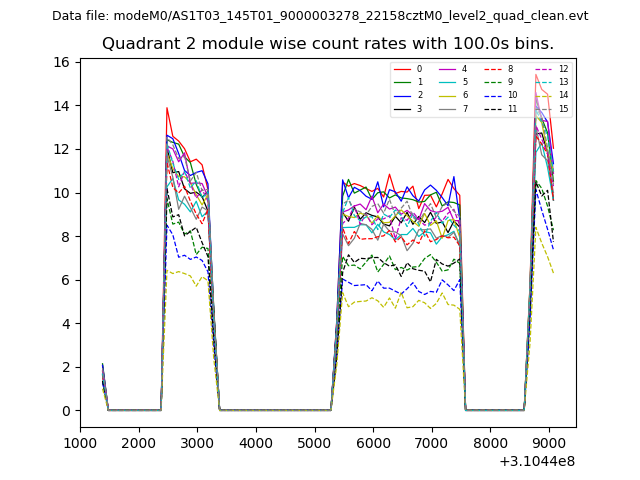
| Quadrant-wise count rates Data is divided into 100 sec bins |
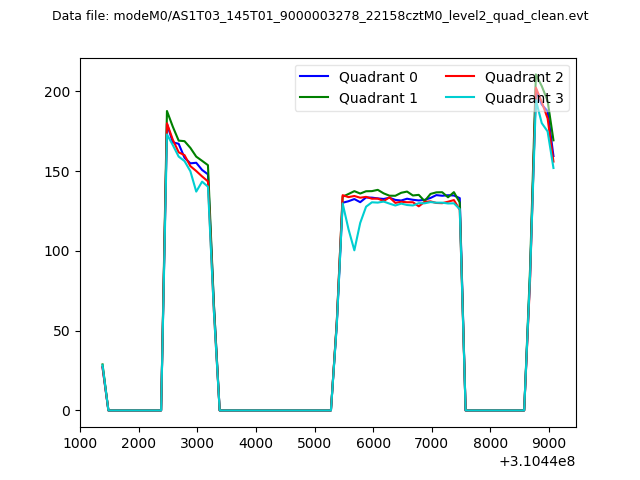 |
|
| Module-wise count rates for Quadrant A Data is divided into 100 sec bins |
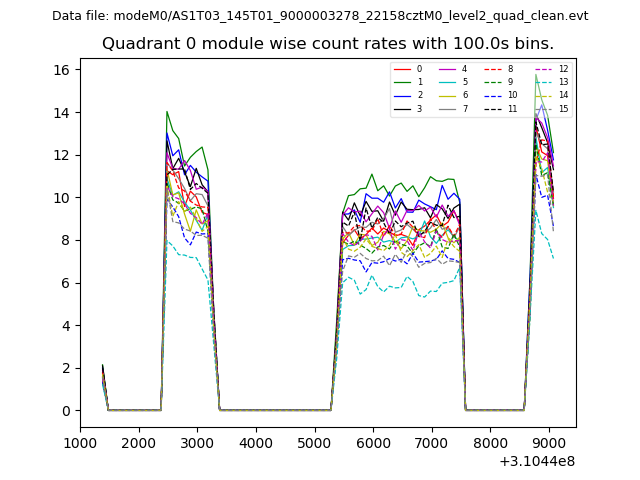 |
 |
| Module-wise count rates for Quadrant B Data is divided into 100 sec bins |
 |
 |
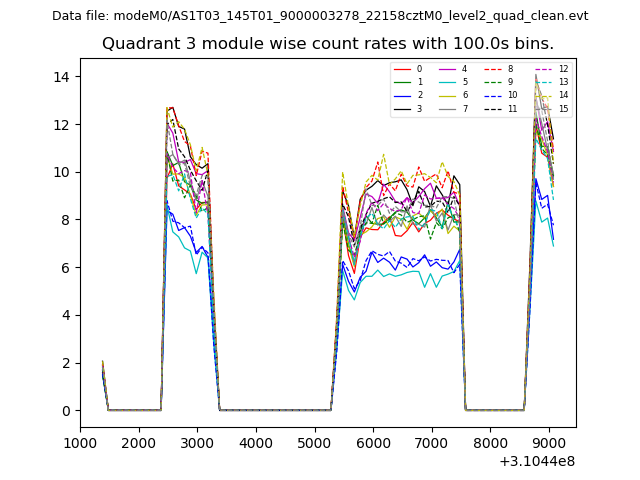
| Module-wise count rates for Quadrant C Data is divided into 100 sec bins |
 |
 |
| Module-wise count rates for Quadrant D Data is divided into 100 sec bins |
 |
 |
| Parameter | Plot |
|---|---|
| CZT HV Monitor | 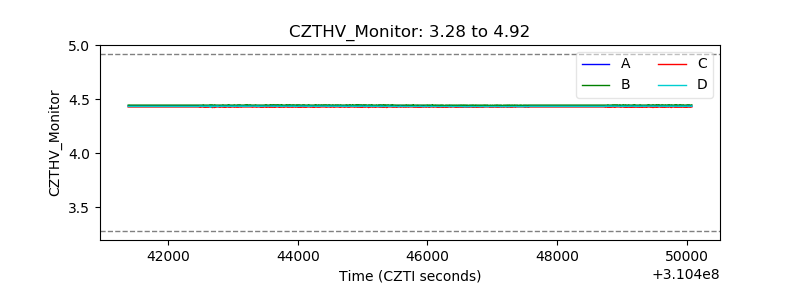 |
| D_VDD | 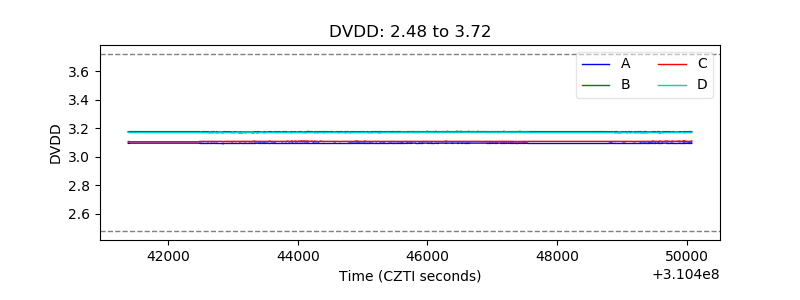 |
| Temperature 1 | 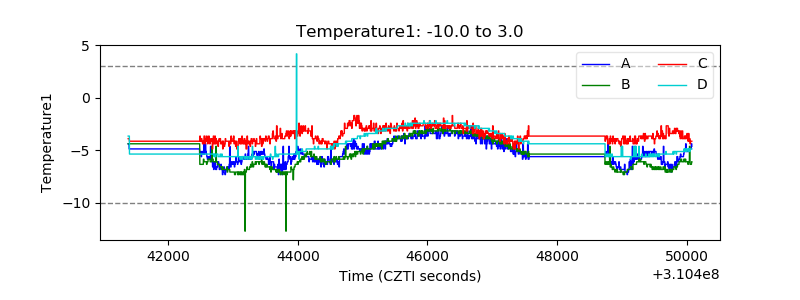 |
| Veto HV Monitor | 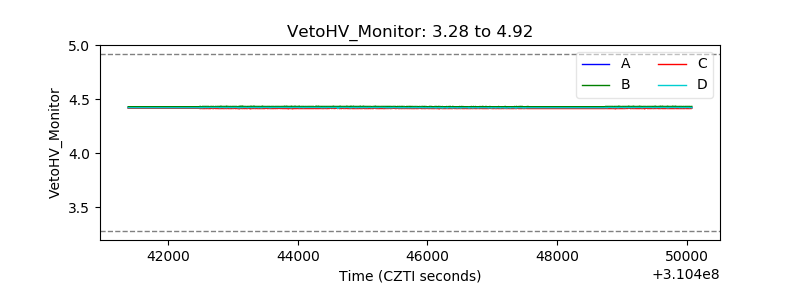 |
| Veto LLD | 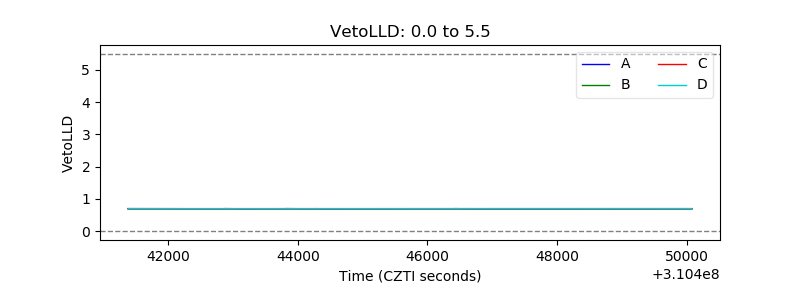 |
| Alpha Counter | 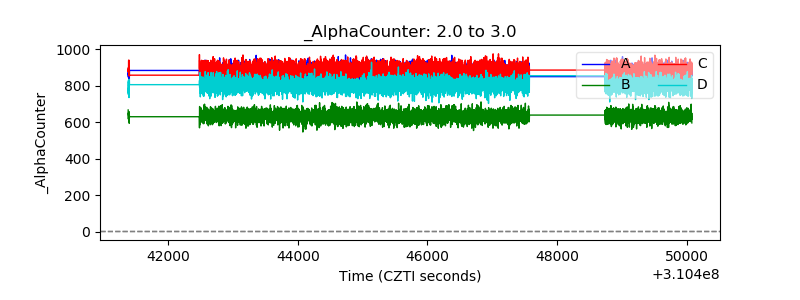 |
| _CPM_Rate | 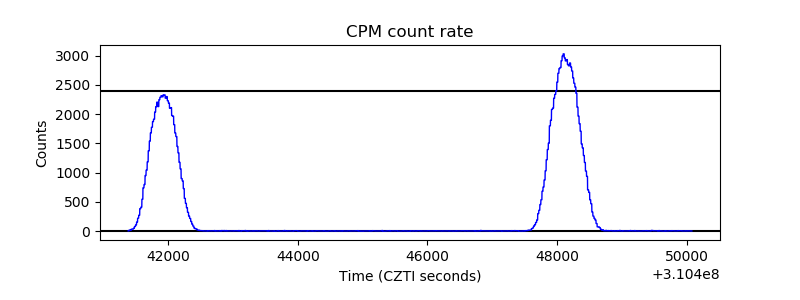 |
| CZT Counter | 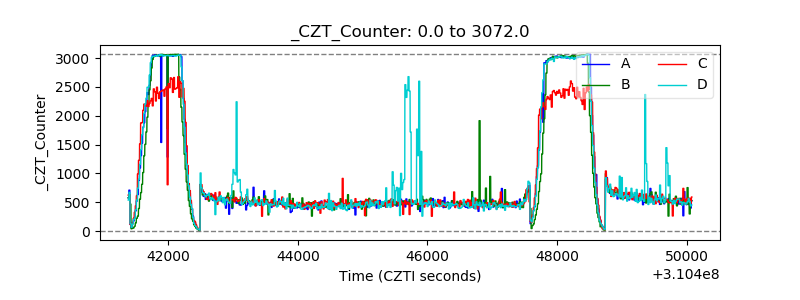 |
| +2.5 Volts monitor | 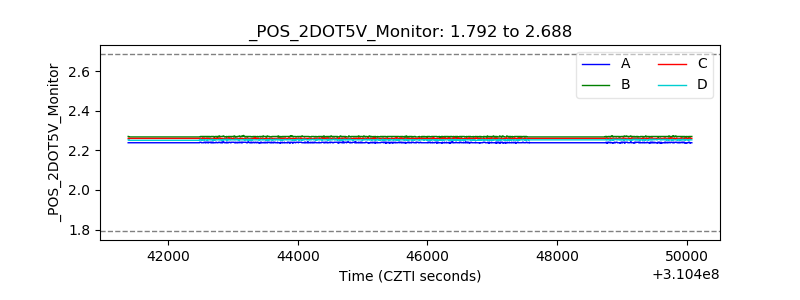 |
| +5 Volts monitor |  |
| _ROLL_ROT | 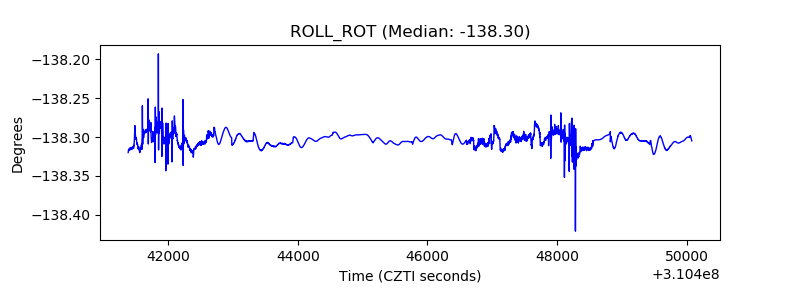 |
| _Roll_DEC | 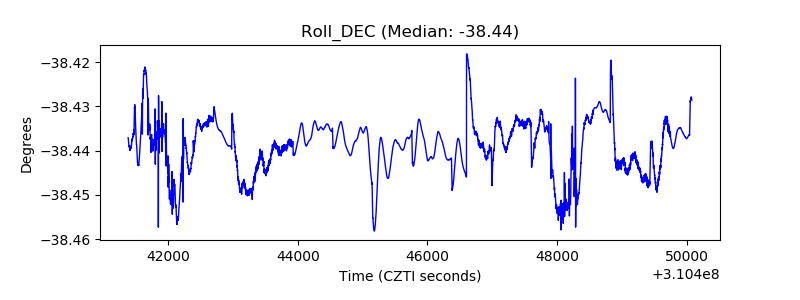 |
| _Roll_RA | 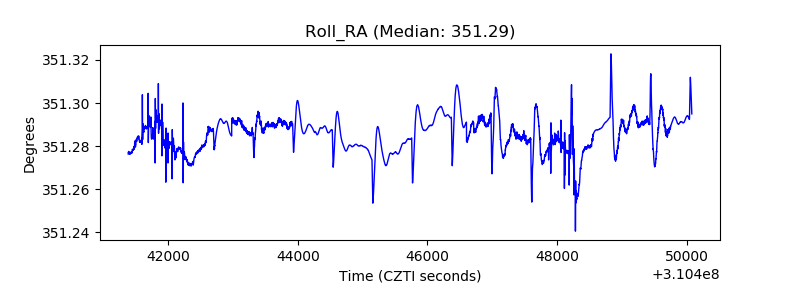 |
| Veto Counter | 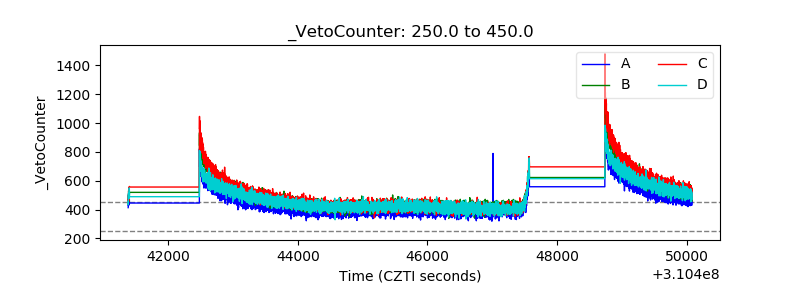 |