| Param | Original file | Final file |
|---|---|---|
| Filename | modeM0/AS1T03_145T01_9000003278_22160cztM0_level2.evt | modeM0/AS1T03_145T01_9000003278_22160cztM0_level2_quad_clean.evt |
| Size (bytes) | 536,751,360 | 67,420,800 |
| Size | 511.9 MB | 64.3 MB |
| Events in quadrant A | 3,423,224 | 408,864 |
| Events in quadrant B | 3,501,131 | 418,786 |
| Events in quadrant C | 3,517,489 | 404,182 |
| Events in quadrant D | 5,386,862 | 369,866 |
| Mode M0 | |||
|---|---|---|---|
| Quadrant | BADHDUFLAG | Total packets | Discarded packets |
| A | 0 | 13944 | 2 |
| B | 0 | 14229 | 2 |
| C | 0 | 14424 | 2 |
| D | 0 | 20010 | 2 |
| Mode SS | |||
|---|---|---|---|
| Quadrant | BADHDUFLAG | Total packets | Discarded packets |
| A | 0 | 128 | 0 |
| B | 0 | 128 | 0 |
| C | 0 | 128 | 0 |
| D | 0 | 128 | 0 |
| Mode M9 | |||
|---|---|---|---|
| Quadrant | BADHDUFLAG | Total packets | Discarded packets |
| A | 0 | 19 | 0 |
| B | 0 | 20 | 0 |
| C | 0 | 20 | 0 |
| D | 0 | 20 | 0 |
| Quadrant | Total seconds | Saturated seconds | Saturation percentage |
|---|---|---|---|
| A | 6296 | 76 | 1.207116% |
| B | 6296 | 101 | 1.604193% |
| C | 6295 | 149 | 2.366958% |
| D | 6295 | 593 | 9.420175% |
Noise dominated data is calculated using 1-second bins in cleaned event files. If a bin has >2000 counts, and if more than 50% of those come from <1% of pixels, then it is considered to be noise-dominated and hence unusable.
| Quadrant | # 1 sec bins | Bins with >0 counts | Bins with >2000 counts | High rate bins dominated by noise | Noise dominated (total time) | Noise dominated (detector-on time) | Marked lightcurve |
|---|---|---|---|---|---|---|---|
| A | 7586 | 6297 | 0 | 0 | 0.00% | 0.00% | 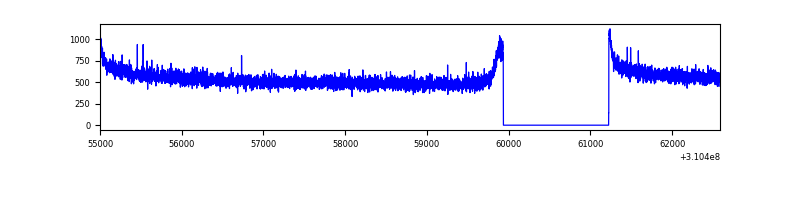 |
| B | 7586 | 6297 | 1 | 1 | 0.01% | 0.02% | 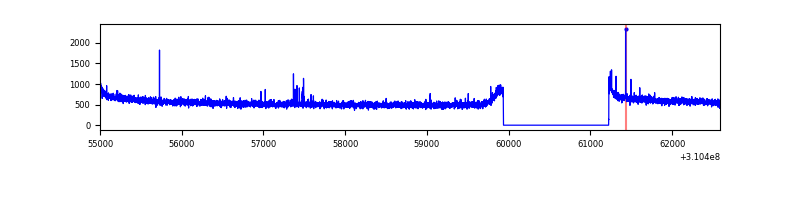 |
| C | 7585 | 6296 | 0 | 0 | 0.00% | 0.00% | 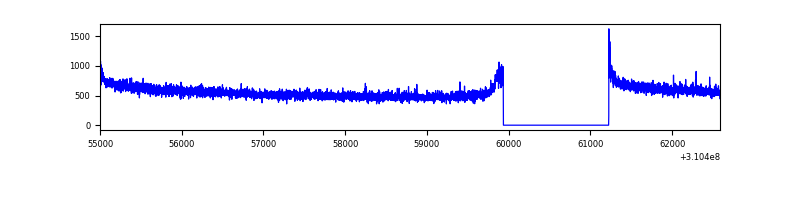 |
| D | 7585 | 6296 | 454 | 454 | 5.99% | 7.21% | 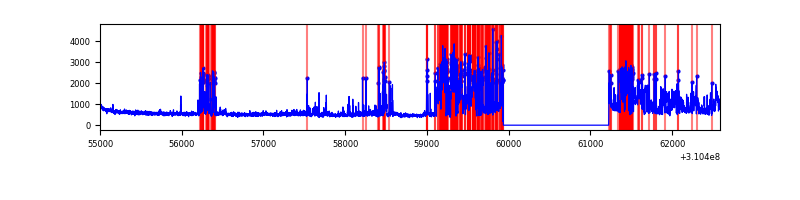 |
Top three noisy pixels from each quadrant. If the there are fewer than three noisy pixels in the level2.evt file, extra rows are filled as -1
| Pixel properties | Quadrant properties | ||||||
|---|---|---|---|---|---|---|---|
| Quadrant | DetID | PixID | Counts | Sigma | Mean | Median | Sigma |
| A | 13 | 254 | 10474 | 54.85 | 888 | 873 | 175.1 |
| A | 0 | 226 | 7707 | 39.04 | 888 | 873 | 175.1 |
| A | 3 | 137 | 6848 | 34.13 | 888 | 873 | 175.1 |
| B | 12 | 111 | 19151 | 111.37 | 890 | 869 | 164.1 |
| B | 11 | 111 | 17321 | 100.22 | 890 | 869 | 164.1 |
| B | 14 | 111 | 15754 | 90.68 | 890 | 869 | 164.1 |
| C | 14 | 238 | 139392 | 705.12 | 863 | 874 | 196.4 |
| C | 9 | 54 | 8425 | 38.44 | 863 | 874 | 196.4 |
| C | 13 | 61 | 5786 | 25.0 | 863 | 874 | 196.4 |
| D | 1 | 52 | 2062056 | 10376.23 | 839 | 818 | 198.7 |
| D | 2 | 136 | 160548 | 804.08 | 839 | 818 | 198.7 |
| D | 2 | 234 | 22285 | 108.06 | 839 | 818 | 198.7 |
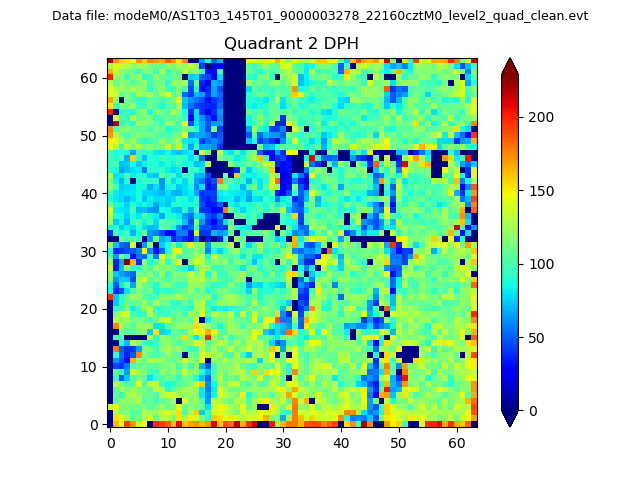
Histogram calculated using DETX and DETY for each event in the final _common_clean file
| Quadrant A | 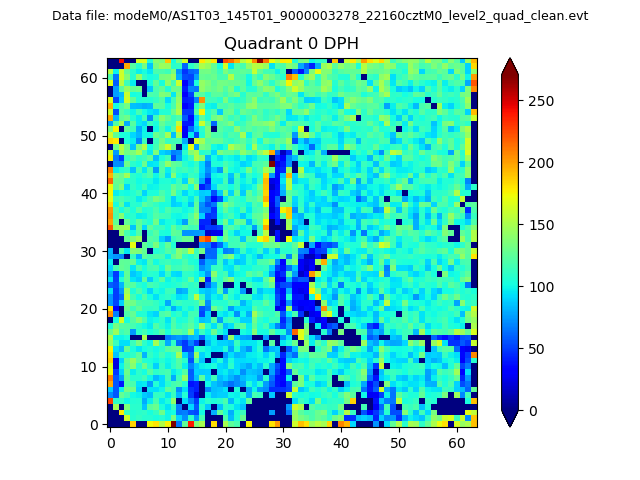 |
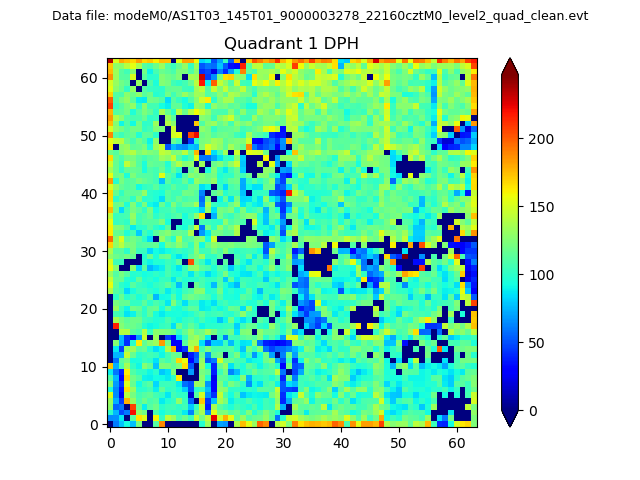 |
Quadrant B |
|---|---|---|---|
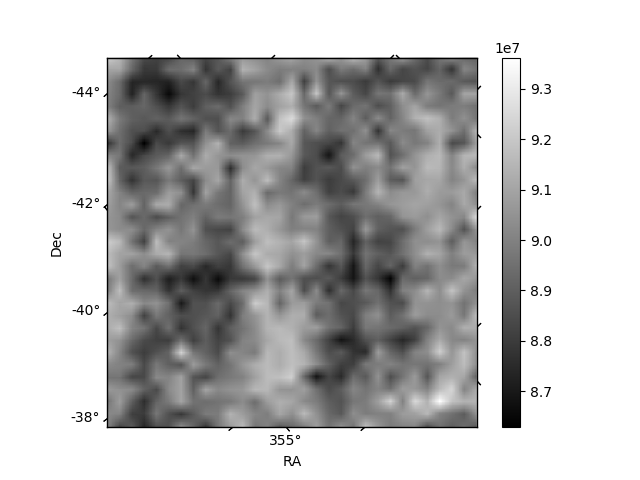
| Quadrant D | 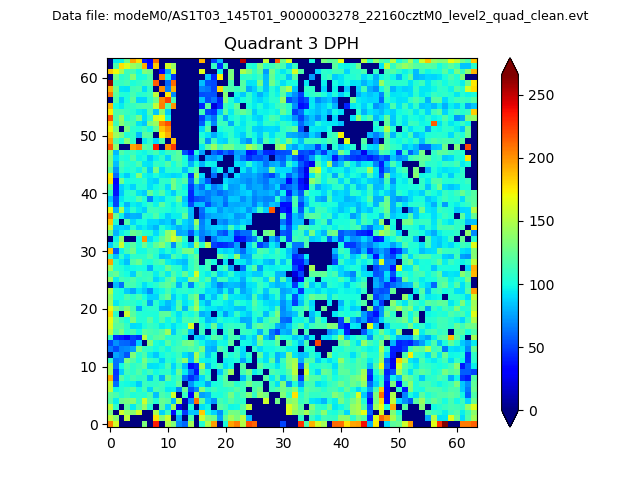 |
 |
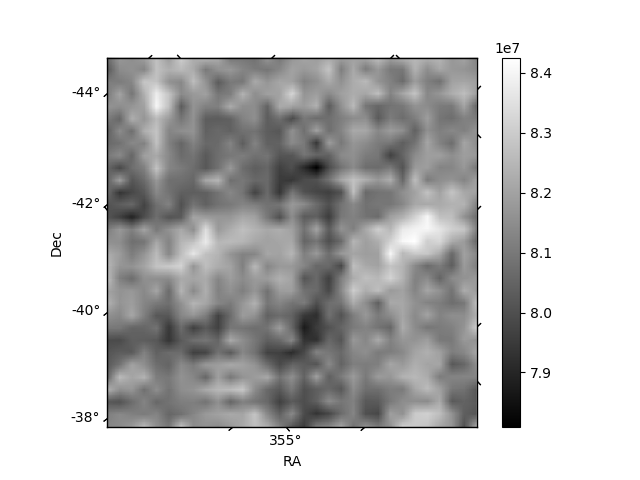
Quadrant C |
| Plot type | Count rate plots | Images |
|---|---|---|
| Comparison with Poisson distribution Blue bars denote a histogram of data divided into 1 sec bins. Red curve is a Poisson curve with rate = median count rate of data. |
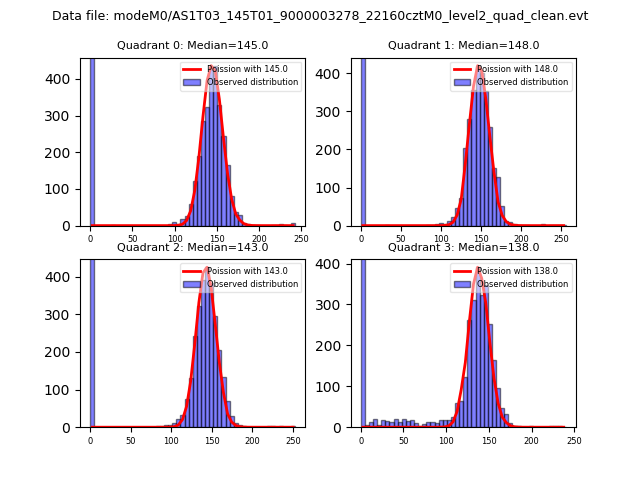 |
 |
| Quadrant-wise count rates Data is divided into 100 sec bins |
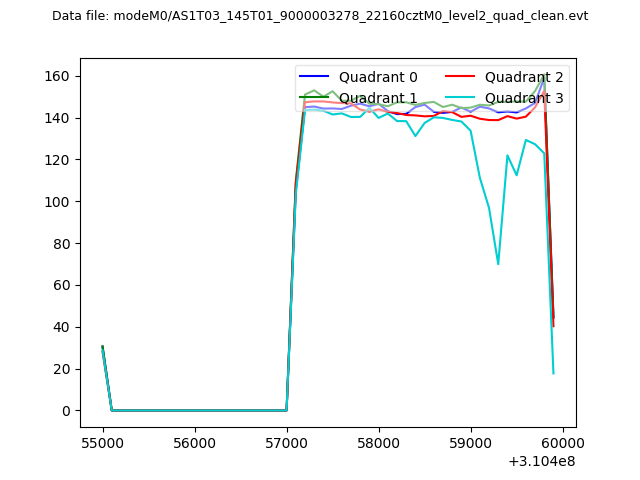 |
|
| Module-wise count rates for Quadrant A Data is divided into 100 sec bins |
 |
 |
| Module-wise count rates for Quadrant B Data is divided into 100 sec bins |
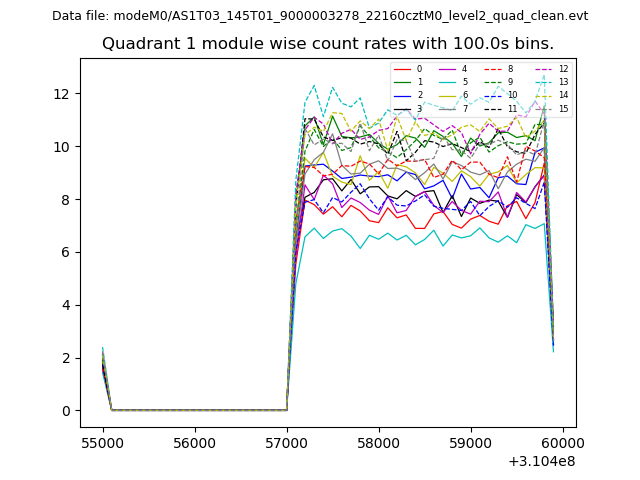 |
 |
| Module-wise count rates for Quadrant C Data is divided into 100 sec bins |
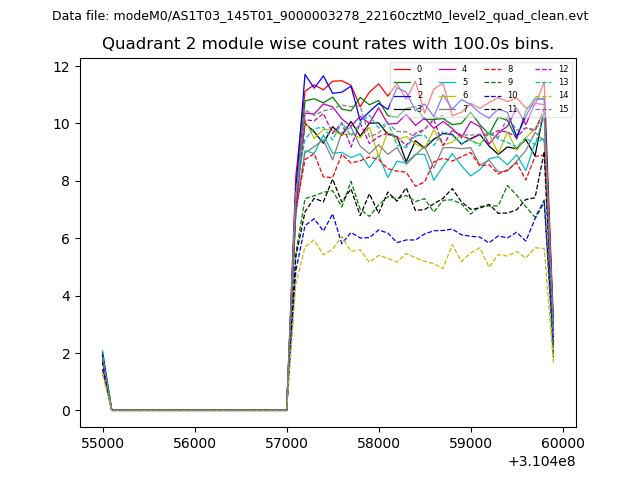 |
 |
| Module-wise count rates for Quadrant D Data is divided into 100 sec bins |
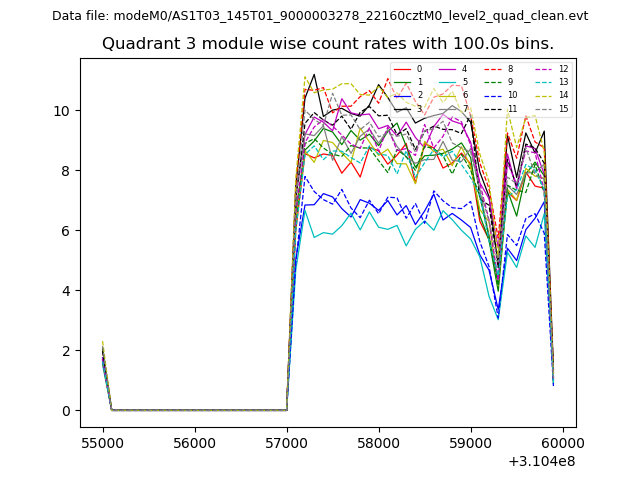 |
 |
| Parameter | Plot |
|---|---|
| CZT HV Monitor | 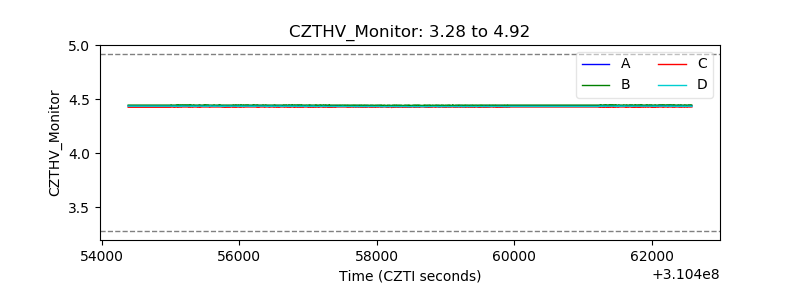 |
| D_VDD | 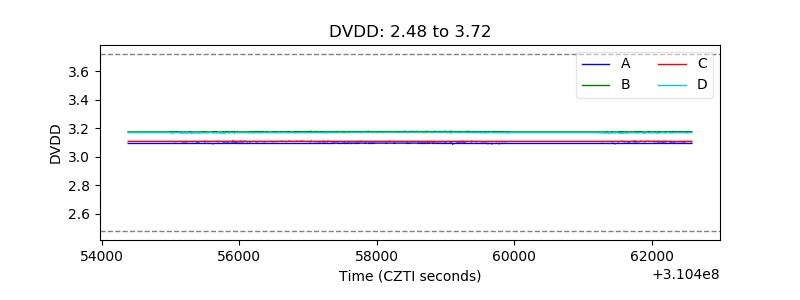 |
| Temperature 1 | 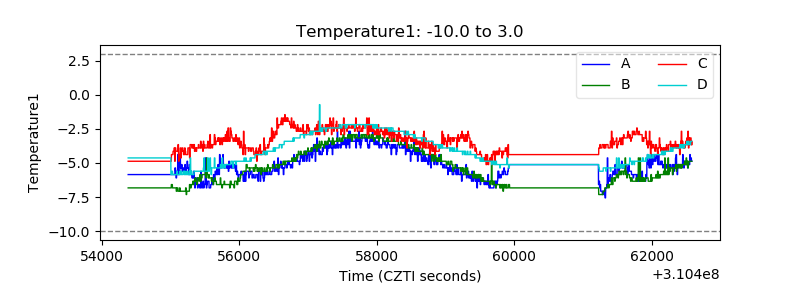 |
| Veto HV Monitor | 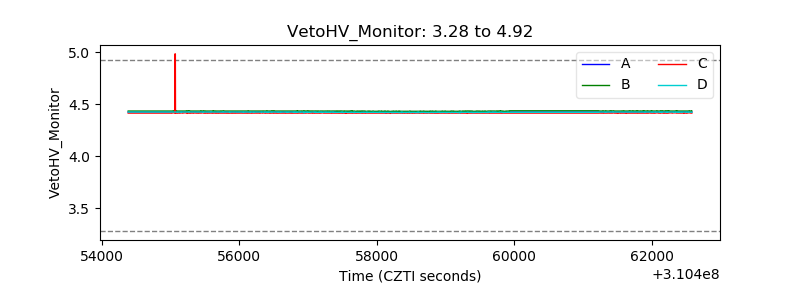 |
| Veto LLD | 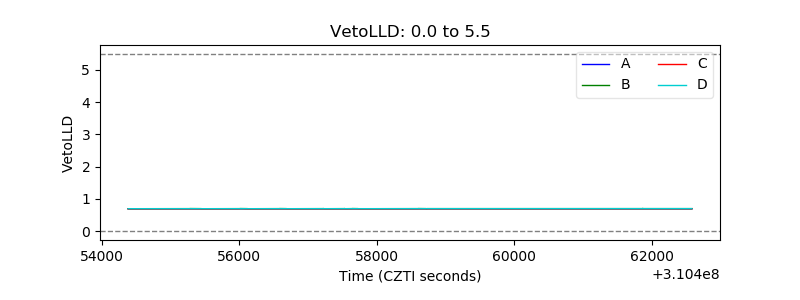 |
| Alpha Counter | 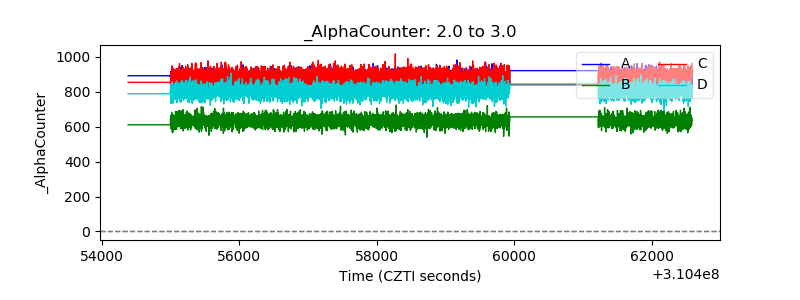 |
| _CPM_Rate | 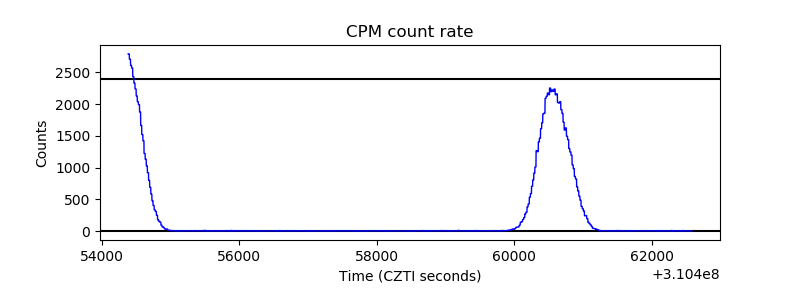 |
| CZT Counter | 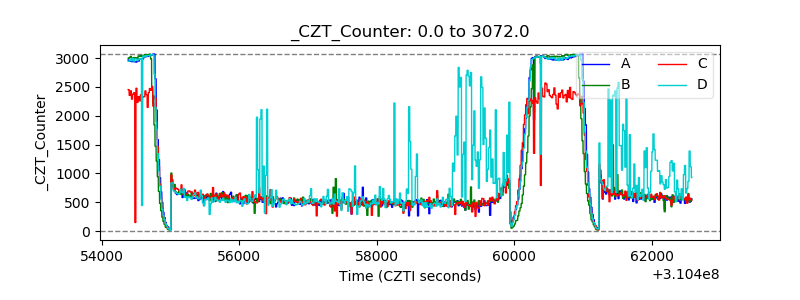 |
| +2.5 Volts monitor | 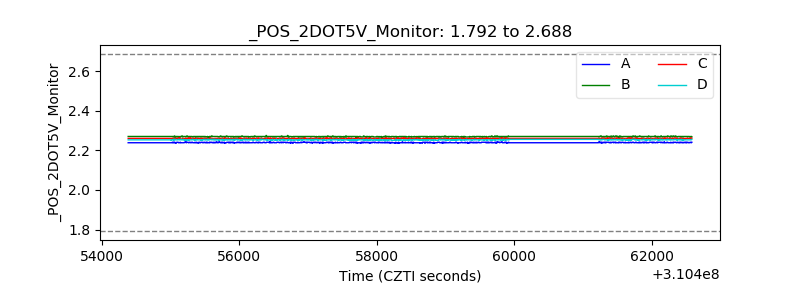 |
| +5 Volts monitor |  |
| _ROLL_ROT | 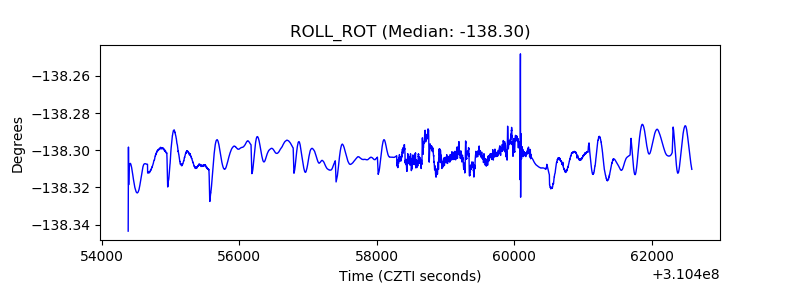 |
| _Roll_DEC | 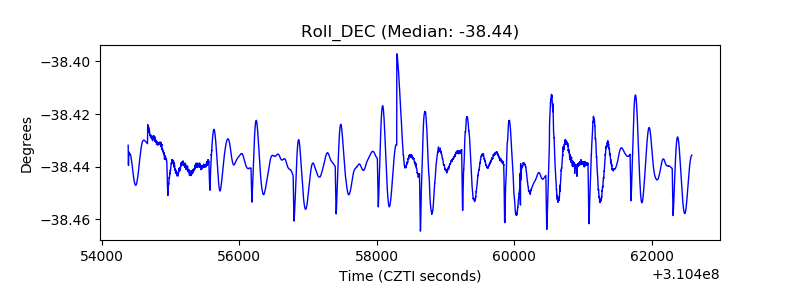 |
| _Roll_RA | 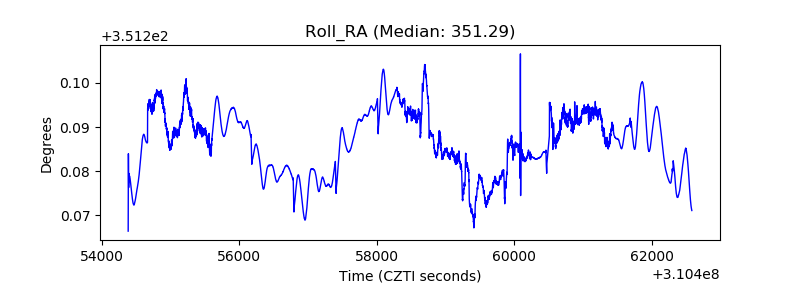 |
| Veto Counter |  |