| Param | Original file | Final file |
|---|---|---|
| Filename | modeM0/AS1T03_145T01_9000003278_22161cztM0_level2.evt | modeM0/AS1T03_145T01_9000003278_22161cztM0_level2_quad_clean.evt |
| Size (bytes) | 622,500,480 | 74,160,000 |
| Size | 593.7 MB | 70.7 MB |
| Events in quadrant A | 3,392,837 | 469,153 |
| Events in quadrant B | 3,490,386 | 479,126 |
| Events in quadrant C | 3,463,580 | 460,823 |
| Events in quadrant D | 8,080,871 | 398,388 |
| Mode M0 | |||
|---|---|---|---|
| Quadrant | BADHDUFLAG | Total packets | Discarded packets |
| A | 0 | 13828 | 3 |
| B | 0 | 14161 | 3 |
| C | 0 | 14222 | 3 |
| D | 0 | 28325 | 3 |
| Mode SS | |||
|---|---|---|---|
| Quadrant | BADHDUFLAG | Total packets | Discarded packets |
| A | 0 | 128 | 0 |
| B | 0 | 128 | 0 |
| C | 0 | 128 | 0 |
| D | 0 | 128 | 0 |
| Mode M9 | |||
|---|---|---|---|
| Quadrant | BADHDUFLAG | Total packets | Discarded packets |
| A | 0 | 19 | 0 |
| B | 0 | 20 | 0 |
| C | 0 | 20 | 0 |
| D | 0 | 20 | 0 |
| Quadrant | Total seconds | Saturated seconds | Saturation percentage |
|---|---|---|---|
| A | 6272 | 89 | 1.419005% |
| B | 6272 | 119 | 1.897321% |
| C | 6272 | 155 | 2.471301% |
| D | 6271 | 1587 | 25.306969% |
Noise dominated data is calculated using 1-second bins in cleaned event files. If a bin has >2000 counts, and if more than 50% of those come from <1% of pixels, then it is considered to be noise-dominated and hence unusable.
| Quadrant | # 1 sec bins | Bins with >0 counts | Bins with >2000 counts | High rate bins dominated by noise | Noise dominated (total time) | Noise dominated (detector-on time) | Marked lightcurve |
|---|---|---|---|---|---|---|---|
| A | 7592 | 6274 | 0 | 0 | 0.00% | 0.00% | 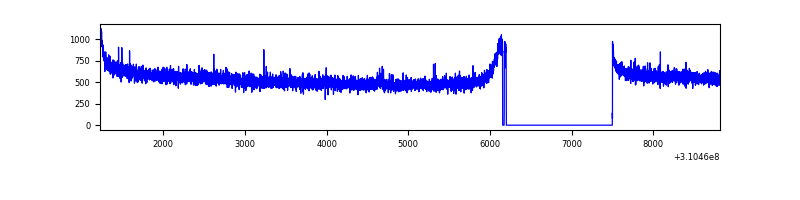 |
| B | 7592 | 6274 | 3 | 3 | 0.04% | 0.05% | 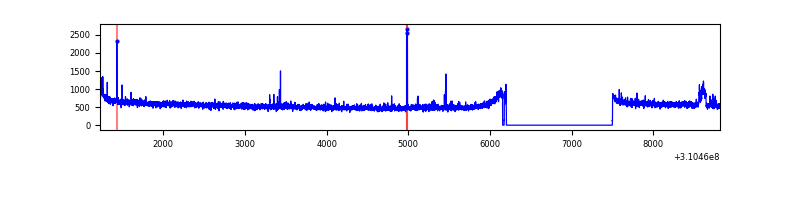 |
| C | 7592 | 6274 | 0 | 0 | 0.00% | 0.00% | 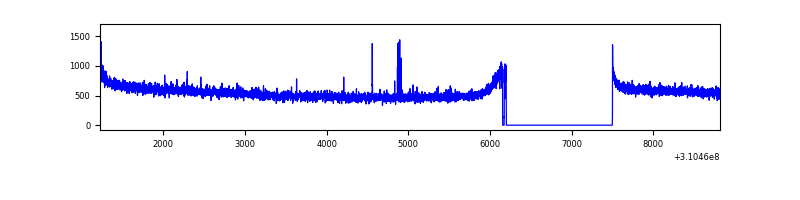 |
| D | 7591 | 6273 | 1344 | 1344 | 17.71% | 21.43% | 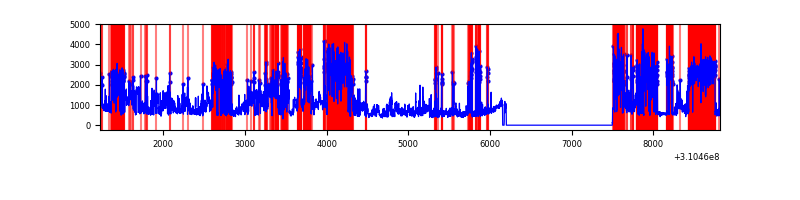 |
Top three noisy pixels from each quadrant. If the there are fewer than three noisy pixels in the level2.evt file, extra rows are filled as -1
| Pixel properties | Quadrant properties | ||||||
|---|---|---|---|---|---|---|---|
| Quadrant | DetID | PixID | Counts | Sigma | Mean | Median | Sigma |
| A | 13 | 254 | 10291 | 54.06 | 879 | 865 | 174.4 |
| A | 0 | 226 | 7524 | 38.19 | 879 | 865 | 174.4 |
| A | 3 | 137 | 7000 | 35.19 | 879 | 865 | 174.4 |
| B | 0 | 230 | 35706 | 215.37 | 874 | 855 | 161.8 |
| B | 0 | 197 | 20189 | 119.48 | 874 | 855 | 161.8 |
| B | 12 | 111 | 19111 | 112.82 | 874 | 855 | 161.8 |
| C | 14 | 238 | 136893 | 705.83 | 845 | 854 | 192.7 |
| C | 10 | 22 | 19081 | 94.57 | 845 | 854 | 192.7 |
| C | 9 | 54 | 8096 | 37.57 | 845 | 854 | 192.7 |
| D | 1 | 52 | 5230814 | 29497.56 | 743 | 723 | 177.3 |
| D | 13 | 104 | 22405 | 122.29 | 743 | 723 | 177.3 |
| D | 2 | 234 | 20290 | 110.36 | 743 | 723 | 177.3 |
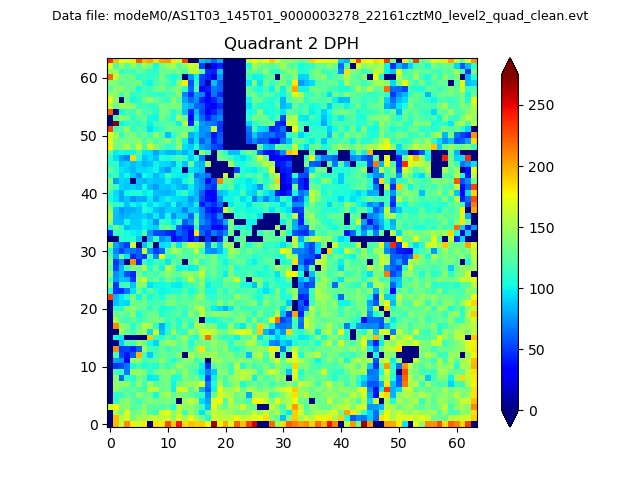
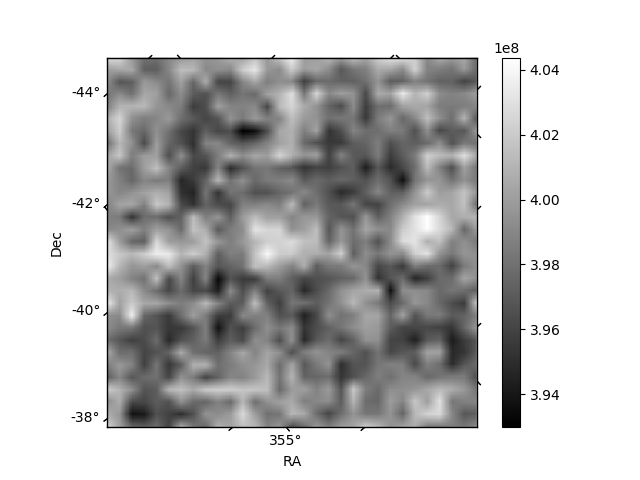
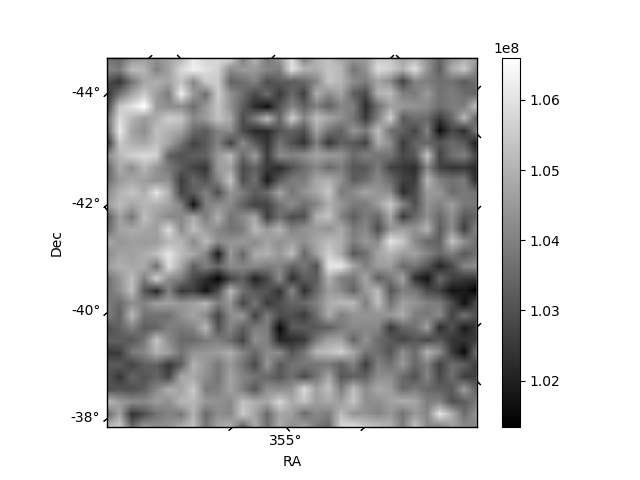
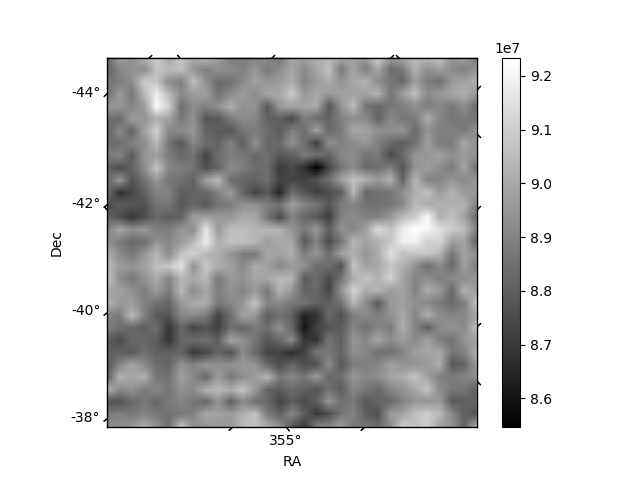
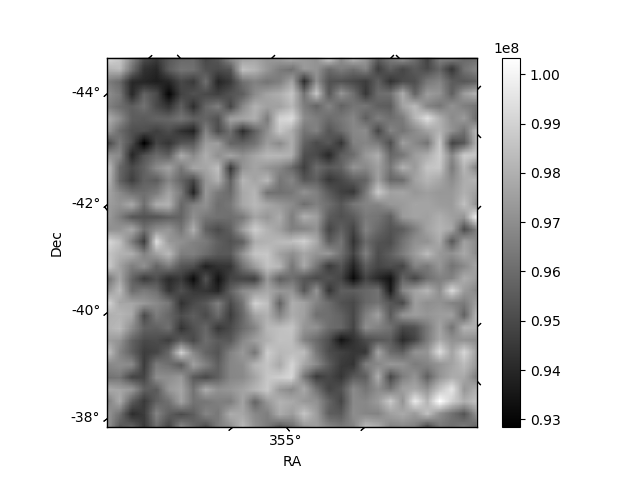
Histogram calculated using DETX and DETY for each event in the final _common_clean file
| Quadrant A | 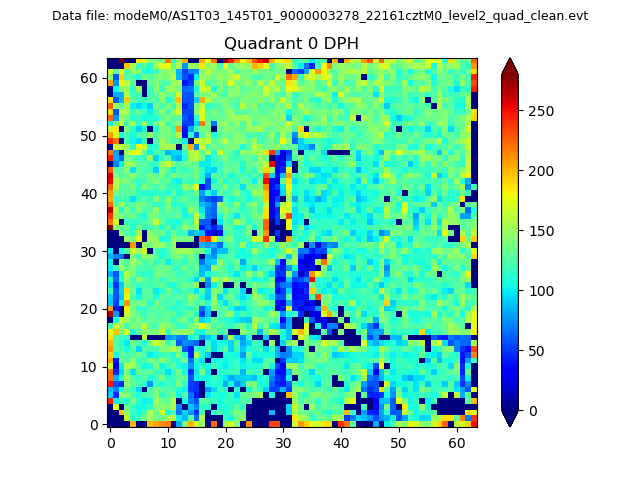 |
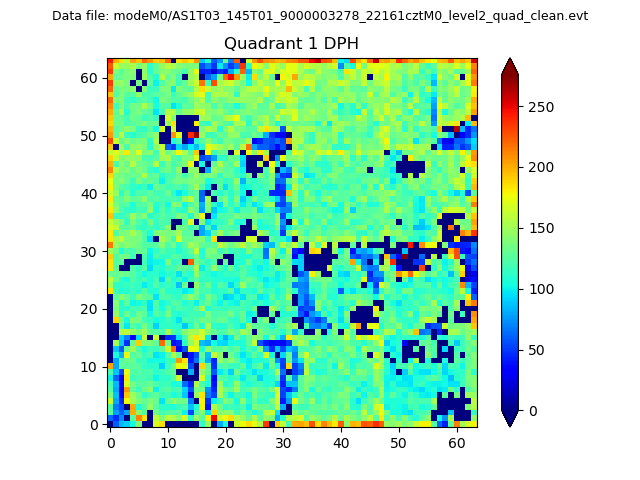 |
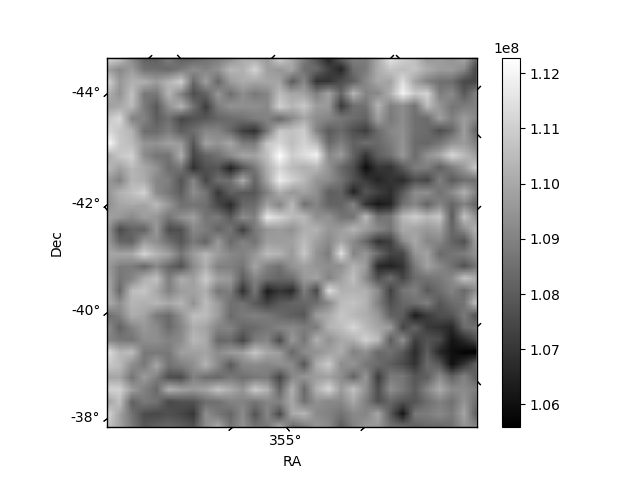
Quadrant B |
|---|---|---|---|
| Quadrant D | 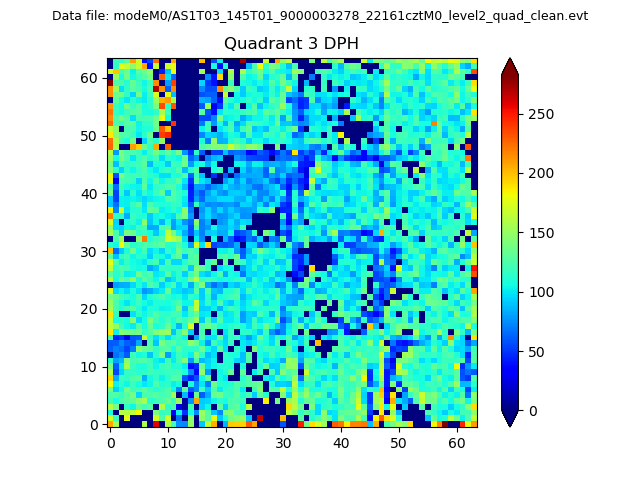 |
 |
Quadrant C |
| Plot type | Count rate plots | Images |
|---|---|---|
| Comparison with Poisson distribution Blue bars denote a histogram of data divided into 1 sec bins. Red curve is a Poisson curve with rate = median count rate of data. |
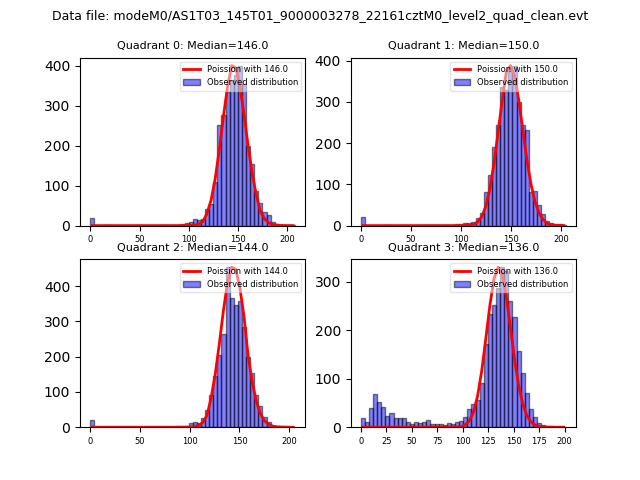 |
 |
| Quadrant-wise count rates Data is divided into 100 sec bins |
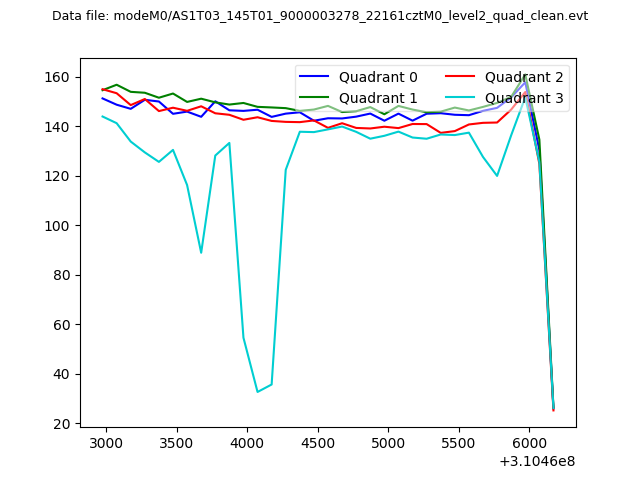 |
|
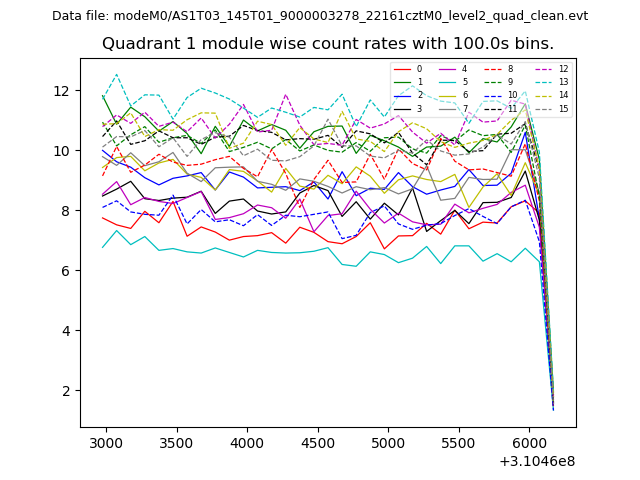
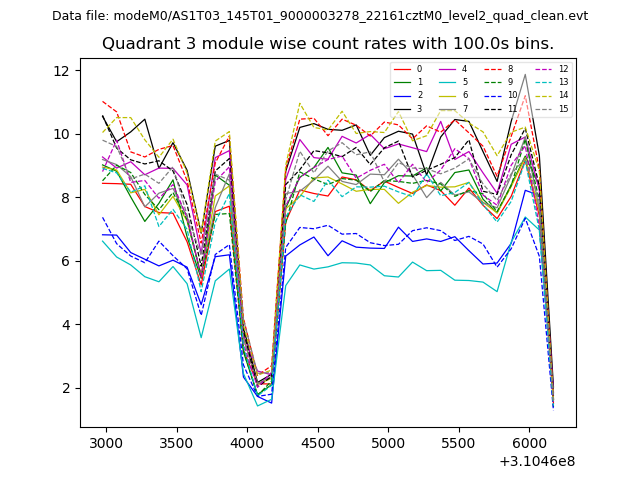
| Module-wise count rates for Quadrant A Data is divided into 100 sec bins |
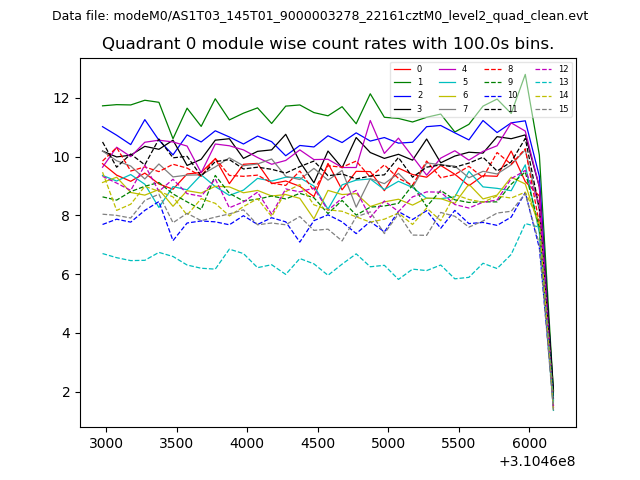 |
 |
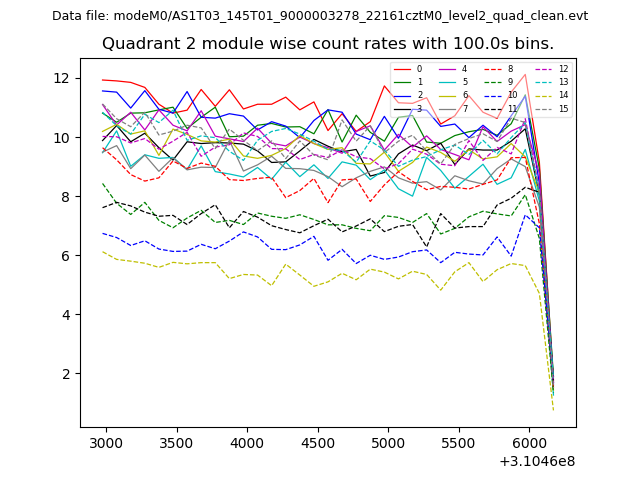
| Module-wise count rates for Quadrant B Data is divided into 100 sec bins |
 |
 |
| Module-wise count rates for Quadrant C Data is divided into 100 sec bins |
 |
 |
| Module-wise count rates for Quadrant D Data is divided into 100 sec bins |
 |
 |
| Parameter | Plot |
|---|---|
| CZT HV Monitor | 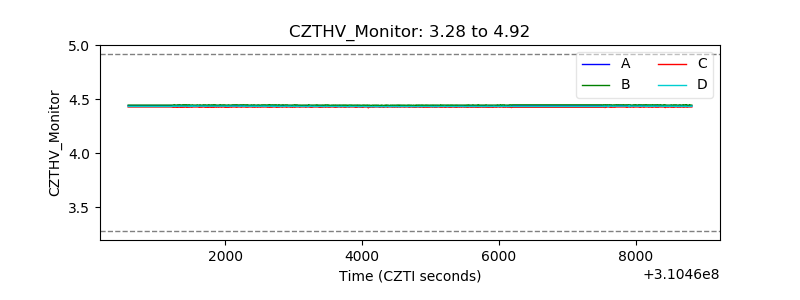 |
| D_VDD | 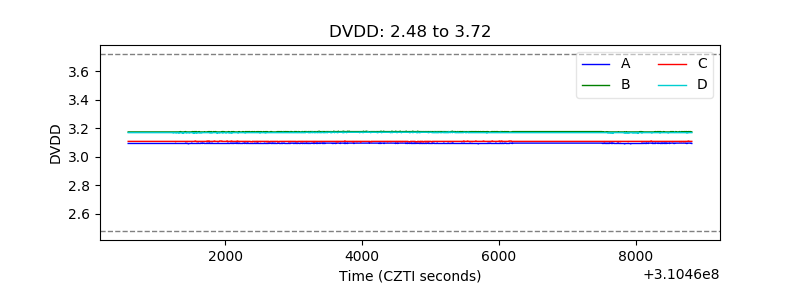 |
| Temperature 1 | 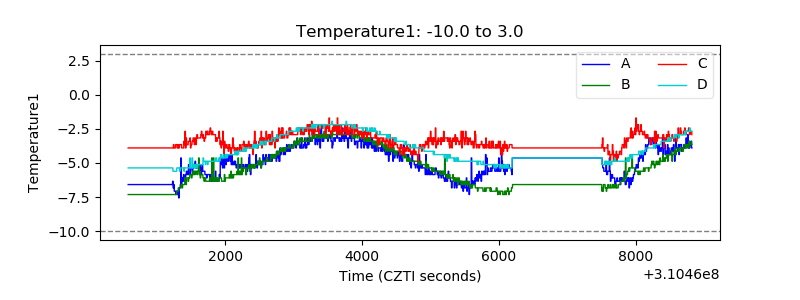 |
| Veto HV Monitor |  |
| Veto LLD | 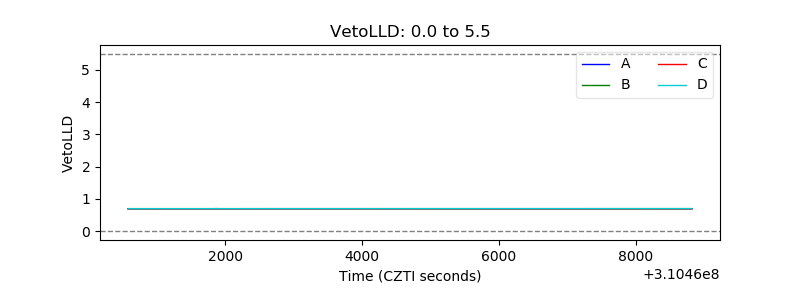 |
| Alpha Counter | 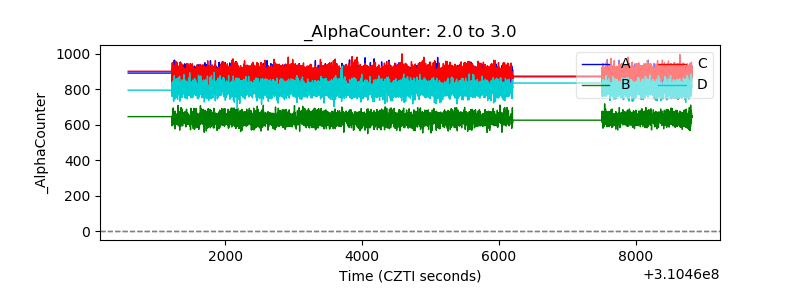 |
| _CPM_Rate | 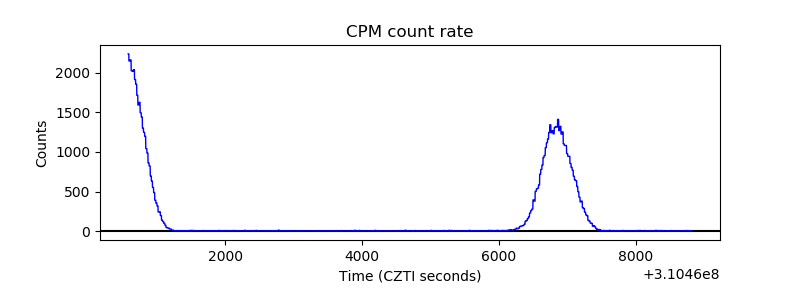 |
| CZT Counter | 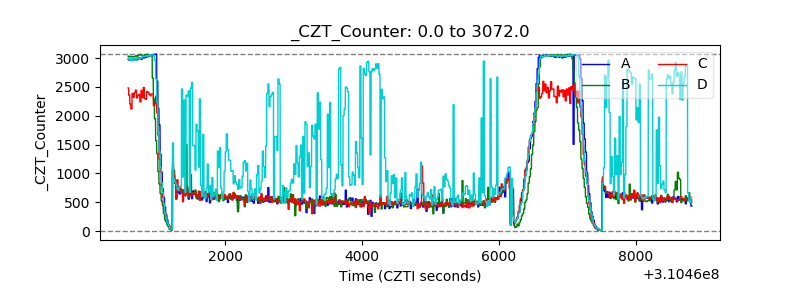 |
| +2.5 Volts monitor |  |
| +5 Volts monitor | 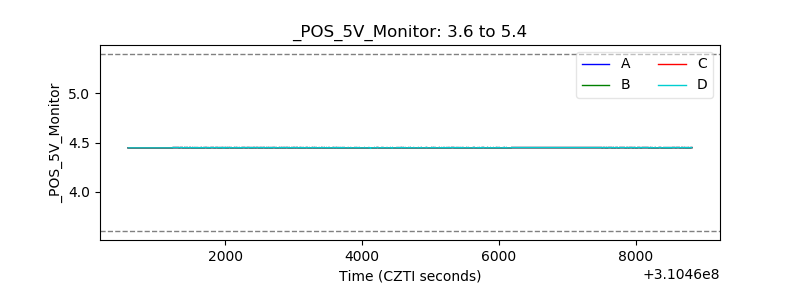 |
| _ROLL_ROT | 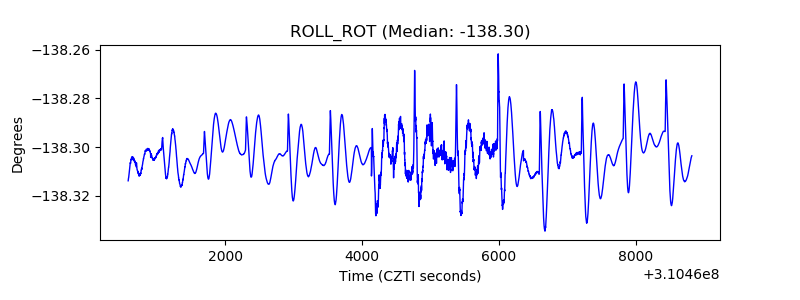 |
| _Roll_DEC | 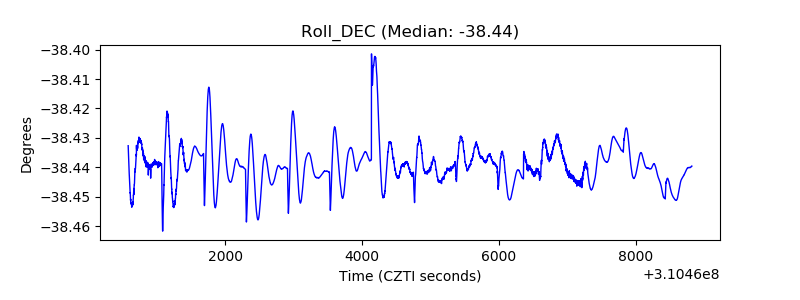 |
| _Roll_RA | 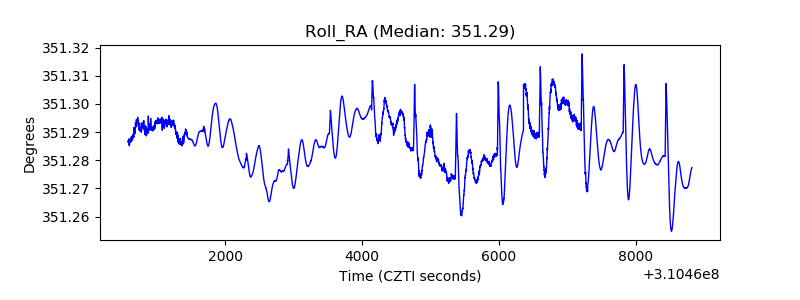 |
| Veto Counter | 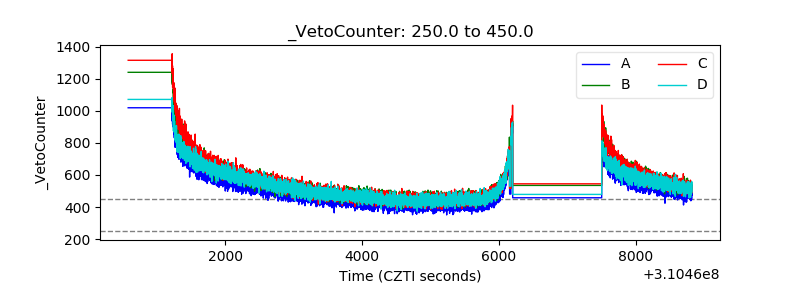 |