| Param | Original file | Final file |
|---|---|---|
| Filename | modeM0/AS1T03_145T01_9000003278_22162cztM0_level2.evt | modeM0/AS1T03_145T01_9000003278_22162cztM0_level2_quad_clean.evt |
| Size (bytes) | 665,959,680 | 87,681,600 |
| Size | 635.1 MB | 83.6 MB |
| Events in quadrant A | 3,331,909 | 590,042 |
| Events in quadrant B | 3,428,815 | 598,549 |
| Events in quadrant C | 3,356,151 | 575,309 |
| Events in quadrant D | 9,618,846 | 444,693 |
| Mode M0 | |||
|---|---|---|---|
| Quadrant | BADHDUFLAG | Total packets | Discarded packets |
| A | 0 | 13693 | 2 |
| B | 0 | 14017 | 2 |
| C | 0 | 13857 | 2 |
| D | 0 | 32848 | 2 |
| Mode SS | |||
|---|---|---|---|
| Quadrant | BADHDUFLAG | Total packets | Discarded packets |
| A | 0 | 128 | 0 |
| B | 0 | 128 | 0 |
| C | 0 | 128 | 0 |
| D | 0 | 128 | 0 |
| Mode M9 | |||
|---|---|---|---|
| Quadrant | BADHDUFLAG | Total packets | Discarded packets |
| A | 0 | 22 | 0 |
| B | 0 | 23 | 0 |
| C | 0 | 23 | 0 |
| D | 0 | 23 | 0 |
| Quadrant | Total seconds | Saturated seconds | Saturation percentage |
|---|---|---|---|
| A | 6400 | 115 | 1.796875% |
| B | 6400 | 130 | 2.031250% |
| C | 6400 | 162 | 2.531250% |
| D | 6400 | 2432 | 38.000000% |
Noise dominated data is calculated using 1-second bins in cleaned event files. If a bin has >2000 counts, and if more than 50% of those come from <1% of pixels, then it is considered to be noise-dominated and hence unusable.
| Quadrant | # 1 sec bins | Bins with >0 counts | Bins with >2000 counts | High rate bins dominated by noise | Noise dominated (total time) | Noise dominated (detector-on time) | Marked lightcurve |
|---|---|---|---|---|---|---|---|
| A | 7555 | 6401 | 0 | 0 | 0.00% | 0.00% | 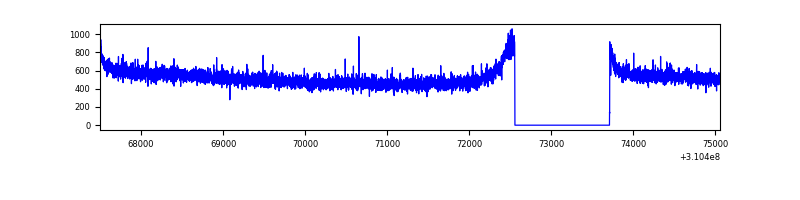 |
| B | 7555 | 6401 | 4 | 4 | 0.05% | 0.06% | 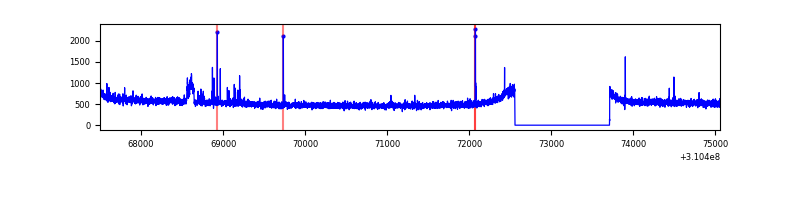 |
| C | 7555 | 6401 | 0 | 0 | 0.00% | 0.00% | 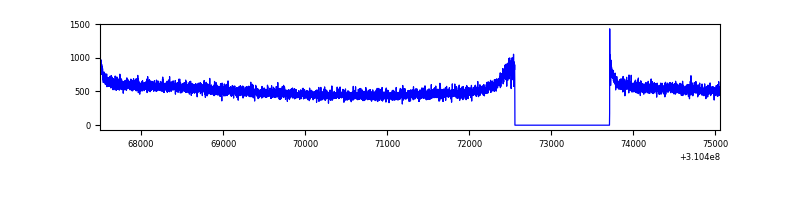 |
| D | 7555 | 6401 | 2241 | 2241 | 29.66% | 35.01% | 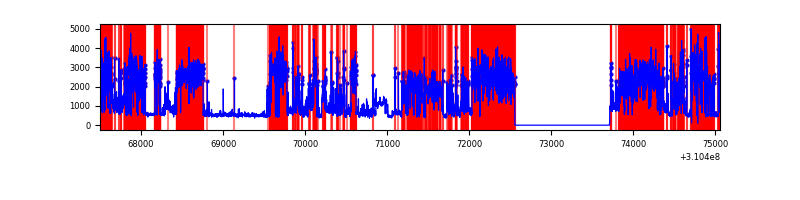 |
Top three noisy pixels from each quadrant. If the there are fewer than three noisy pixels in the level2.evt file, extra rows are filled as -1
| Pixel properties | Quadrant properties | ||||||
|---|---|---|---|---|---|---|---|
| Quadrant | DetID | PixID | Counts | Sigma | Mean | Median | Sigma |
| A | 13 | 254 | 11326 | 61.63 | 863 | 848 | 170.0 |
| A | 0 | 226 | 7394 | 38.5 | 863 | 848 | 170.0 |
| A | 3 | 137 | 7025 | 36.33 | 863 | 848 | 170.0 |
| B | 0 | 230 | 32241 | 197.63 | 855 | 837 | 158.9 |
| B | 12 | 111 | 18995 | 114.27 | 855 | 837 | 158.9 |
| B | 11 | 111 | 17065 | 102.13 | 855 | 837 | 158.9 |
| C | 14 | 238 | 132108 | 691.05 | 825 | 832 | 190.0 |
| C | 0 | 10 | 8532 | 40.53 | 825 | 832 | 190.0 |
| C | 13 | 61 | 5818 | 26.25 | 825 | 832 | 190.0 |
| D | 1 | 52 | 7047259 | 45985.21 | 636 | 619 | 153.2 |
| D | 13 | 104 | 111977 | 726.7 | 636 | 619 | 153.2 |
| D | 2 | 136 | 32452 | 207.74 | 636 | 619 | 153.2 |
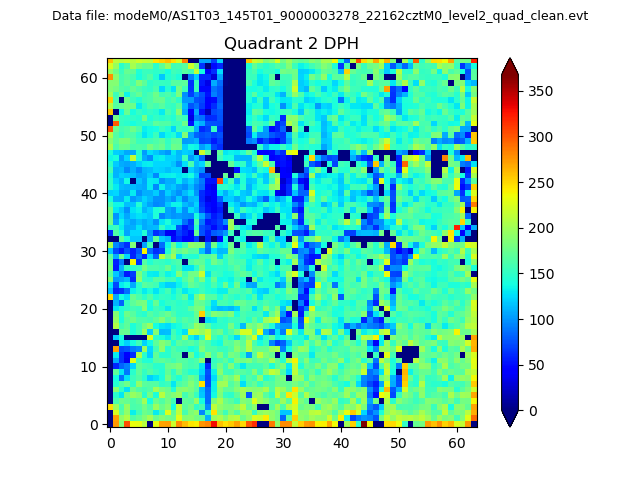
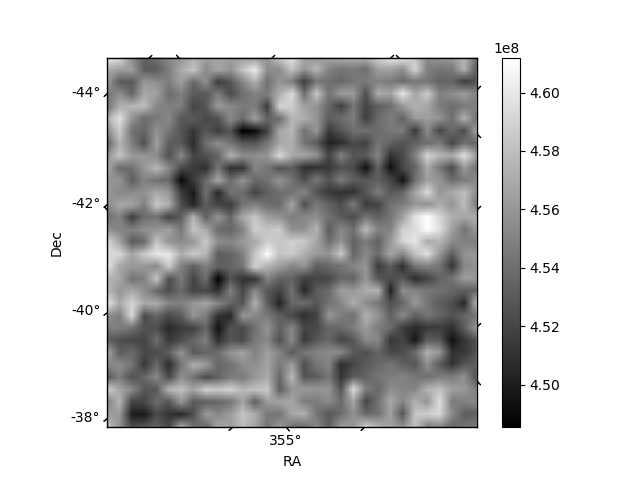
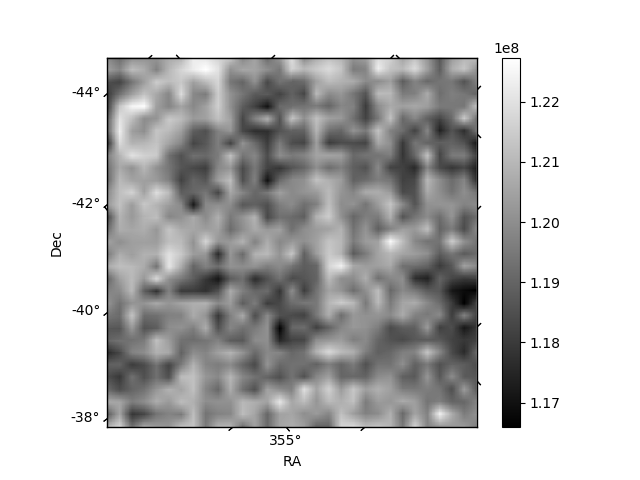
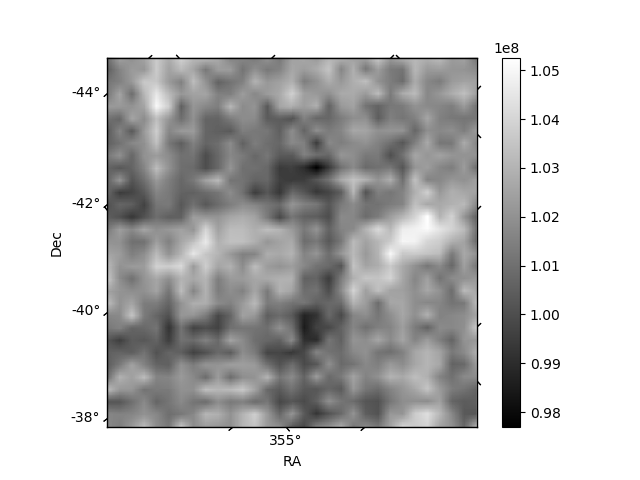
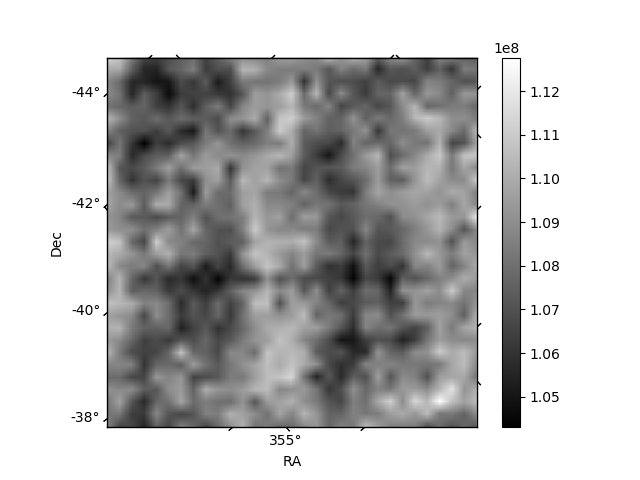
Histogram calculated using DETX and DETY for each event in the final _common_clean file
| Quadrant A | 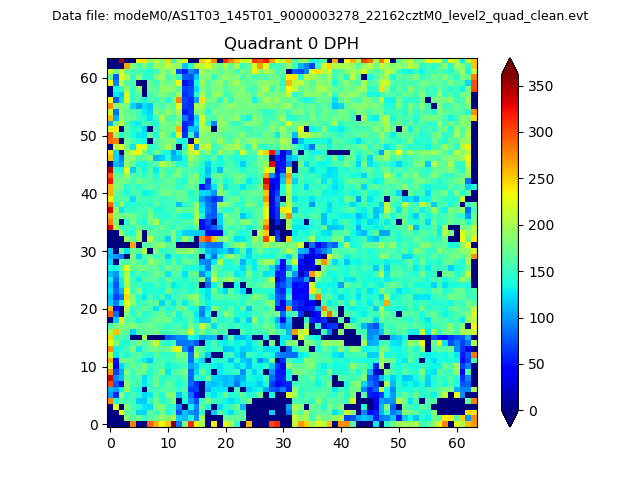 |
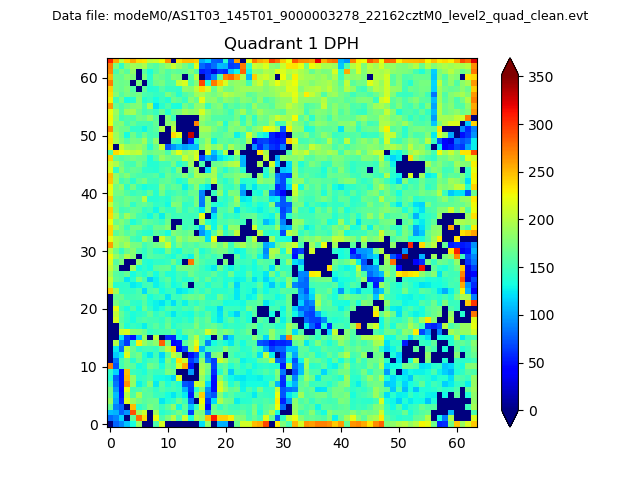 |
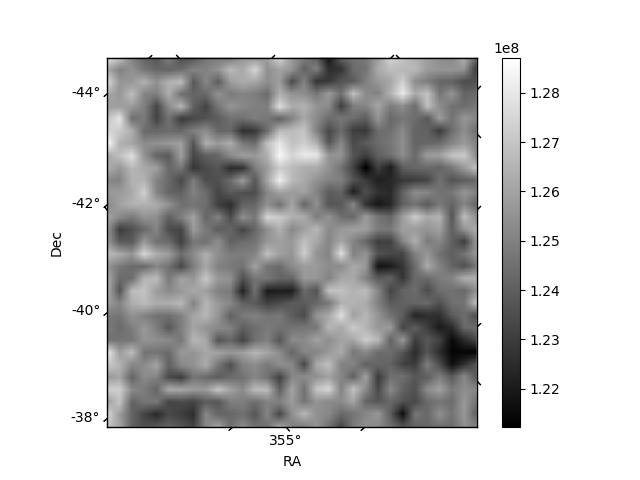
Quadrant B |
|---|---|---|---|
| Quadrant D | 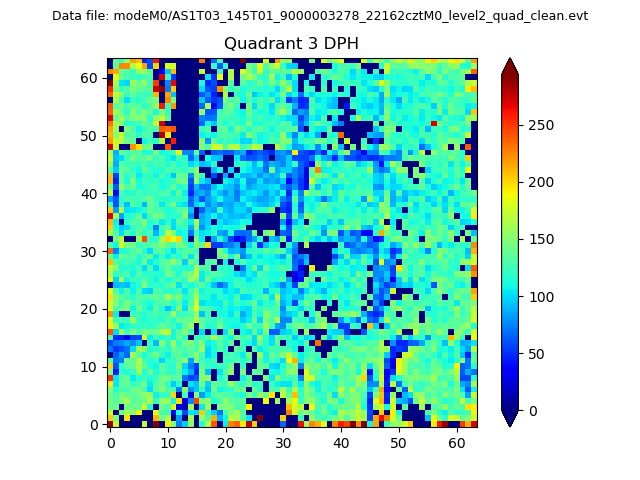 |
 |
Quadrant C |
| Plot type | Count rate plots | Images |
|---|---|---|
| Comparison with Poisson distribution Blue bars denote a histogram of data divided into 1 sec bins. Red curve is a Poisson curve with rate = median count rate of data. |
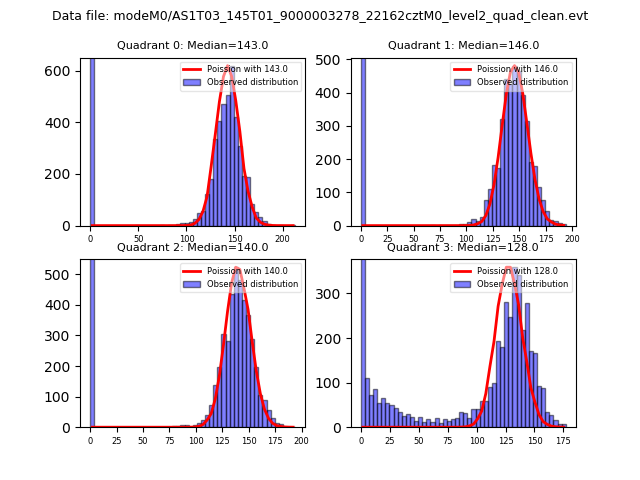 |
 |
| Quadrant-wise count rates Data is divided into 100 sec bins |
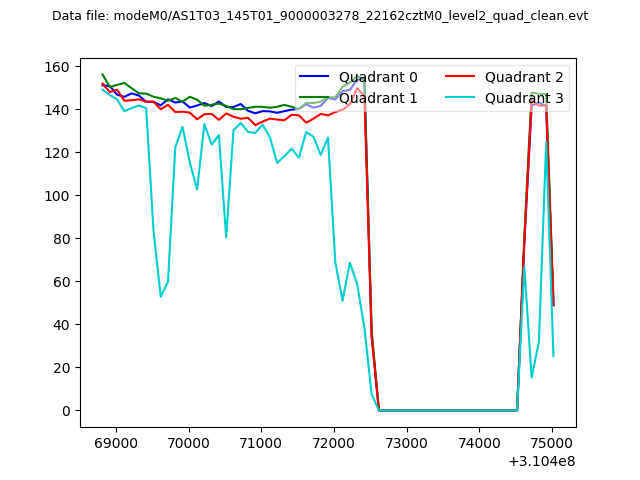 |
|
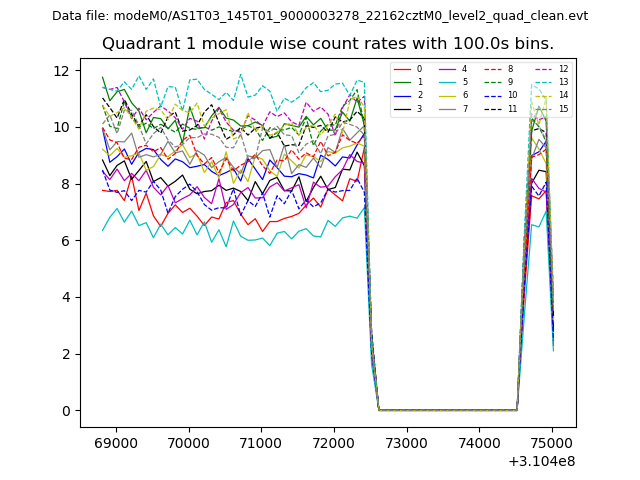
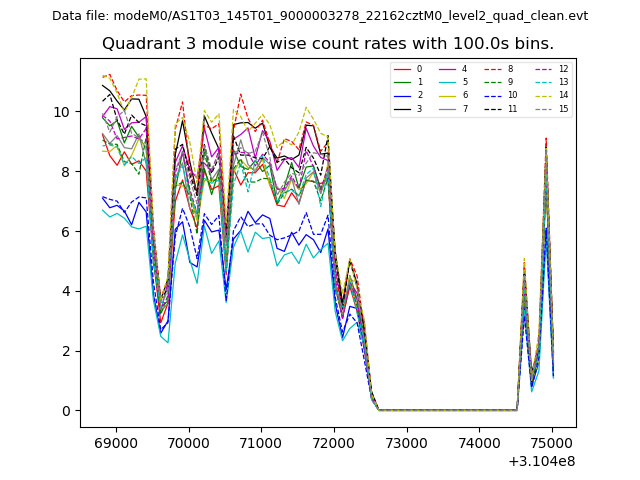
| Module-wise count rates for Quadrant A Data is divided into 100 sec bins |
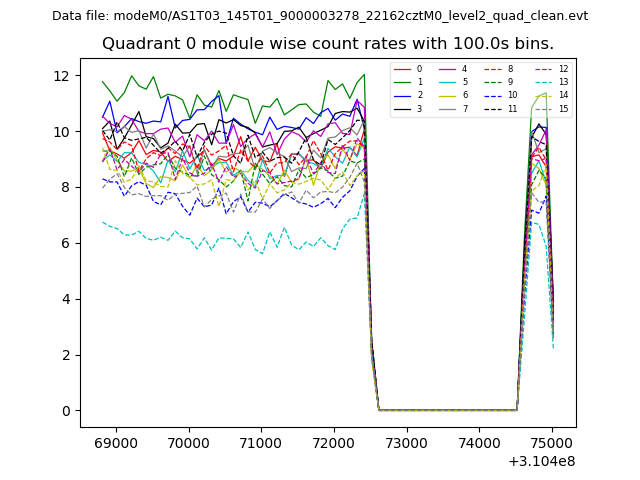 |
 |
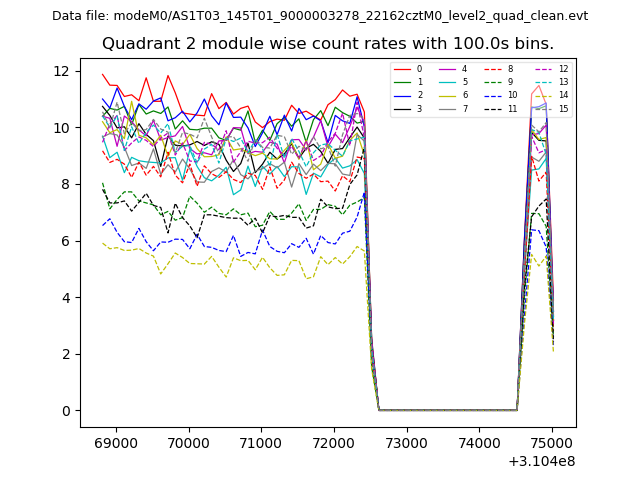
| Module-wise count rates for Quadrant B Data is divided into 100 sec bins |
 |
 |
| Module-wise count rates for Quadrant C Data is divided into 100 sec bins |
 |
 |
| Module-wise count rates for Quadrant D Data is divided into 100 sec bins |
 |
 |
| Parameter | Plot |
|---|---|
| CZT HV Monitor | 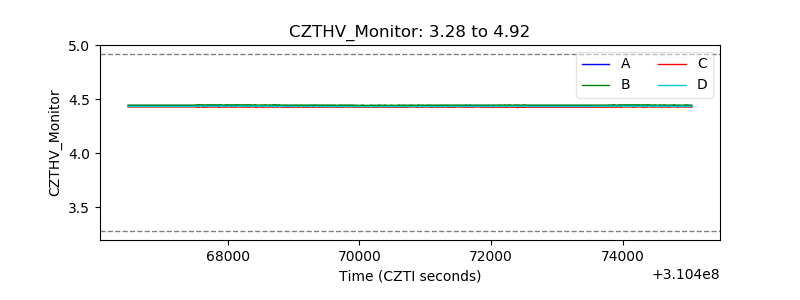 |
| D_VDD | 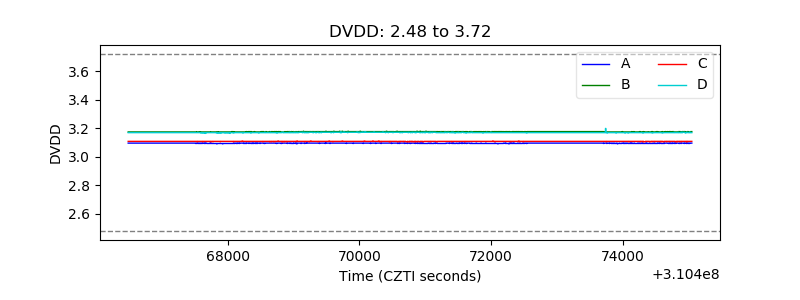 |
| Temperature 1 | 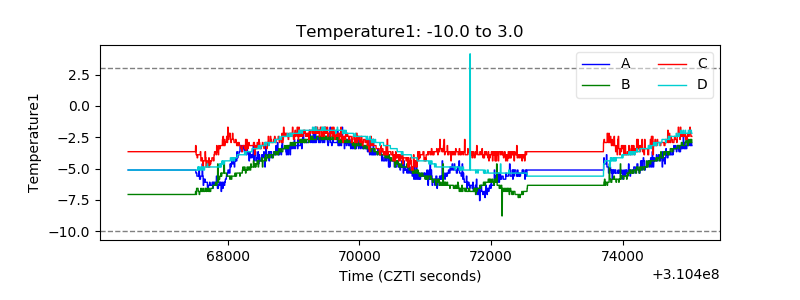 |
| Veto HV Monitor | 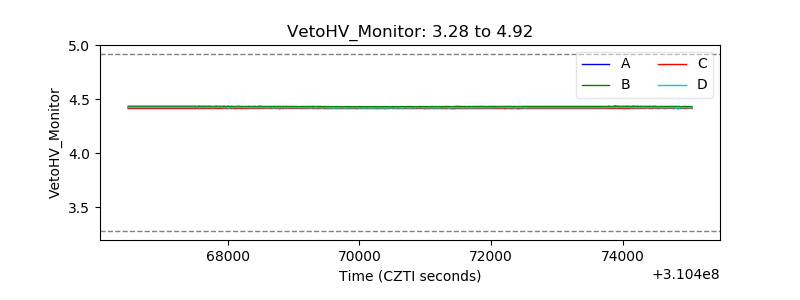 |
| Veto LLD | 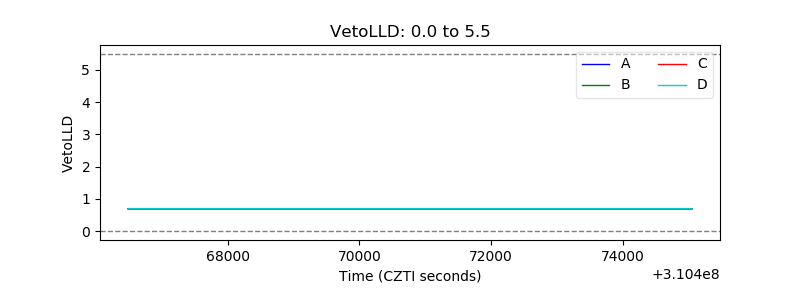 |
| Alpha Counter | 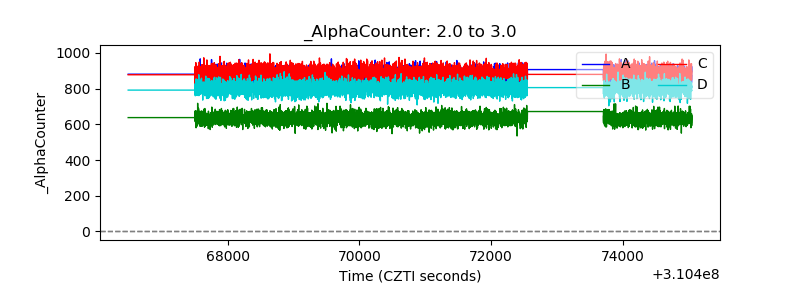 |
| _CPM_Rate | 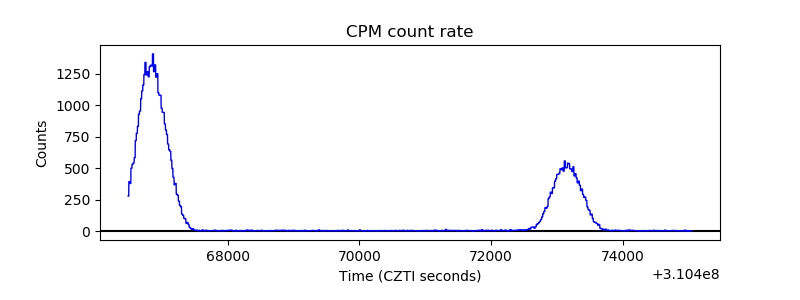 |
| CZT Counter | 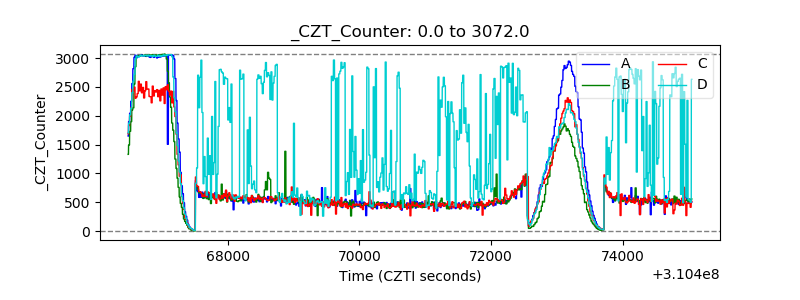 |
| +2.5 Volts monitor |  |
| +5 Volts monitor | 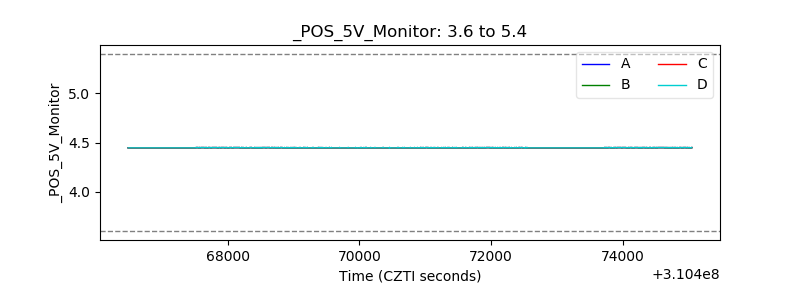 |
| _ROLL_ROT | 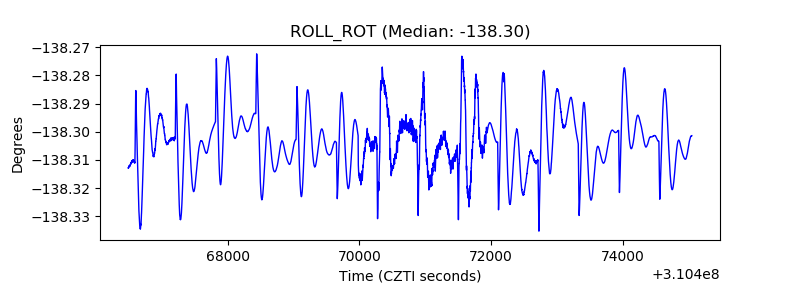 |
| _Roll_DEC | 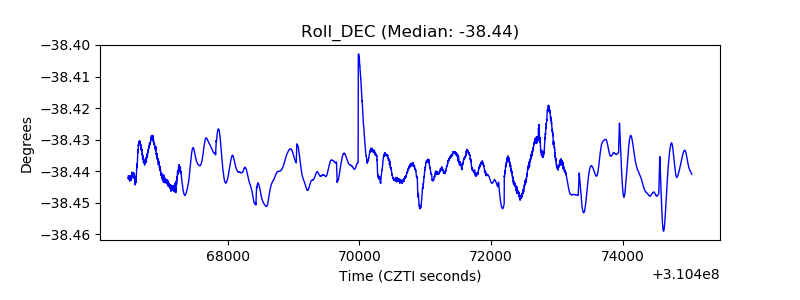 |
| _Roll_RA | 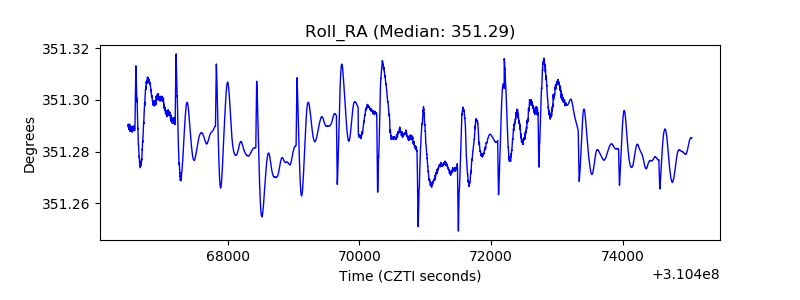 |
| Veto Counter | 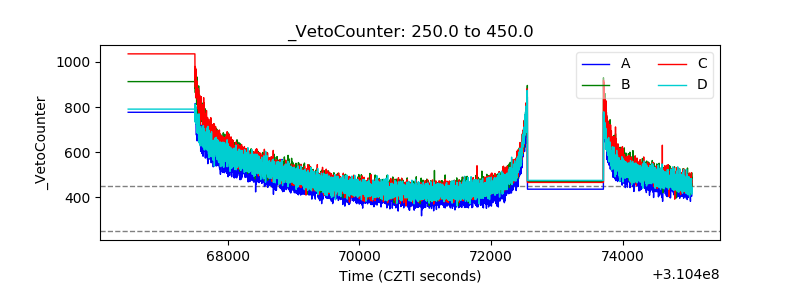 |