| Param | Original file | Final file |
|---|---|---|
| Filename | modeM0/AS1T03_145T01_9000003278_22163cztM0_level2.evt | modeM0/AS1T03_145T01_9000003278_22163cztM0_level2_quad_clean.evt |
| Size (bytes) | 685,013,760 | 88,925,760 |
| Size | 653.3 MB | 84.8 MB |
| Events in quadrant A | 3,406,717 | 618,190 |
| Events in quadrant B | 3,411,447 | 628,173 |
| Events in quadrant C | 3,387,800 | 598,128 |
| Events in quadrant D | 10,079,801 | 374,588 |
| Mode M0 | |||
|---|---|---|---|
| Quadrant | BADHDUFLAG | Total packets | Discarded packets |
| A | 0 | 14271 | 2 |
| B | 0 | 14258 | 2 |
| C | 0 | 14275 | 2 |
| D | 0 | 34450 | 2 |
| Mode SS | |||
|---|---|---|---|
| Quadrant | BADHDUFLAG | Total packets | Discarded packets |
| A | 0 | 136 | 0 |
| B | 0 | 136 | 0 |
| C | 0 | 136 | 0 |
| D | 0 | 136 | 0 |
| Mode M9 | |||
|---|---|---|---|
| Quadrant | BADHDUFLAG | Total packets | Discarded packets |
| A | 0 | 19 | 0 |
| B | 0 | 20 | 0 |
| C | 0 | 20 | 0 |
| D | 0 | 20 | 0 |
| Quadrant | Total seconds | Saturated seconds | Saturation percentage |
|---|---|---|---|
| A | 6790 | 145 | 2.135493% |
| B | 6790 | 176 | 2.592047% |
| C | 6790 | 167 | 2.459499% |
| D | 6789 | 2872 | 42.303727% |
Noise dominated data is calculated using 1-second bins in cleaned event files. If a bin has >2000 counts, and if more than 50% of those come from <1% of pixels, then it is considered to be noise-dominated and hence unusable.
| Quadrant | # 1 sec bins | Bins with >0 counts | Bins with >2000 counts | High rate bins dominated by noise | Noise dominated (total time) | Noise dominated (detector-on time) | Marked lightcurve |
|---|---|---|---|---|---|---|---|
| A | 7630 | 6791 | 0 | 0 | 0.00% | 0.00% | 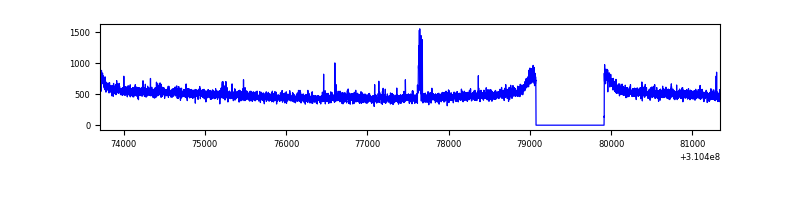 |
| B | 7630 | 6791 | 0 | 0 | 0.00% | 0.00% | 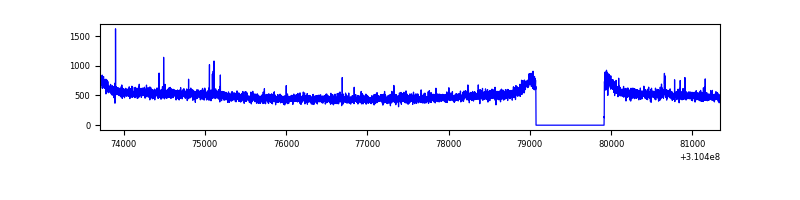 |
| C | 7630 | 6791 | 0 | 0 | 0.00% | 0.00% | 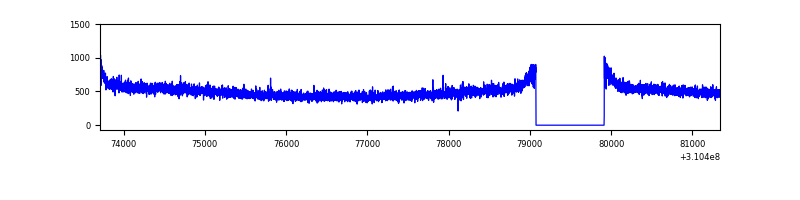 |
| D | 7629 | 6790 | 2512 | 2512 | 32.93% | 37.00% | 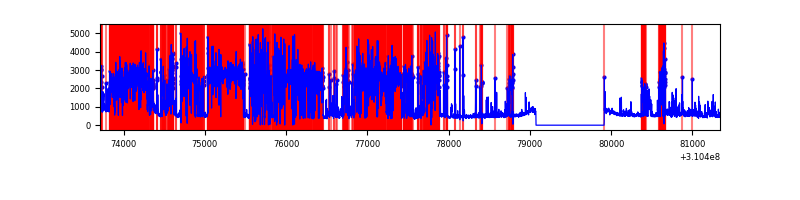 |
Top three noisy pixels from each quadrant. If the there are fewer than three noisy pixels in the level2.evt file, extra rows are filled as -1
| Pixel properties | Quadrant properties | ||||||
|---|---|---|---|---|---|---|---|
| Quadrant | DetID | PixID | Counts | Sigma | Mean | Median | Sigma |
| A | 3 | 1 | 37468 | 209.33 | 874 | 858 | 174.9 |
| A | 13 | 254 | 11336 | 59.91 | 874 | 858 | 174.9 |
| A | 0 | 226 | 7519 | 38.09 | 874 | 858 | 174.9 |
| B | 12 | 111 | 20134 | 117.09 | 867 | 846 | 164.7 |
| B | 11 | 111 | 17929 | 103.7 | 867 | 846 | 164.7 |
| B | 0 | 197 | 17699 | 102.31 | 867 | 846 | 164.7 |
| C | 14 | 238 | 131868 | 673.97 | 832 | 837 | 194.4 |
| C | 0 | 10 | 6860 | 30.98 | 832 | 837 | 194.4 |
| C | 13 | 61 | 5799 | 25.52 | 832 | 837 | 194.4 |
| D | 1 | 52 | 7545781 | 49249.33 | 637 | 619 | 153.2 |
| D | 13 | 104 | 74630 | 483.09 | 637 | 619 | 153.2 |
| D | 2 | 136 | 23333 | 148.26 | 637 | 619 | 153.2 |
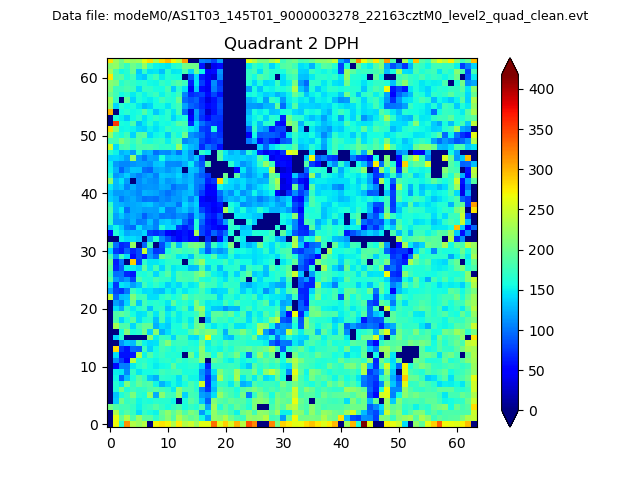
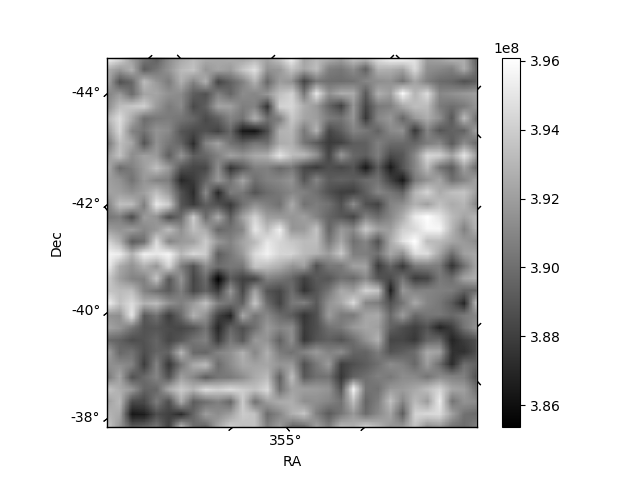
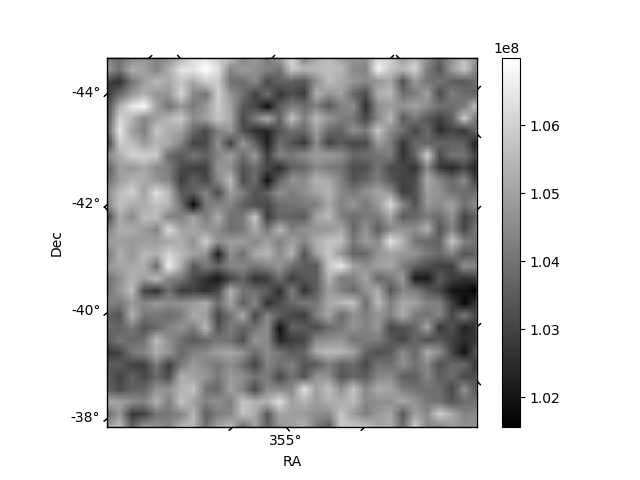
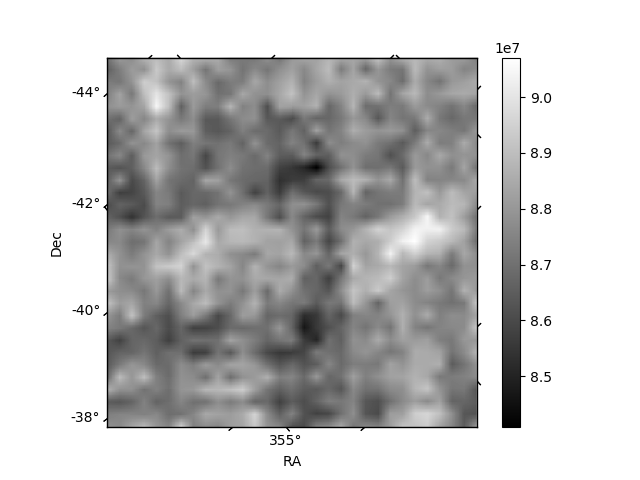
Histogram calculated using DETX and DETY for each event in the final _common_clean file
| Quadrant A | 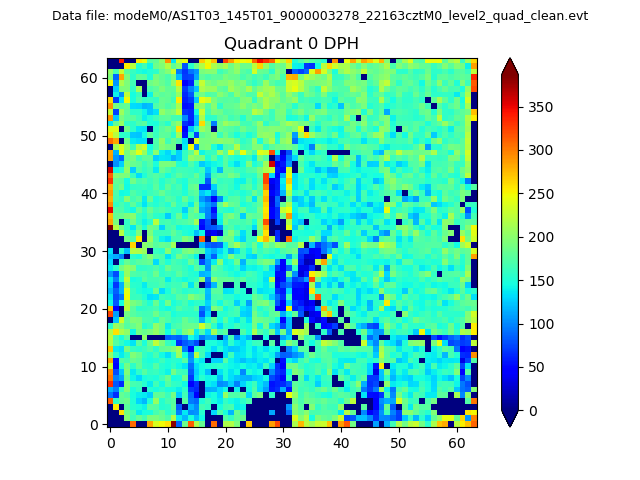 |
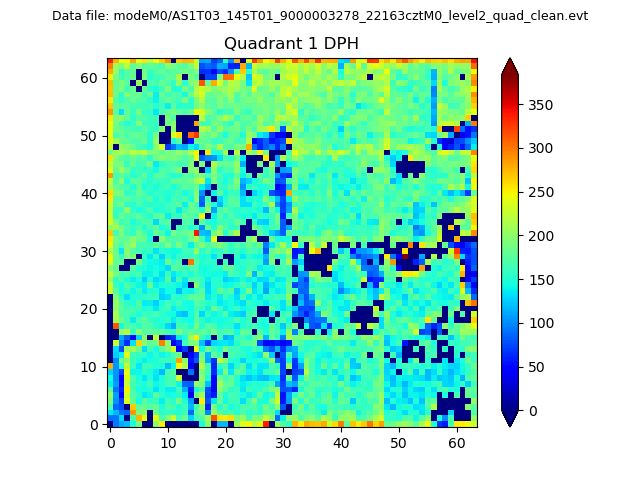 |
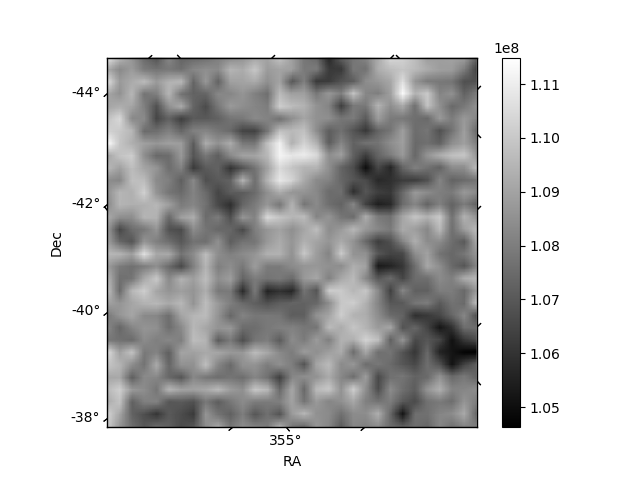
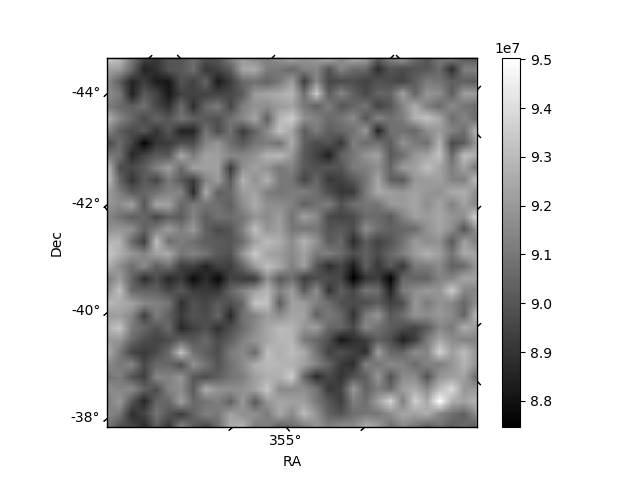
Quadrant B |
|---|---|---|---|
| Quadrant D | 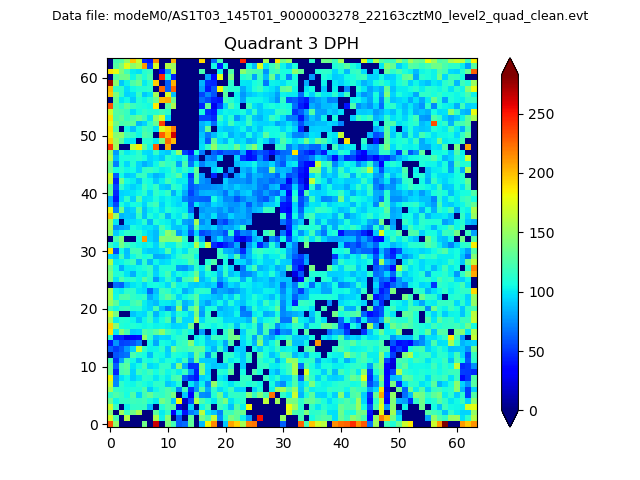 |
 |
Quadrant C |
| Plot type | Count rate plots | Images |
|---|---|---|
| Comparison with Poisson distribution Blue bars denote a histogram of data divided into 1 sec bins. Red curve is a Poisson curve with rate = median count rate of data. |
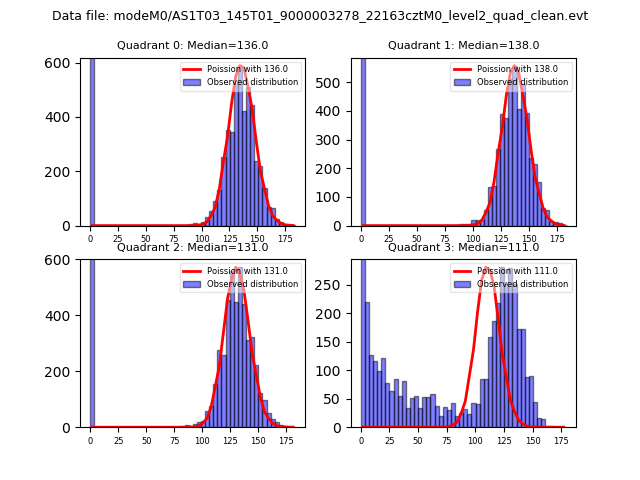 |
 |
| Quadrant-wise count rates Data is divided into 100 sec bins |
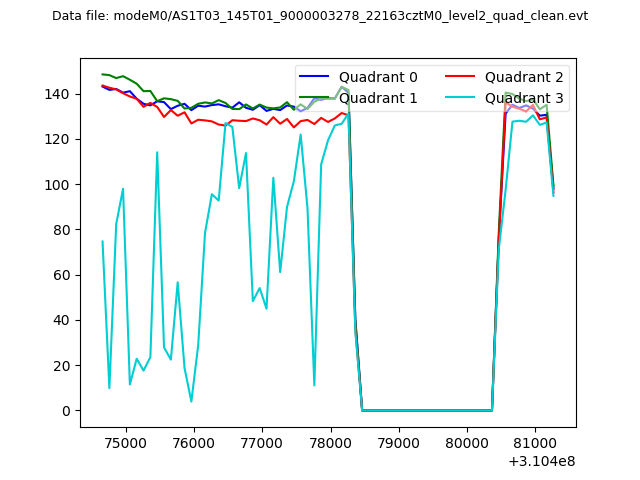 |
|
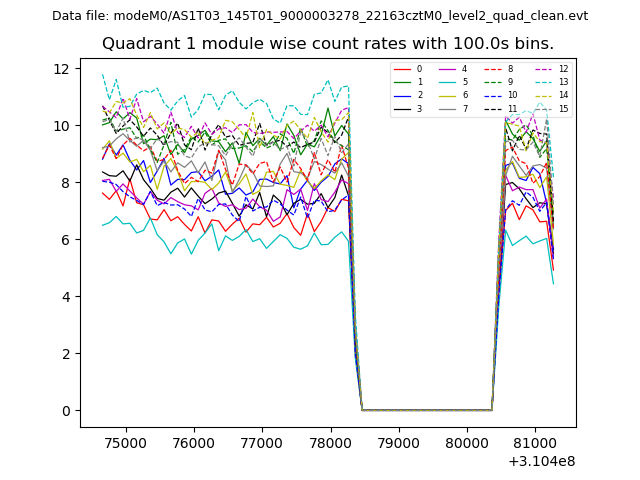
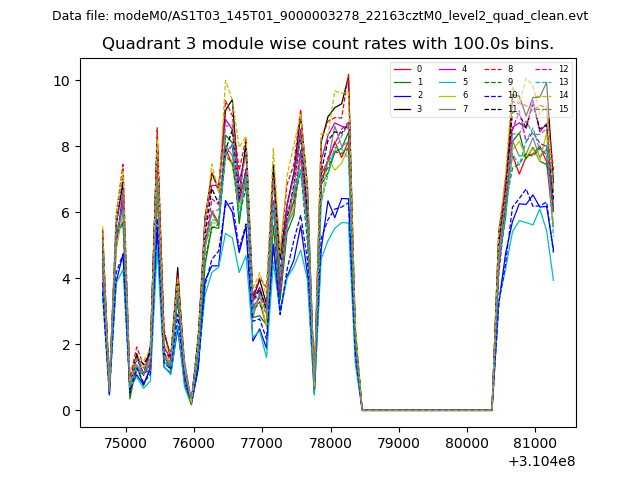
| Module-wise count rates for Quadrant A Data is divided into 100 sec bins |
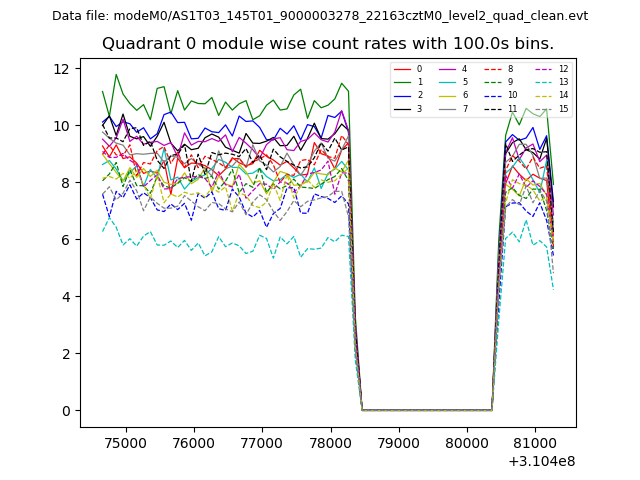 |
 |
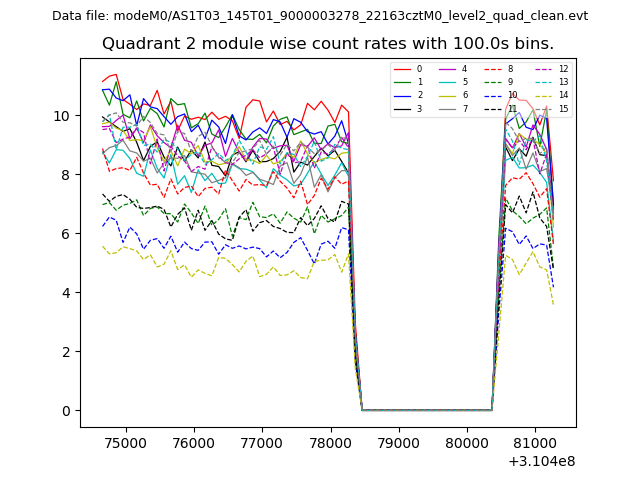
| Module-wise count rates for Quadrant B Data is divided into 100 sec bins |
 |
 |
| Module-wise count rates for Quadrant C Data is divided into 100 sec bins |
 |
 |
| Module-wise count rates for Quadrant D Data is divided into 100 sec bins |
 |
 |
| Parameter | Plot |
|---|---|
| CZT HV Monitor | 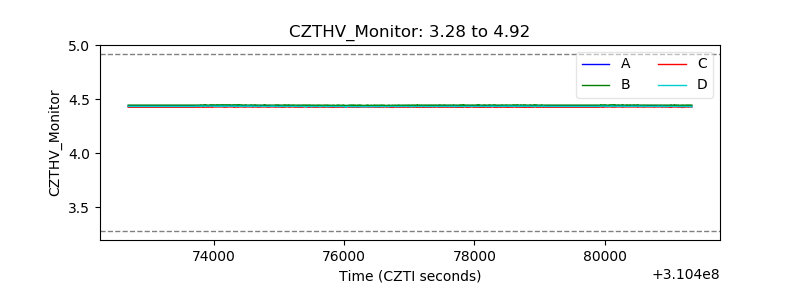 |
| D_VDD | 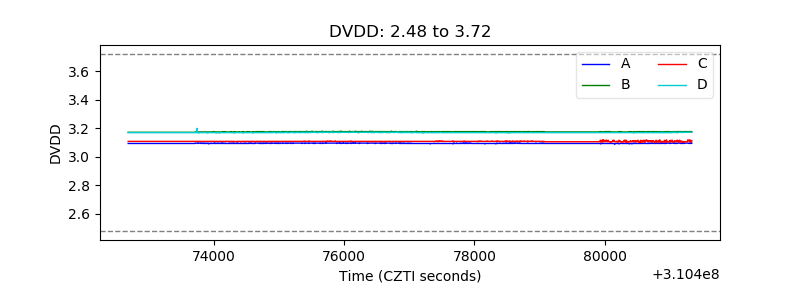 |
| Temperature 1 | 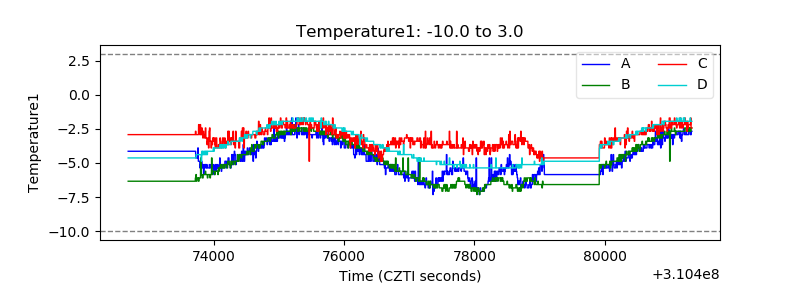 |
| Veto HV Monitor |  |
| Veto LLD | 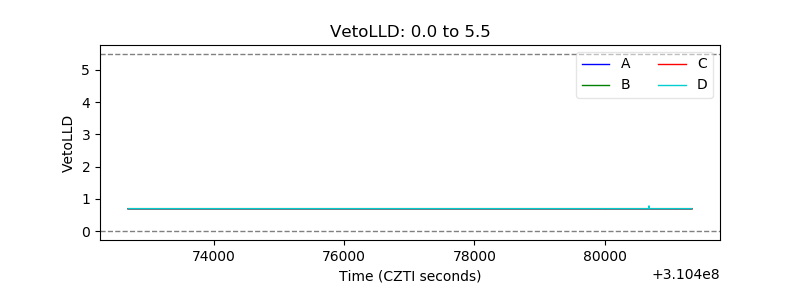 |
| Alpha Counter | 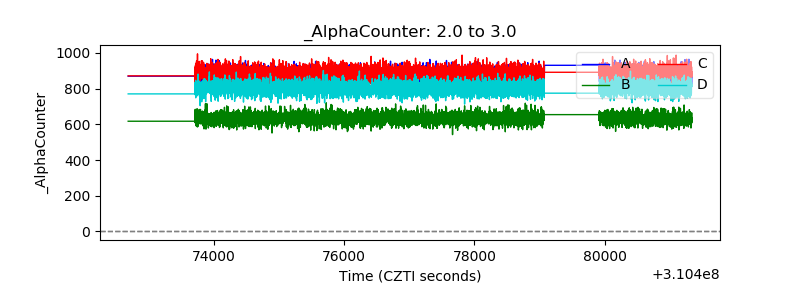 |
| _CPM_Rate | 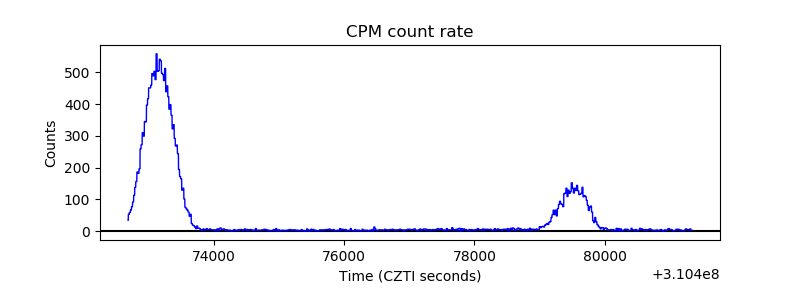 |
| CZT Counter | 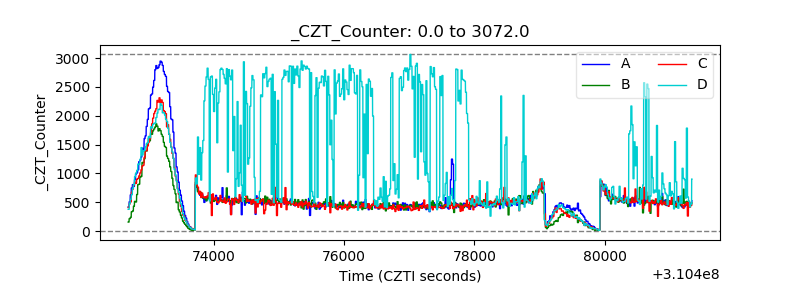 |
| +2.5 Volts monitor | 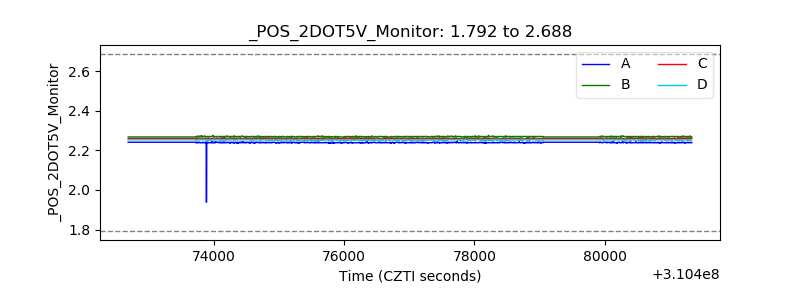 |
| +5 Volts monitor | 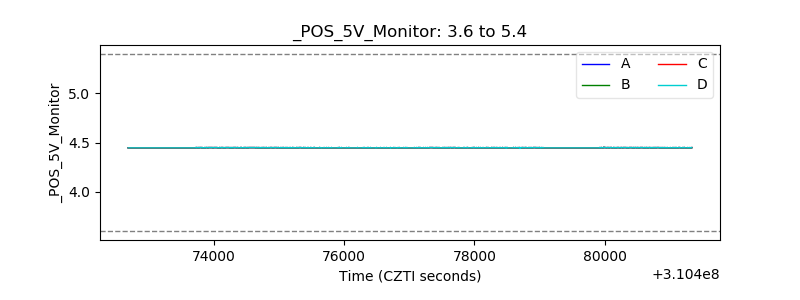 |
| _ROLL_ROT |  |
| _Roll_DEC | 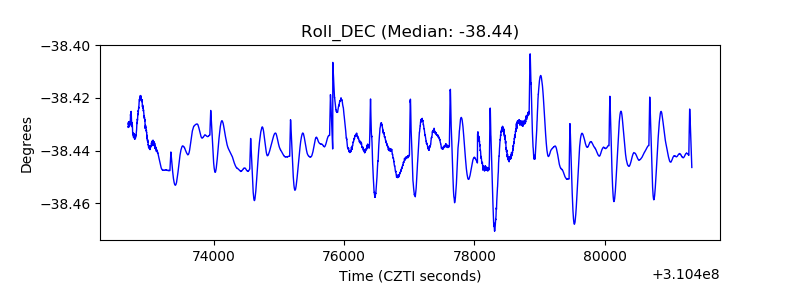 |
| _Roll_RA | 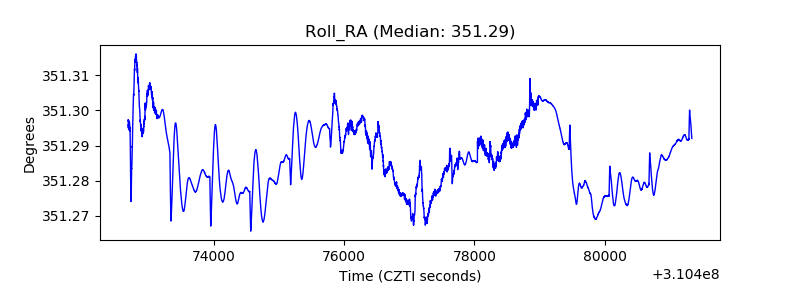 |
| Veto Counter |  |