| Param | Original file | Final file |
|---|---|---|
| Filename | modeM0/AS1T03_145T01_9000003278_22164cztM0_level2.evt | modeM0/AS1T03_145T01_9000003278_22164cztM0_level2_quad_clean.evt |
| Size (bytes) | 475,588,800 | 95,558,400 |
| Size | 453.6 MB | 91.1 MB |
| Events in quadrant A | 3,082,909 | 624,832 |
| Events in quadrant B | 3,157,926 | 634,742 |
| Events in quadrant C | 3,105,235 | 606,697 |
| Events in quadrant D | 4,615,565 | 574,586 |
| Mode M0 | |||
|---|---|---|---|
| Quadrant | BADHDUFLAG | Total packets | Discarded packets |
| A | 0 | 13403 | 2 |
| B | 0 | 13523 | 1 |
| C | 0 | 13443 | 1 |
| D | 0 | 18143 | 1 |
| Mode SS | |||
|---|---|---|---|
| Quadrant | BADHDUFLAG | Total packets | Discarded packets |
| A | 0 | 132 | 0 |
| B | 0 | 132 | 0 |
| C | 0 | 132 | 0 |
| D | 0 | 132 | 0 |
| Mode M9 | |||
|---|---|---|---|
| Quadrant | BADHDUFLAG | Total packets | Discarded packets |
| A | 0 | 4 | 0 |
| B | 0 | 4 | 0 |
| C | 0 | 4 | 0 |
| D | 0 | 4 | 0 |
| Quadrant | Total seconds | Saturated seconds | Saturation percentage |
|---|---|---|---|
| A | 6494 | 127 | 1.955651% |
| B | 6494 | 130 | 2.001848% |
| C | 6494 | 124 | 1.909455% |
| D | 6495 | 548 | 8.437259% |
Noise dominated data is calculated using 1-second bins in cleaned event files. If a bin has >2000 counts, and if more than 50% of those come from <1% of pixels, then it is considered to be noise-dominated and hence unusable.
| Quadrant | # 1 sec bins | Bins with >0 counts | Bins with >2000 counts | High rate bins dominated by noise | Noise dominated (total time) | Noise dominated (detector-on time) | Marked lightcurve |
|---|---|---|---|---|---|---|---|
| A | 6959 | 6495 | 0 | 0 | 0.00% | 0.00% | 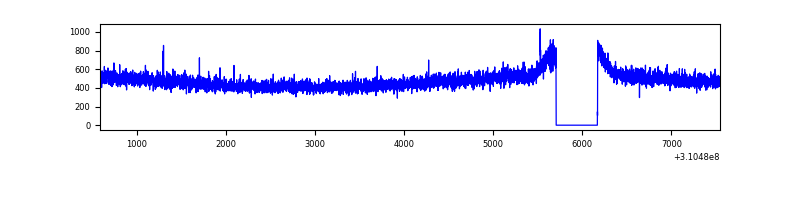 |
| B | 6959 | 6495 | 1 | 1 | 0.01% | 0.02% | 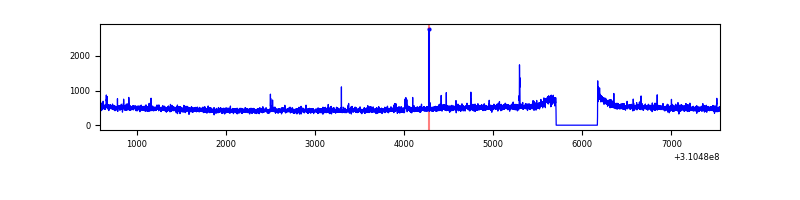 |
| C | 6959 | 6495 | 0 | 0 | 0.00% | 0.00% | 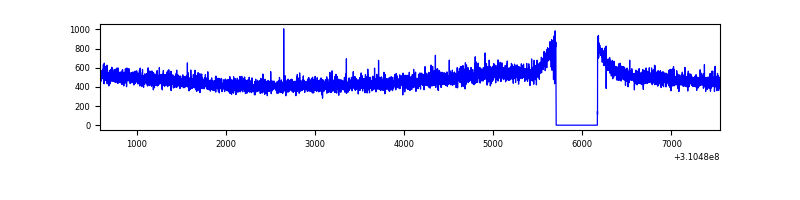 |
| D | 6960 | 6496 | 417 | 417 | 5.99% | 6.42% | 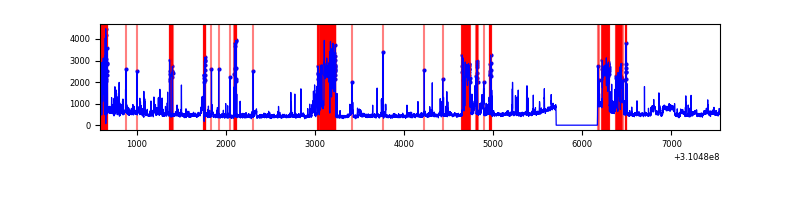 |
Top three noisy pixels from each quadrant. If the there are fewer than three noisy pixels in the level2.evt file, extra rows are filled as -1
| Pixel properties | Quadrant properties | ||||||
|---|---|---|---|---|---|---|---|
| Quadrant | DetID | PixID | Counts | Sigma | Mean | Median | Sigma |
| A | 13 | 254 | 10128 | 57.79 | 799 | 781 | 161.8 |
| A | 3 | 137 | 7032 | 38.65 | 799 | 781 | 161.8 |
| A | 0 | 226 | 6788 | 37.14 | 799 | 781 | 161.8 |
| B | 12 | 111 | 19013 | 120.76 | 793 | 773 | 151.0 |
| B | 11 | 111 | 16788 | 106.03 | 793 | 773 | 151.0 |
| B | 0 | 197 | 16485 | 104.02 | 793 | 773 | 151.0 |
| C | 14 | 238 | 121780 | 677.29 | 762 | 766 | 178.7 |
| C | 8 | 128 | 8359 | 42.5 | 762 | 766 | 178.7 |
| C | 13 | 61 | 5392 | 25.89 | 762 | 766 | 178.7 |
| D | 1 | 52 | 1726744 | 9523.35 | 742 | 720 | 181.2 |
| D | 2 | 136 | 35212 | 190.31 | 742 | 720 | 181.2 |
| D | 2 | 234 | 25849 | 138.65 | 742 | 720 | 181.2 |
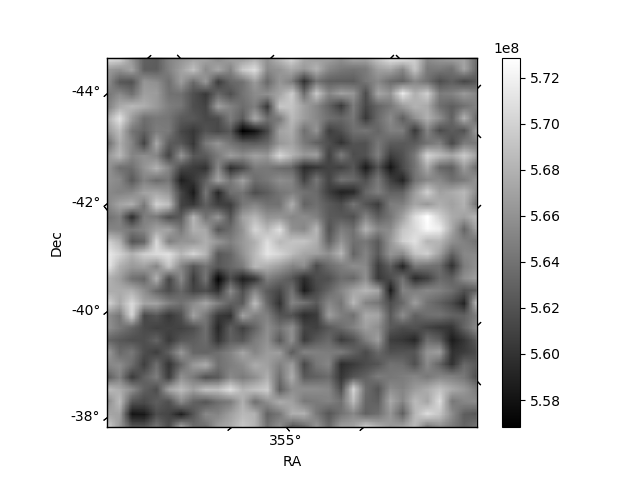
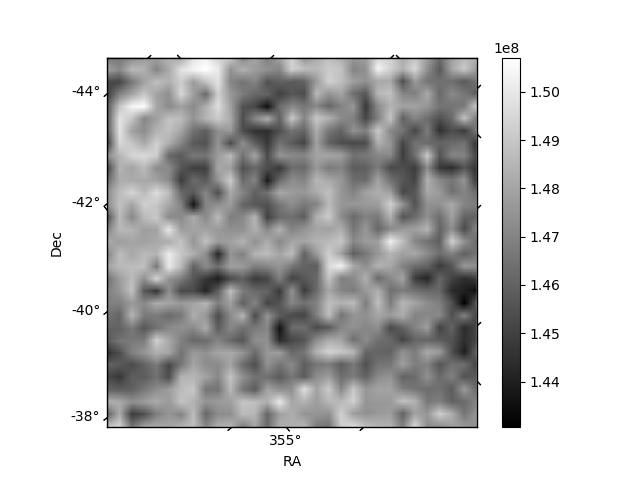
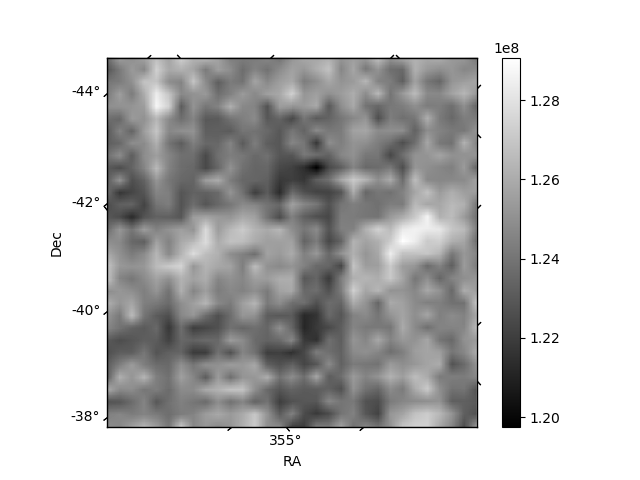
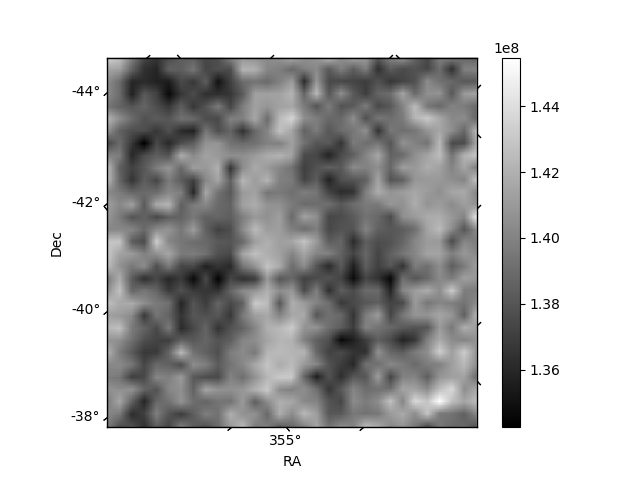
Histogram calculated using DETX and DETY for each event in the final _common_clean file
| Quadrant A | 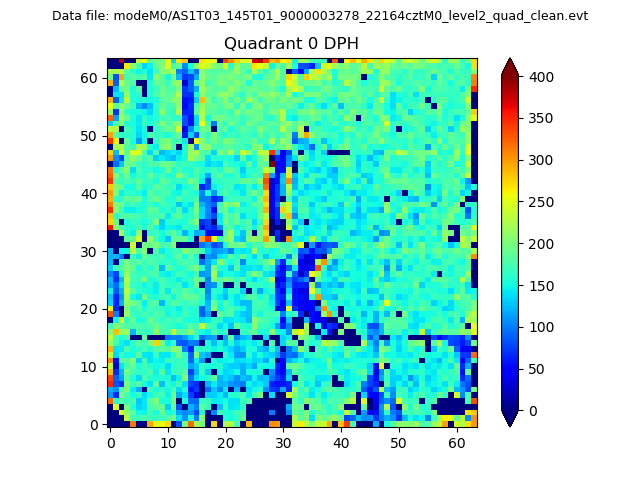 |
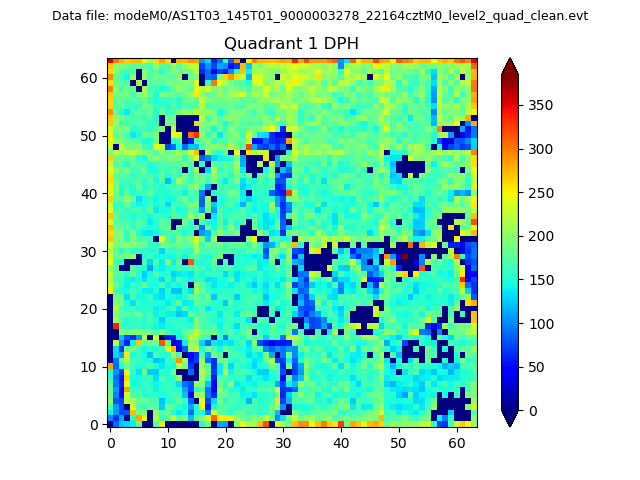 |
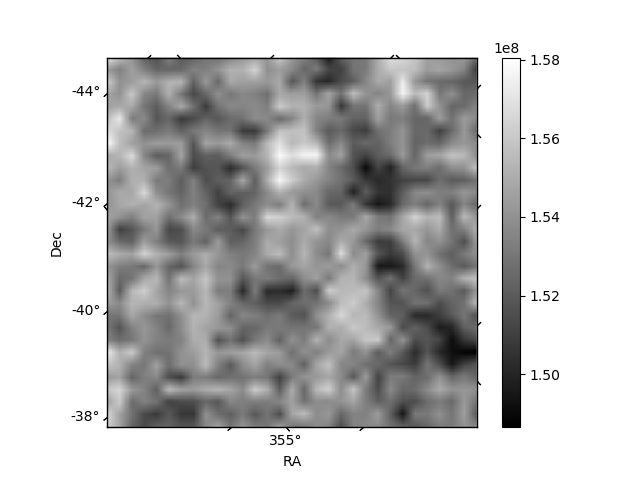
Quadrant B |
|---|---|---|---|
| Quadrant D | 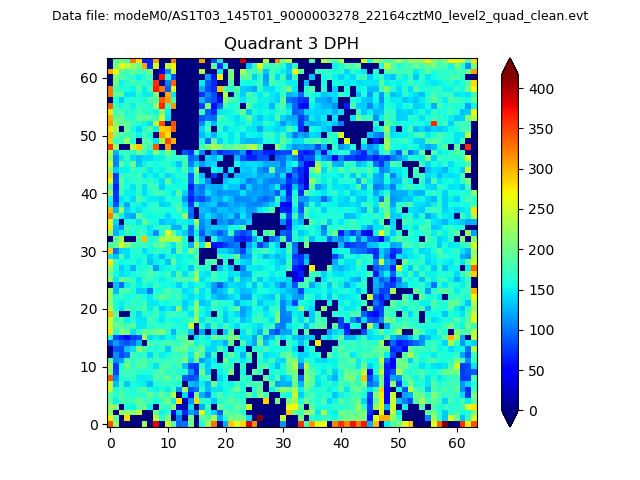 |
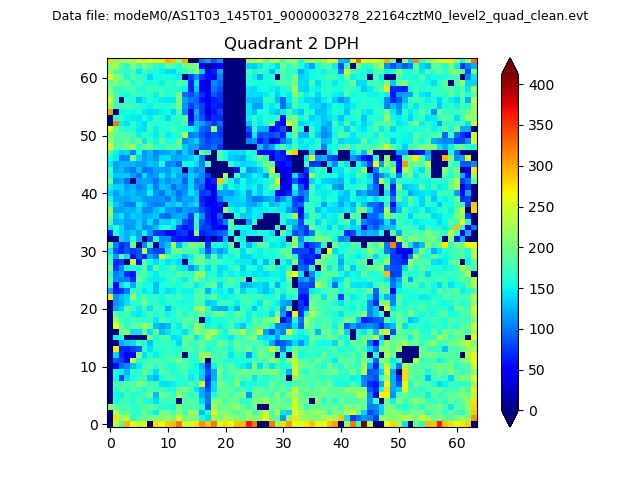 |
Quadrant C |
| Plot type | Count rate plots | Images |
|---|---|---|
| Comparison with Poisson distribution Blue bars denote a histogram of data divided into 1 sec bins. Red curve is a Poisson curve with rate = median count rate of data. |
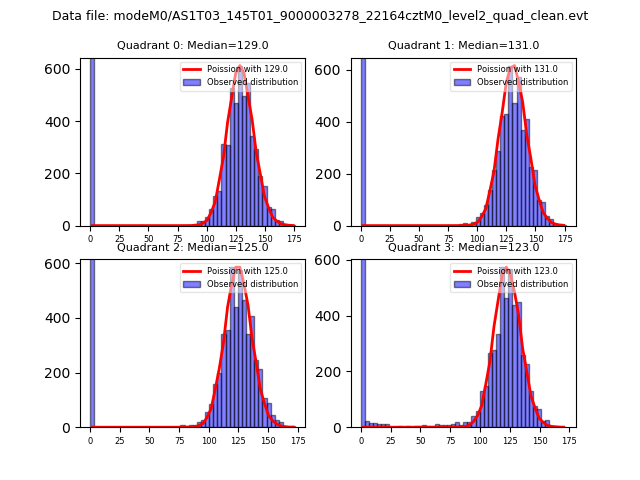 |
 |
| Quadrant-wise count rates Data is divided into 100 sec bins |
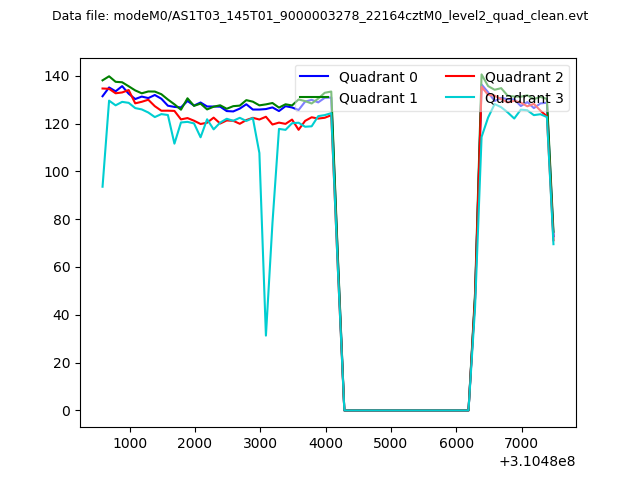 |
|
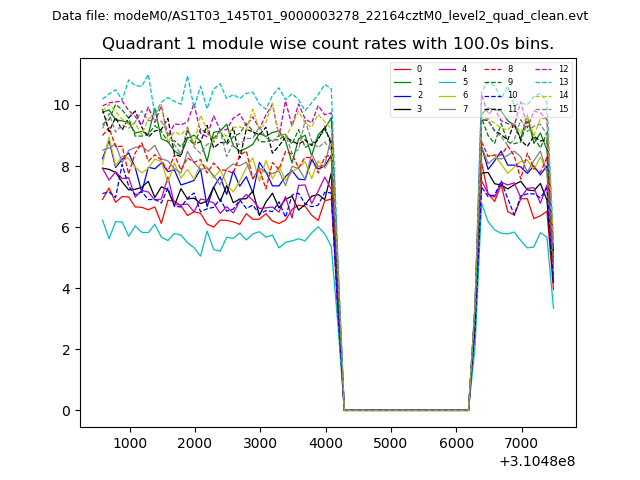
| Module-wise count rates for Quadrant A Data is divided into 100 sec bins |
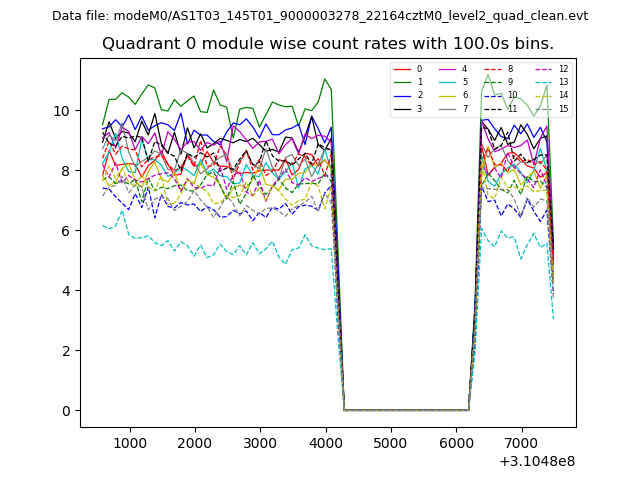 |
 |
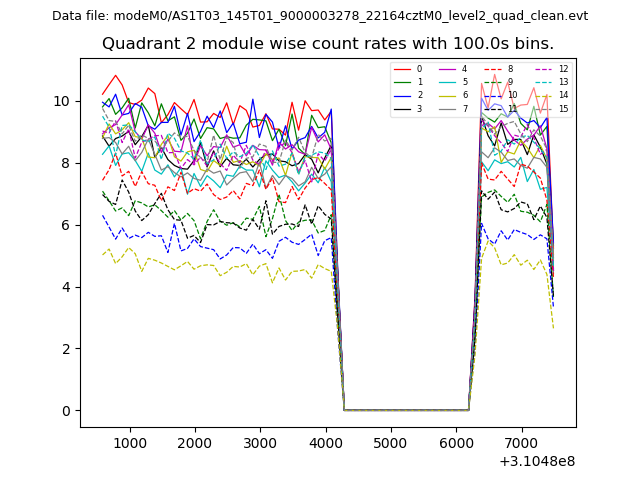
| Module-wise count rates for Quadrant B Data is divided into 100 sec bins |
 |
 |
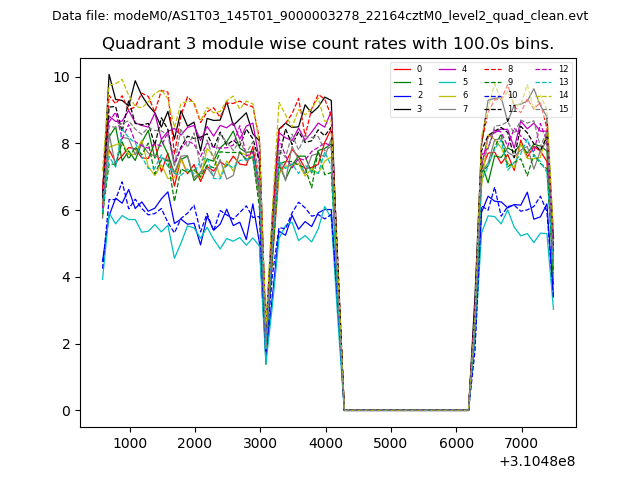
| Module-wise count rates for Quadrant C Data is divided into 100 sec bins |
 |
 |
| Module-wise count rates for Quadrant D Data is divided into 100 sec bins |
 |
 |
| Parameter | Plot |
|---|---|
| CZT HV Monitor | 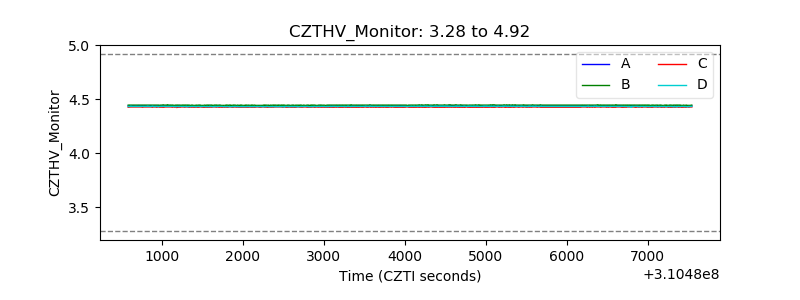 |
| D_VDD | 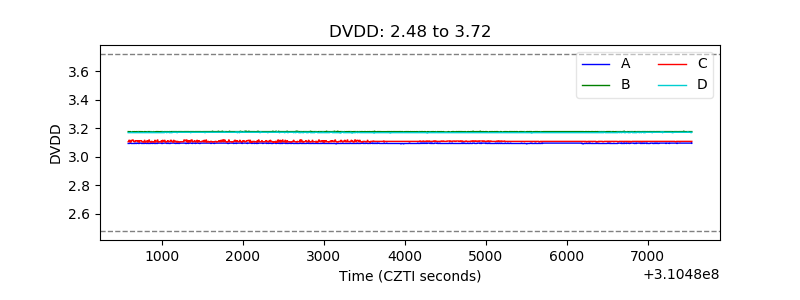 |
| Temperature 1 | 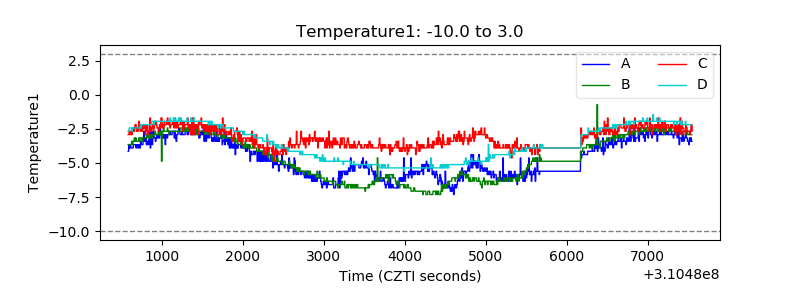 |
| Veto HV Monitor | 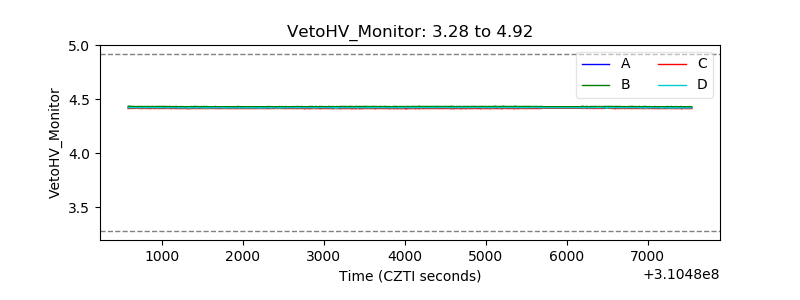 |
| Veto LLD | 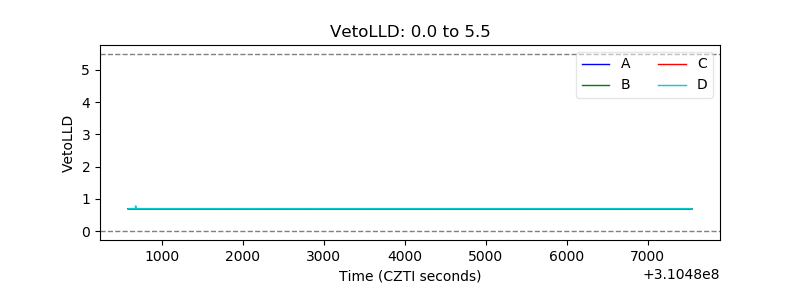 |
| Alpha Counter | 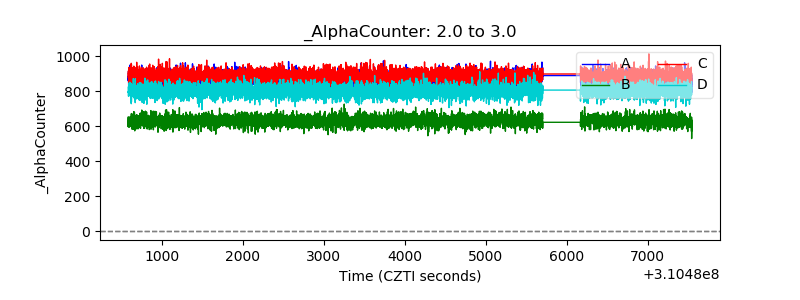 |
| _CPM_Rate | 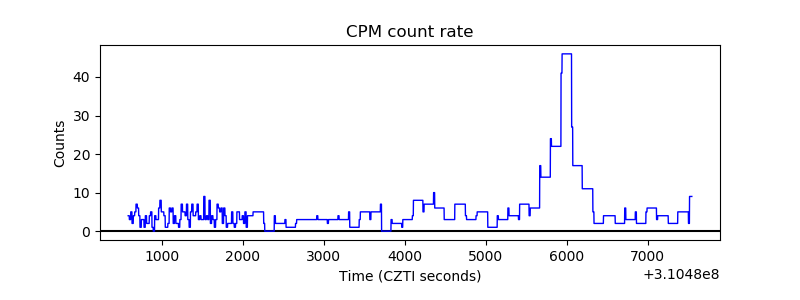 |
| CZT Counter | 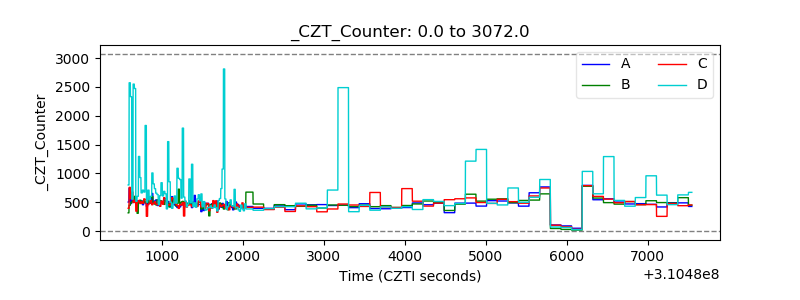 |
| +2.5 Volts monitor |  |
| +5 Volts monitor | 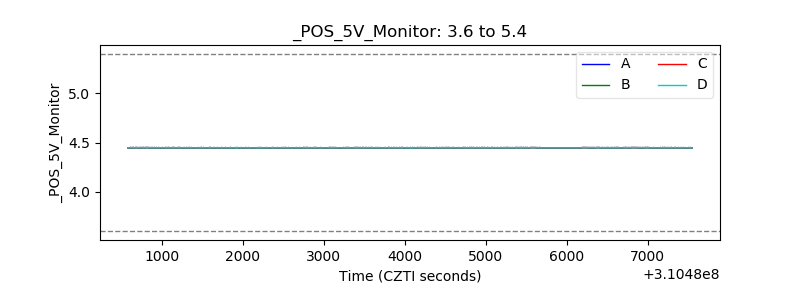 |
| _ROLL_ROT | 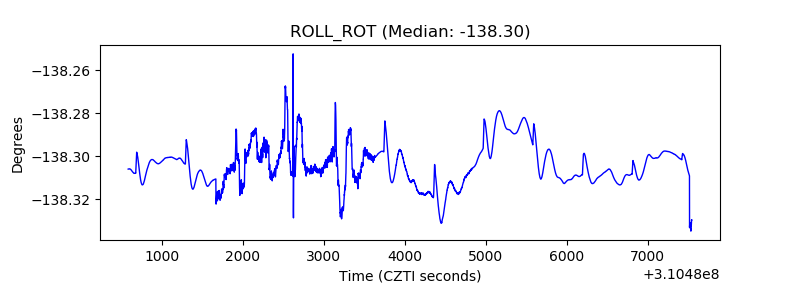 |
| _Roll_DEC | 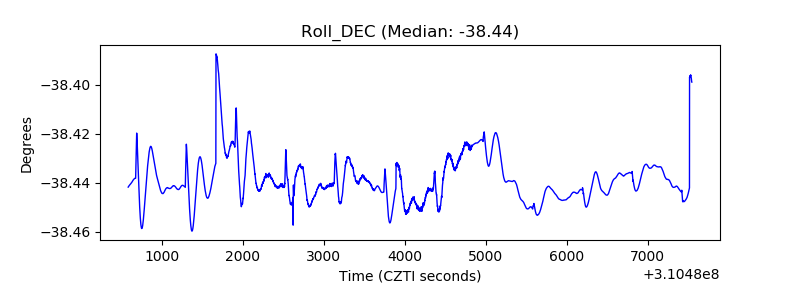 |
| _Roll_RA | 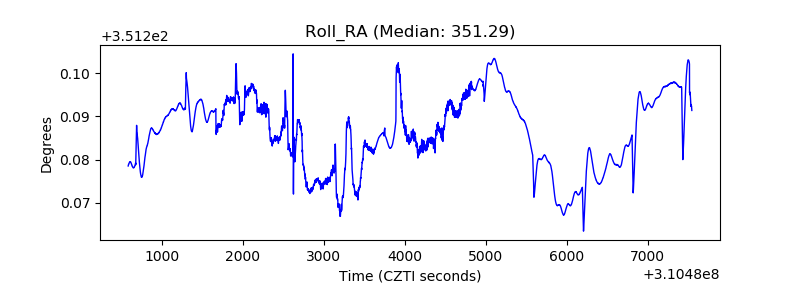 |
| Veto Counter | 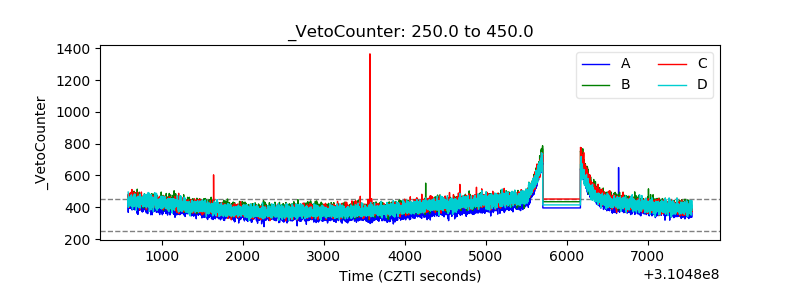 |