| Param | Original file | Final file |
|---|---|---|
| Filename | modeM0/AS1T03_145T01_9000003278_22166cztM0_level2.evt | modeM0/AS1T03_145T01_9000003278_22166cztM0_level2_quad_clean.evt |
| Size (bytes) | 516,254,400 | 102,856,320 |
| Size | 492.3 MB | 98.1 MB |
| Events in quadrant A | 3,489,114 | 666,918 |
| Events in quadrant B | 3,541,829 | 674,790 |
| Events in quadrant C | 3,500,197 | 643,592 |
| Events in quadrant D | 4,602,938 | 616,455 |
| Mode M0 | |||
|---|---|---|---|
| Quadrant | BADHDUFLAG | Total packets | Discarded packets |
| A | 0 | 15304 | 2 |
| B | 0 | 15321 | 3 |
| C | 0 | 15291 | 2 |
| D | 0 | 18638 | 2 |
| Mode SS | |||
|---|---|---|---|
| Quadrant | BADHDUFLAG | Total packets | Discarded packets |
| A | 0 | 150 | 0 |
| B | 0 | 150 | 0 |
| C | 0 | 150 | 0 |
| D | 0 | 150 | 0 |
| Mode M9 | |||
|---|---|---|---|
| Quadrant | BADHDUFLAG | Total packets | Discarded packets |
| A | 0 | 7 | 0 |
| B | 0 | 7 | 0 |
| C | 0 | 7 | 0 |
| D | 0 | 7 | 0 |
| Quadrant | Total seconds | Saturated seconds | Saturation percentage |
|---|---|---|---|
| A | 7379 | 59 | 0.799566% |
| B | 7378 | 100 | 1.355381% |
| C | 7379 | 81 | 1.097710% |
| D | 7379 | 321 | 4.350183% |
Noise dominated data is calculated using 1-second bins in cleaned event files. If a bin has >2000 counts, and if more than 50% of those come from <1% of pixels, then it is considered to be noise-dominated and hence unusable.
| Quadrant | # 1 sec bins | Bins with >0 counts | Bins with >2000 counts | High rate bins dominated by noise | Noise dominated (total time) | Noise dominated (detector-on time) | Marked lightcurve |
|---|---|---|---|---|---|---|---|
| A | 8039 | 7381 | 0 | 0 | 0.00% | 0.00% | 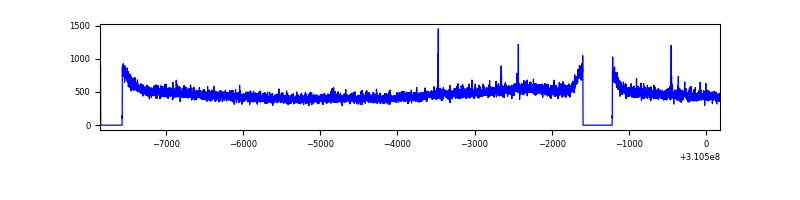 |
| B | 8038 | 7380 | 0 | 0 | 0.00% | 0.00% | 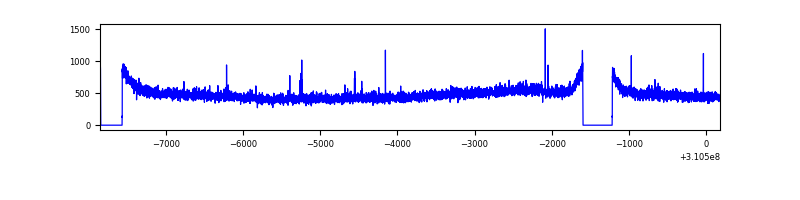 |
| C | 8039 | 7381 | 0 | 0 | 0.00% | 0.00% | 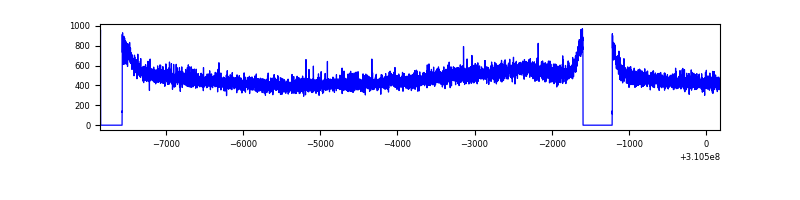 |
| D | 8039 | 7381 | 247 | 247 | 3.07% | 3.35% | 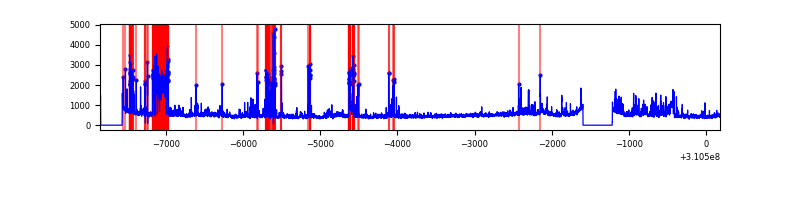 |
Top three noisy pixels from each quadrant. If the there are fewer than three noisy pixels in the level2.evt file, extra rows are filled as -1
| Pixel properties | Quadrant properties | ||||||
|---|---|---|---|---|---|---|---|
| Quadrant | DetID | PixID | Counts | Sigma | Mean | Median | Sigma |
| A | 13 | 254 | 12512 | 63.67 | 902 | 883 | 182.7 |
| A | 3 | 1 | 10619 | 53.3 | 902 | 883 | 182.7 |
| A | 3 | 137 | 8217 | 40.15 | 902 | 883 | 182.7 |
| B | 12 | 111 | 21670 | 120.1 | 898 | 872 | 173.2 |
| B | 11 | 111 | 19451 | 107.28 | 898 | 872 | 173.2 |
| B | 14 | 111 | 16877 | 92.42 | 898 | 872 | 173.2 |
| C | 14 | 238 | 134443 | 658.72 | 858 | 863 | 202.8 |
| C | 8 | 128 | 10929 | 49.64 | 858 | 863 | 202.8 |
| C | 13 | 61 | 5963 | 25.15 | 858 | 863 | 202.8 |
| D | 1 | 52 | 1090892 | 5221.9 | 856 | 830 | 208.7 |
| D | 2 | 136 | 115633 | 549.96 | 856 | 830 | 208.7 |
| D | 13 | 104 | 41340 | 194.06 | 856 | 830 | 208.7 |
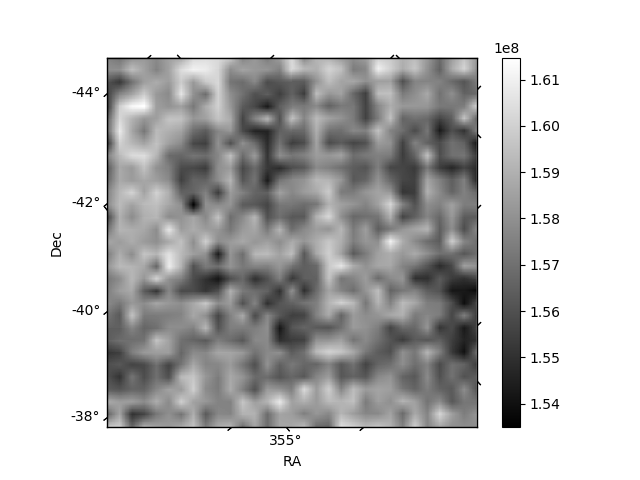
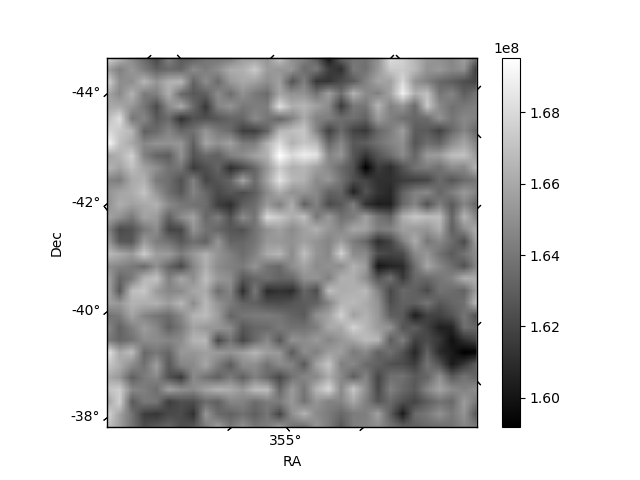
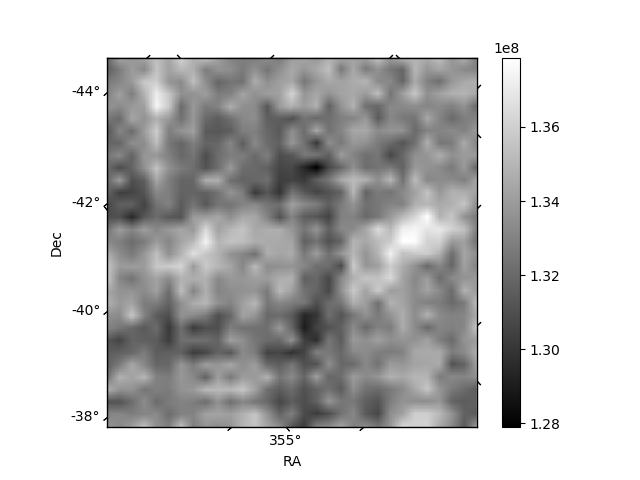
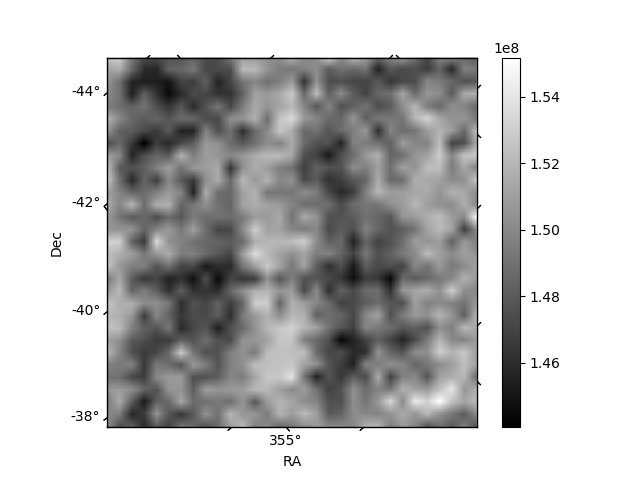
Histogram calculated using DETX and DETY for each event in the final _common_clean file
| Quadrant A | 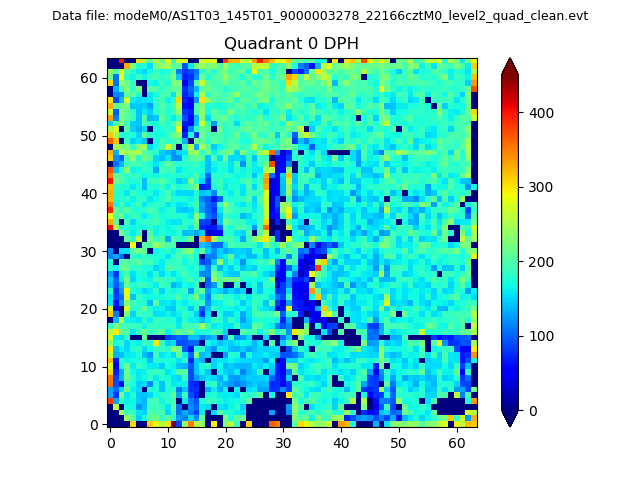 |
 |
Quadrant B |
|---|---|---|---|
| Quadrant D | 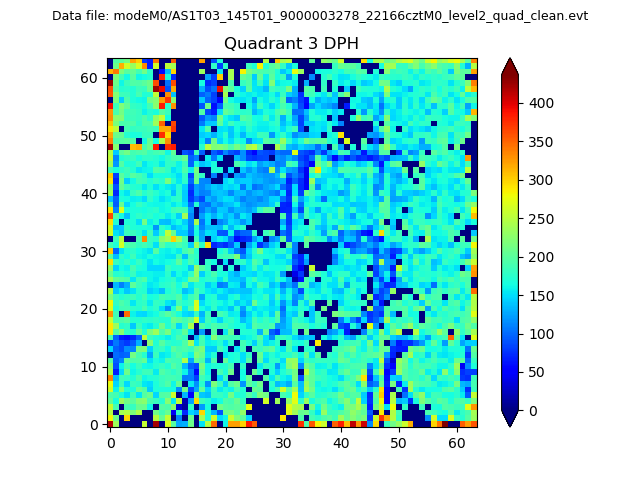 |
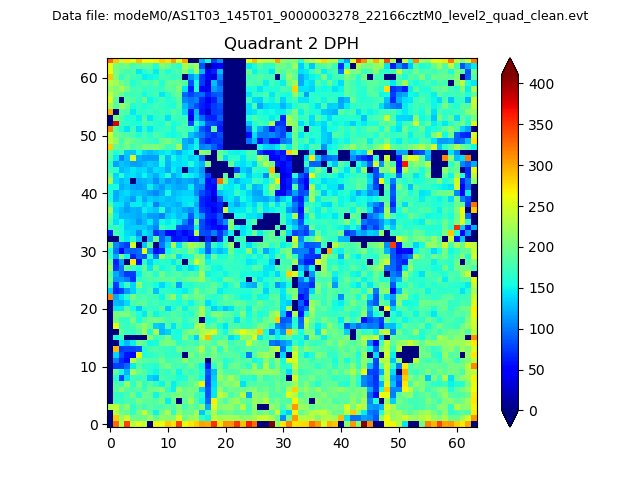 |
Quadrant C |
| Plot type | Count rate plots | Images |
|---|---|---|
| Comparison with Poisson distribution Blue bars denote a histogram of data divided into 1 sec bins. Red curve is a Poisson curve with rate = median count rate of data. |
 |
 |
| Quadrant-wise count rates Data is divided into 100 sec bins |
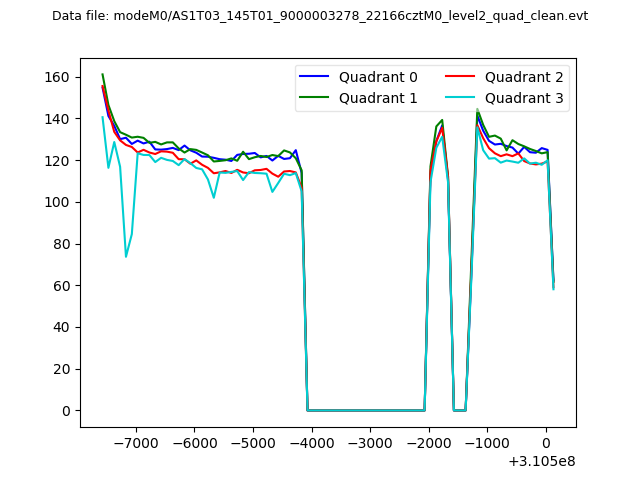 |
|
| Module-wise count rates for Quadrant A Data is divided into 100 sec bins |
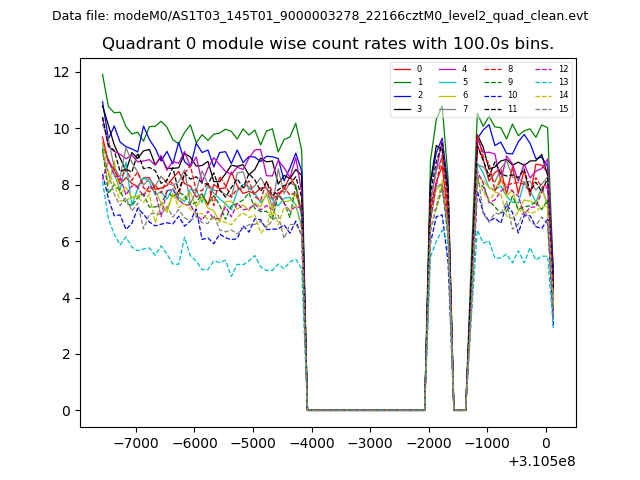 |
 |
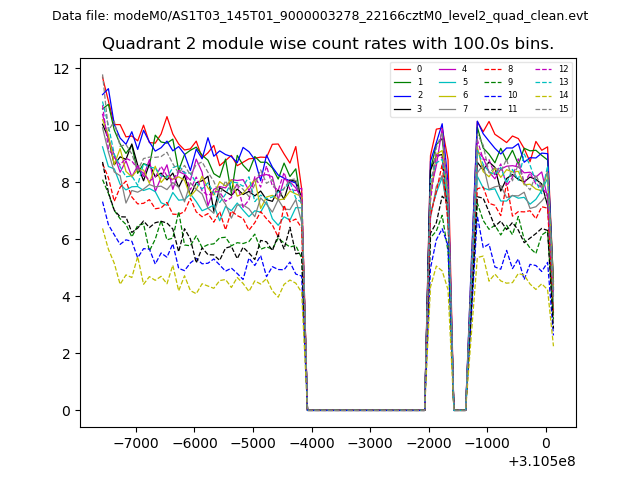
| Module-wise count rates for Quadrant B Data is divided into 100 sec bins |
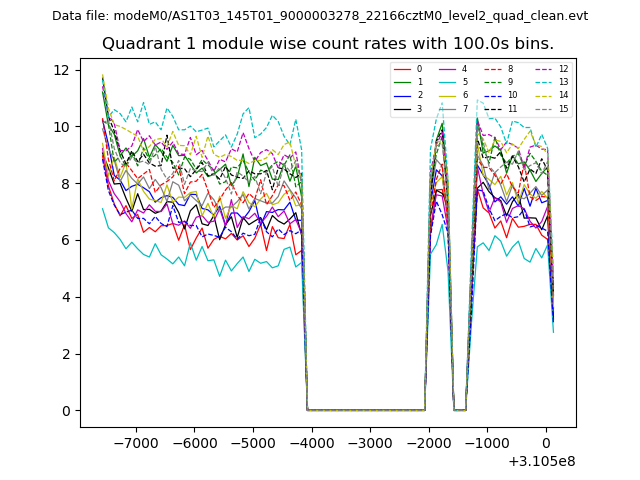 |
 |
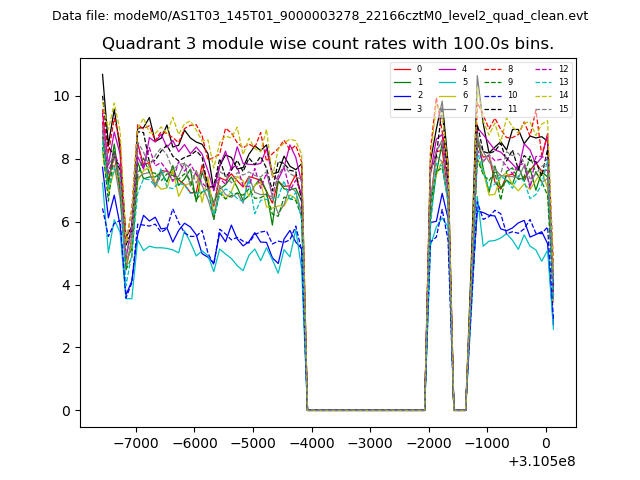
| Module-wise count rates for Quadrant C Data is divided into 100 sec bins |
 |
 |
| Module-wise count rates for Quadrant D Data is divided into 100 sec bins |
 |
 |
| Parameter | Plot |
|---|---|
| CZT HV Monitor | 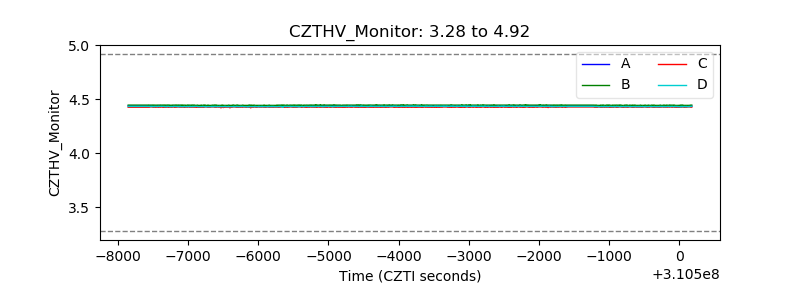 |
| D_VDD | 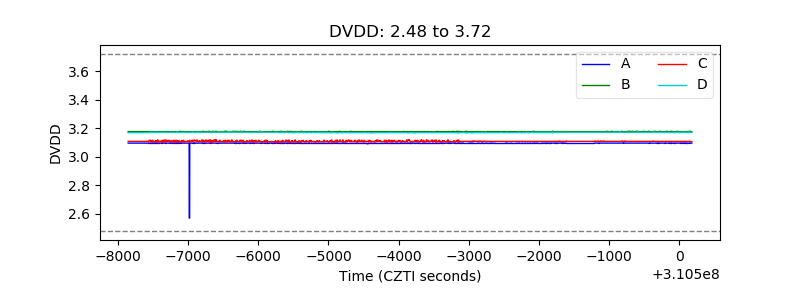 |
| Temperature 1 | 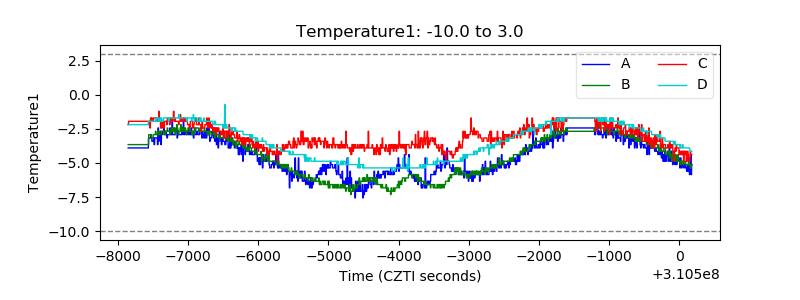 |
| Veto HV Monitor | 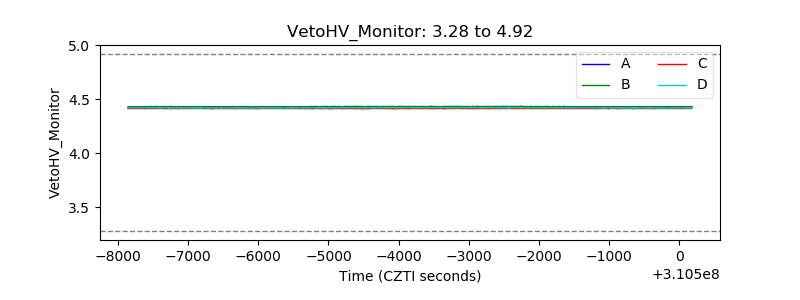 |
| Veto LLD | 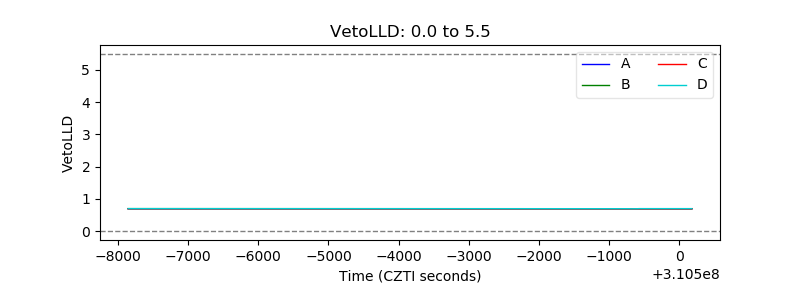 |
| Alpha Counter | 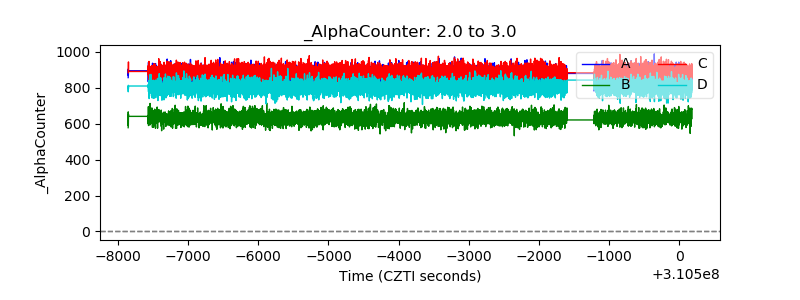 |
| _CPM_Rate | 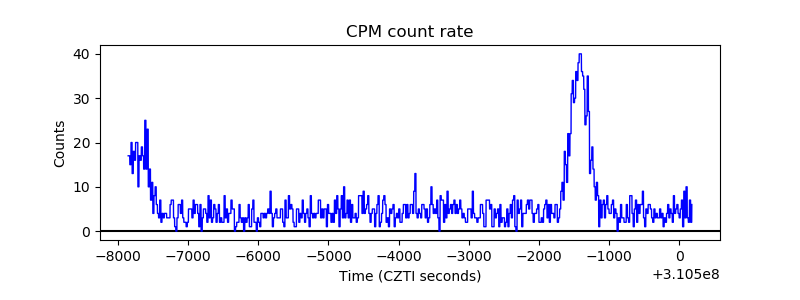 |
| CZT Counter | 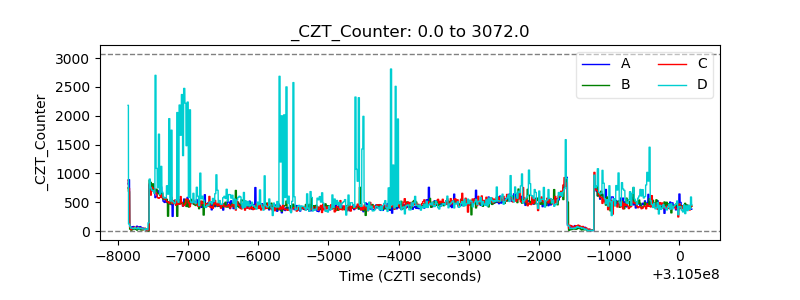 |
| +2.5 Volts monitor |  |
| +5 Volts monitor |  |
| _ROLL_ROT | 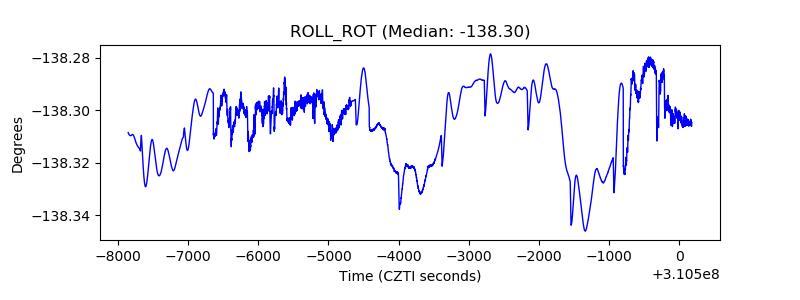 |
| _Roll_DEC | 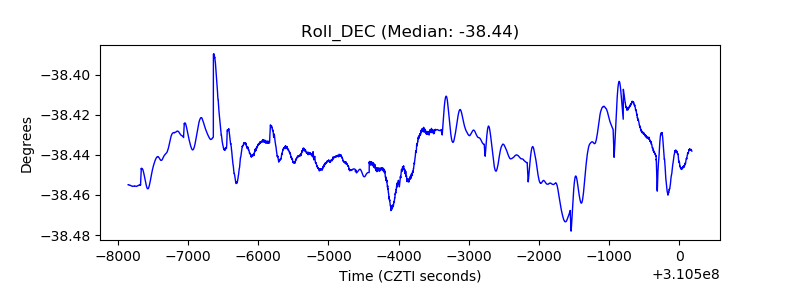 |
| _Roll_RA | 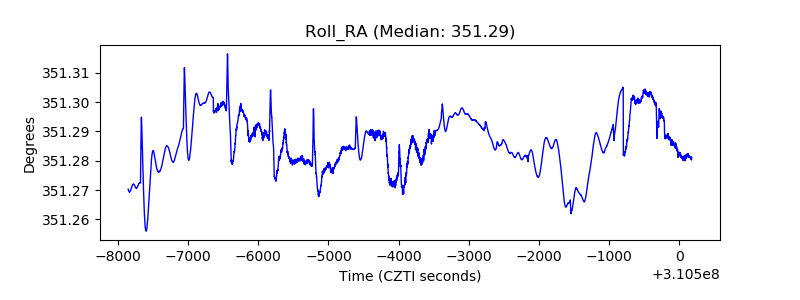 |
| Veto Counter | 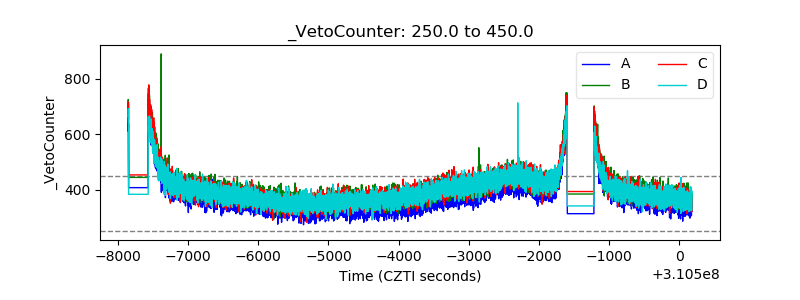 |