| Param | Original file | Final file |
|---|---|---|
| Filename | modeM0/AS1A07_007T03_9000003280cztM0_level2.fits | modeM0/AS1A07_007T03_9000003280cztM0_level2_quad_clean.evt |
| Size (bytes) | 403,090,560 | 331,125,120 |
| Size | 384.4 MB | 315.8 MB |
| Events in quadrant A | 2,557,038 | 1,941,782 |
| Events in quadrant B | 2,431,736 | 1,941,294 |
| Events in quadrant C | 2,426,454 | 1,817,823 |
| Events in quadrant D | 2,133,474 | 1,665,633 |
| Mode M9 | |||
|---|---|---|---|
| Quadrant | BADHDUFLAG | Total packets | Discarded packets |
| A | 0 | 88 | 0 |
| B | 0 | 89 | 0 |
| C | 0 | 89 | 0 |
| D | 0 | 89 | 0 |
| Mode SS | |||
|---|---|---|---|
| Quadrant | BADHDUFLAG | Total packets | Discarded packets |
| A | 0 | 788 | 0 |
| B | 0 | 788 | 0 |
| C | 0 | 788 | 0 |
| D | 0 | 788 | 0 |
| Mode M0 | |||
|---|---|---|---|
| Quadrant | BADHDUFLAG | Total packets | Discarded packets |
| A | 0 | 80429 | 0 |
| B | 0 | 81886 | 0 |
| C | 0 | 80480 | 0 |
| D | 0 | 88851 | 0 |
| Quadrant | Total seconds | Saturated seconds | Saturation percentage |
|---|---|---|---|
| A | 38741 | 331 | 0.854392% |
| B | 38741 | 464 | 1.197698% |
| C | 38741 | 474 | 1.223510% |
| D | 38741 | 631 | 1.628765% |
Noise dominated data is calculated using 1-second bins in cleaned event files. If a bin has >2000 counts, and if more than 50% of those come from <1% of pixels, then it is considered to be noise-dominated and hence unusable.
| Quadrant | # 1 sec bins | Bins with >0 counts | Bins with >2000 counts | High rate bins dominated by noise | Noise dominated (total time) | Noise dominated (detector-on time) | Marked lightcurve |
|---|---|---|---|---|---|---|---|
| A | 47085 | 38740 | 0 | 0 | 0.00% | 0.00% |  |
| B | 47085 | 38740 | 0 | 0 | 0.00% | 0.00% |  |
| C | 47085 | 38740 | 0 | 0 | 0.00% | 0.00% |  |
| D | 47085 | 38733 | 0 | 0 | 0.00% | 0.00% |  |
Top three noisy pixels from each quadrant. If the there are fewer than three noisy pixels in the level2.evt file, extra rows are filled as -1
| Pixel properties | Quadrant properties | ||||||
|---|---|---|---|---|---|---|---|
| Quadrant | DetID | PixID | Counts | Sigma | Mean | Median | Sigma |
| A | 0 | 29 | 2503 | 11.47 | 665 | 627 | 163.5 |
| A | 7 | 110 | 2124 | 9.16 | 665 | 627 | 163.5 |
| A | 0 | 30 | 1867 | 7.58 | 665 | 627 | 163.5 |
| B | 2 | 9 | 1806 | 9.32 | 644 | 618 | 127.5 |
| B | 2 | 8 | 1602 | 7.72 | 644 | 618 | 127.5 |
| B | 14 | 254 | 1582 | 7.56 | 644 | 618 | 127.5 |
| C | 1 | 81 | 1816 | 7.4 | 641 | 602 | 164.1 |
| C | 1 | 80 | 1794 | 7.26 | 641 | 602 | 164.1 |
| C | 12 | 241 | 1674 | 6.53 | 641 | 602 | 164.1 |
| D | 7 | 3 | 1493 | 5.86 | 608 | 556 | 159.8 |
| D | 6 | 231 | 1493 | 5.86 | 608 | 556 | 159.8 |
| D | 15 | 46 | 1486 | 5.82 | 608 | 556 | 159.8 |
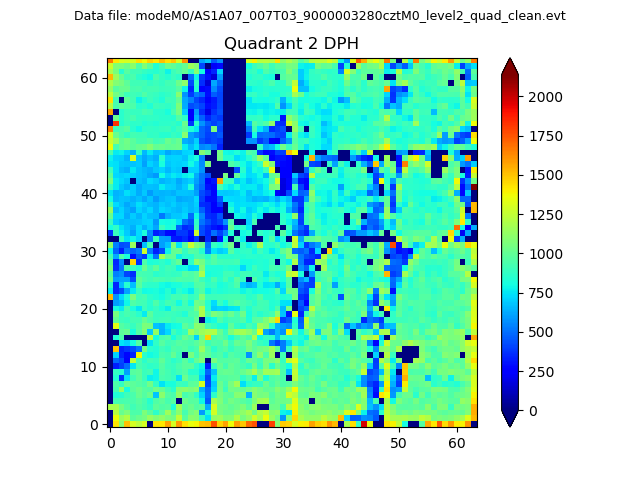
Histogram calculated using DETX and DETY for each event in the final _common_clean file
| Quadrant A | 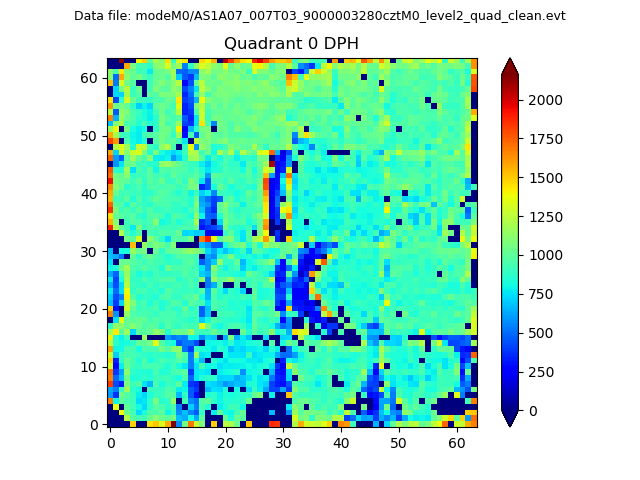 |
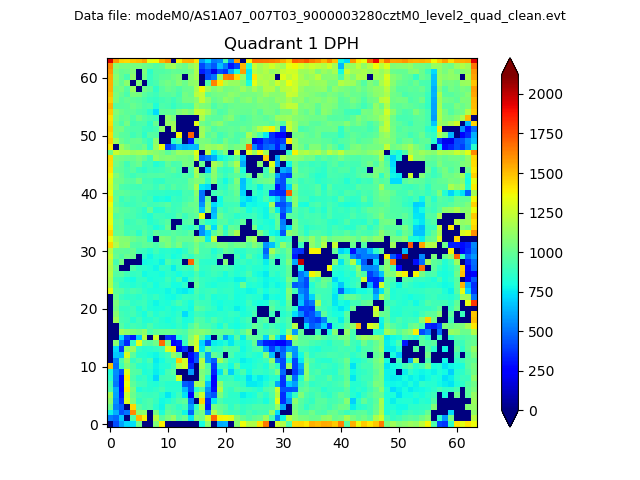 |
Quadrant B |
|---|---|---|---|
| Quadrant D | 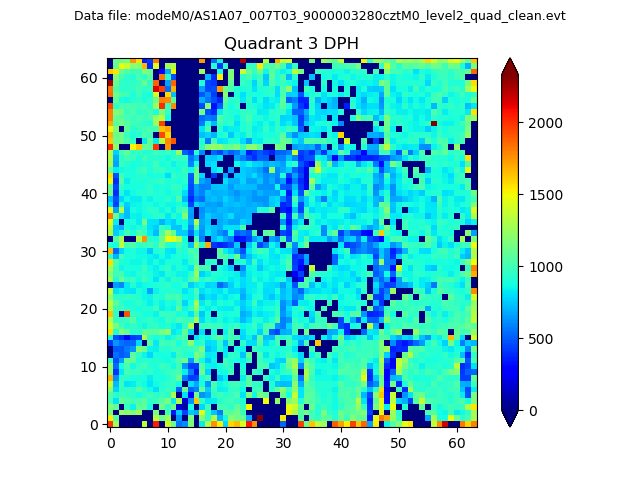 |
 |
Quadrant C |
| Plot type | Count rate plots | Images |
|---|---|---|
| Comparison with Poisson distribution Blue bars denote a histogram of data divided into 1 sec bins. Red curve is a Poisson curve with rate = median count rate of data. |
 |
 |
| Quadrant-wise count rates Data is divided into 100 sec bins |
 |
|
| Module-wise count rates for Quadrant A Data is divided into 100 sec bins |
 |
 |
| Module-wise count rates for Quadrant B Data is divided into 100 sec bins |
 |
 |
| Module-wise count rates for Quadrant C Data is divided into 100 sec bins |
 |
 |
| Module-wise count rates for Quadrant D Data is divided into 100 sec bins |
 |
 |
| Parameter | Plot |
|---|---|
| CZT HV Monitor |  |
| D_VDD | 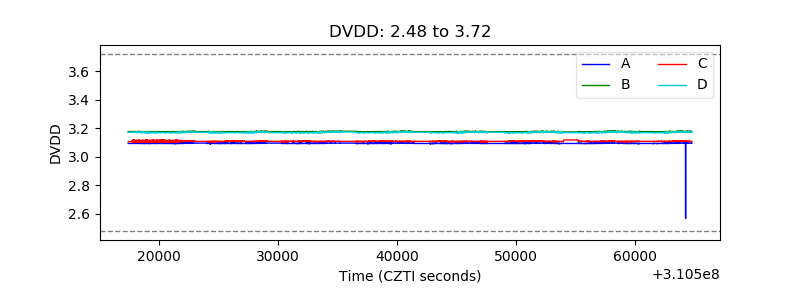 |
| Temperature 1 | 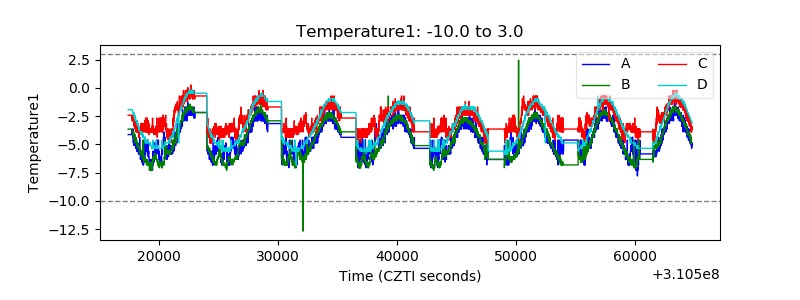 |
| Veto HV Monitor |  |
| Veto LLD |  |
| Alpha Counter |  |
| _CPM_Rate |  |
| CZT Counter | 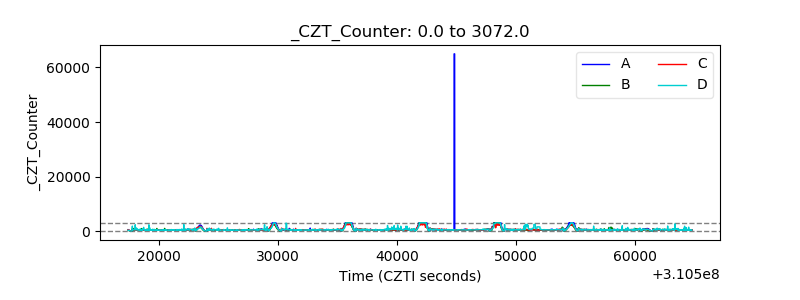 |
| +2.5 Volts monitor | 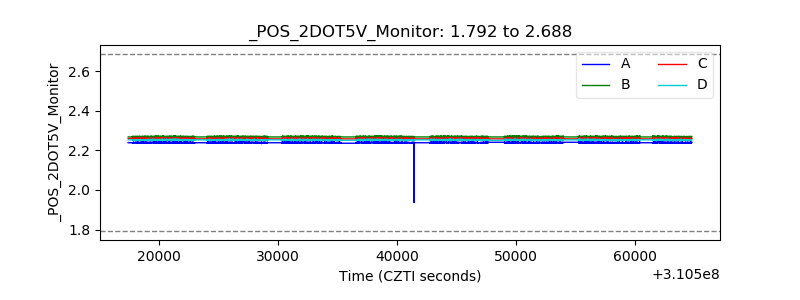 |
| +5 Volts monitor |  |
| _ROLL_ROT |  |
| _Roll_DEC | 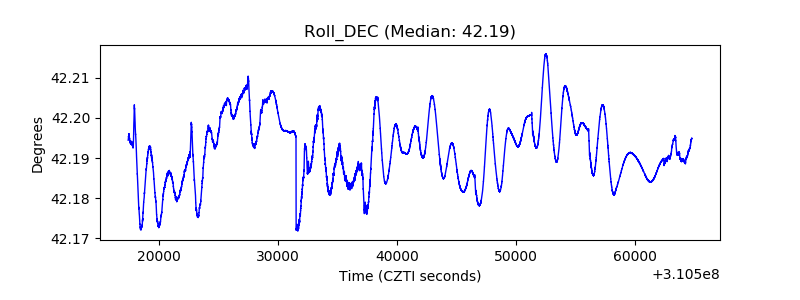 |
| _Roll_RA | 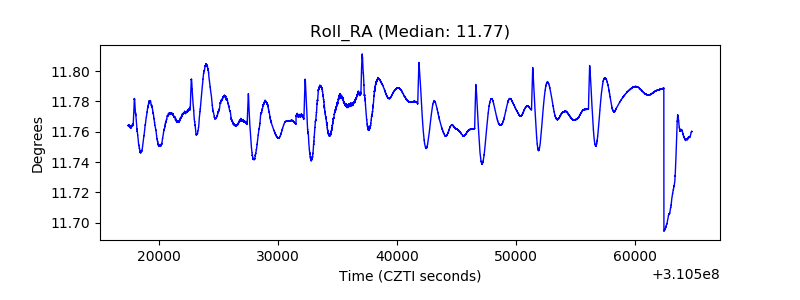 |
| Veto Counter |  |