| Param | Original file | Final file |
|---|---|---|
| Filename | modeM0/AS1A07_007T03_9000003280_22170cztM0_level2.evt | modeM0/AS1A07_007T03_9000003280_22170cztM0_level2_quad_clean.evt |
| Size (bytes) | 437,688,000 | 97,064,640 |
| Size | 417.4 MB | 92.6 MB |
| Events in quadrant A | 3,074,058 | 629,091 |
| Events in quadrant B | 3,193,969 | 638,173 |
| Events in quadrant C | 3,164,501 | 612,118 |
| Events in quadrant D | 3,368,415 | 594,272 |
| Mode M9 | |||
|---|---|---|---|
| Quadrant | BADHDUFLAG | Total packets | Discarded packets |
| A | 0 | 13 | 0 |
| B | 0 | 14 | 0 |
| C | 0 | 14 | 0 |
| D | 0 | 14 | 0 |
| Mode SS | |||
|---|---|---|---|
| Quadrant | BADHDUFLAG | Total packets | Discarded packets |
| A | 0 | 136 | 0 |
| B | 0 | 136 | 0 |
| C | 0 | 136 | 0 |
| D | 0 | 136 | 0 |
| Mode M0 | |||
|---|---|---|---|
| Quadrant | BADHDUFLAG | Total packets | Discarded packets |
| A | 0 | 13576 | 2 |
| B | 0 | 13778 | 2 |
| C | 0 | 13718 | 2 |
| D | 0 | 14669 | 2 |
| Quadrant | Total seconds | Saturated seconds | Saturation percentage |
|---|---|---|---|
| A | 6682 | 21 | 0.314277% |
| B | 6682 | 33 | 0.493864% |
| C | 6682 | 60 | 0.897935% |
| D | 6682 | 62 | 0.927866% |
Noise dominated data is calculated using 1-second bins in cleaned event files. If a bin has >2000 counts, and if more than 50% of those come from <1% of pixels, then it is considered to be noise-dominated and hence unusable.
| Quadrant | # 1 sec bins | Bins with >0 counts | Bins with >2000 counts | High rate bins dominated by noise | Noise dominated (total time) | Noise dominated (detector-on time) | Marked lightcurve |
|---|---|---|---|---|---|---|---|
| A | 7687 | 6683 | 0 | 0 | 0.00% | 0.00% | 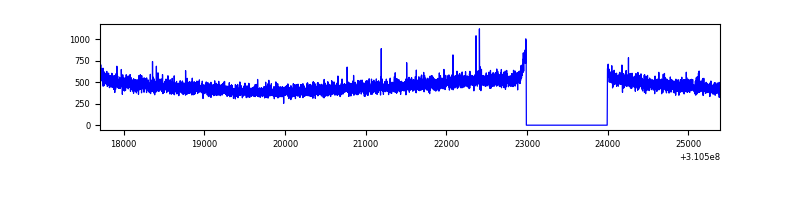 |
| B | 7687 | 6683 | 1 | 1 | 0.01% | 0.01% | 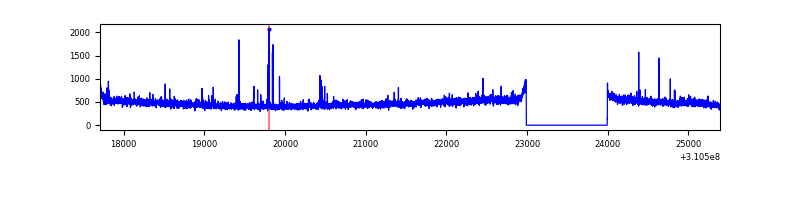 |
| C | 7687 | 6683 | 0 | 0 | 0.00% | 0.00% | 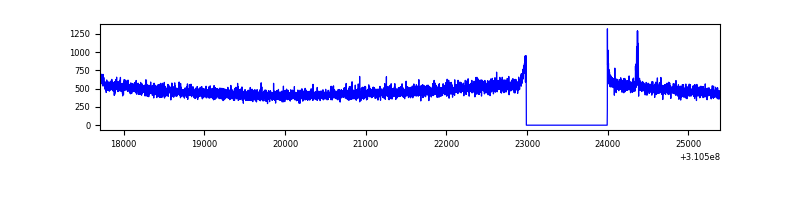 |
| D | 7687 | 6683 | 31 | 31 | 0.40% | 0.46% | 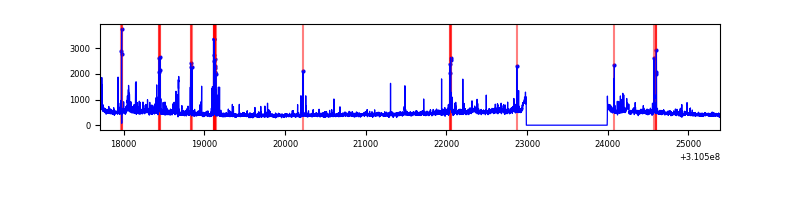 |
Top three noisy pixels from each quadrant. If the there are fewer than three noisy pixels in the level2.evt file, extra rows are filled as -1
| Pixel properties | Quadrant properties | ||||||
|---|---|---|---|---|---|---|---|
| Quadrant | DetID | PixID | Counts | Sigma | Mean | Median | Sigma |
| A | 13 | 254 | 12400 | 72.55 | 796 | 780 | 160.2 |
| A | 0 | 226 | 6824 | 37.74 | 796 | 780 | 160.2 |
| A | 3 | 137 | 6732 | 37.16 | 796 | 780 | 160.2 |
| B | 3 | 64 | 25670 | 162.43 | 798 | 777 | 153.3 |
| B | 0 | 230 | 19909 | 124.84 | 798 | 777 | 153.3 |
| B | 12 | 111 | 18460 | 115.39 | 798 | 777 | 153.3 |
| C | 14 | 238 | 120937 | 661.86 | 773 | 778 | 181.5 |
| C | 10 | 22 | 11759 | 60.49 | 773 | 778 | 181.5 |
| C | 8 | 128 | 10032 | 50.97 | 773 | 778 | 181.5 |
| D | 1 | 52 | 280750 | 1480.51 | 774 | 750 | 189.1 |
| D | 14 | 34 | 68171 | 356.49 | 774 | 750 | 189.1 |
| D | 15 | 145 | 33085 | 170.97 | 774 | 750 | 189.1 |
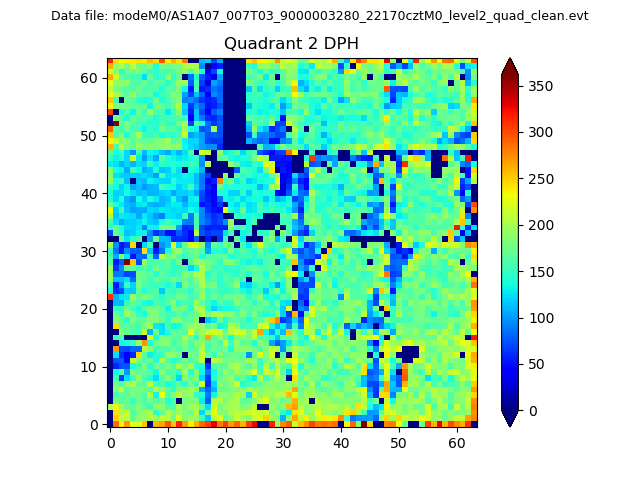
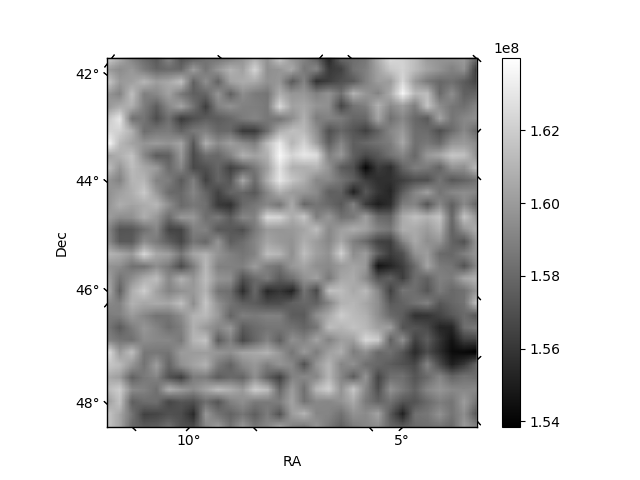
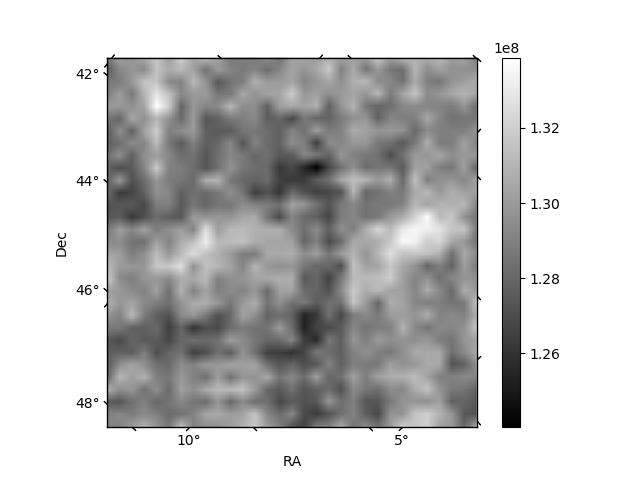
Histogram calculated using DETX and DETY for each event in the final _common_clean file
| Quadrant A | 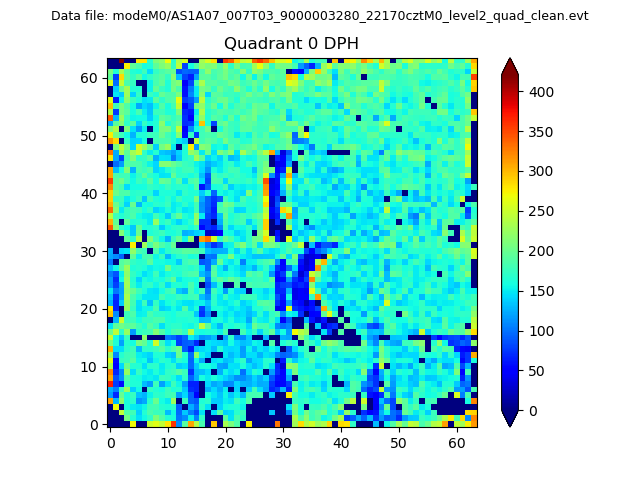 |
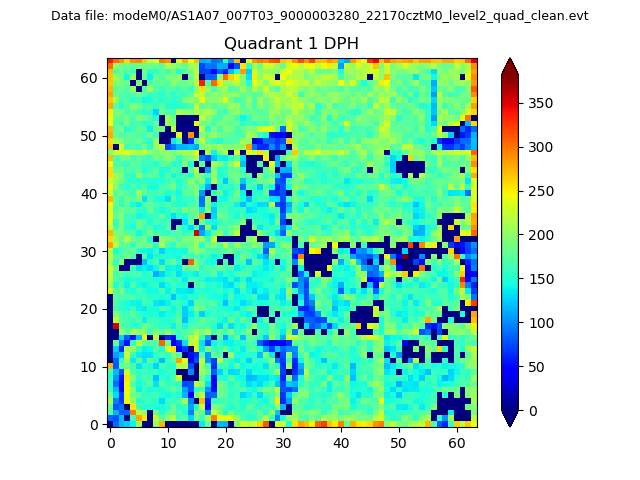 |
Quadrant B |
|---|---|---|---|
| Quadrant D | 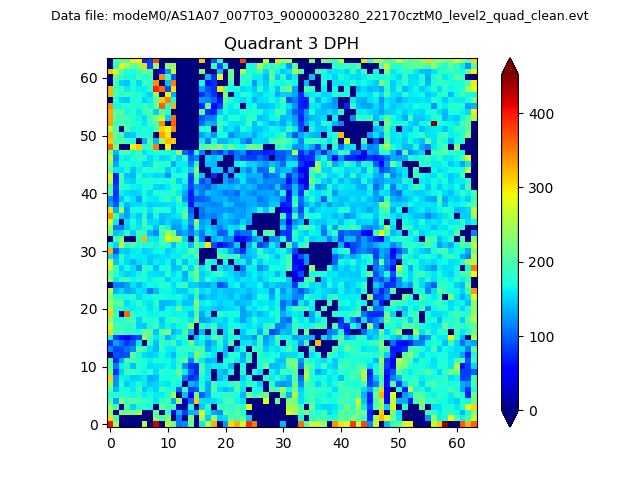 |
 |
Quadrant C |
| Plot type | Count rate plots | Images |
|---|---|---|
| Comparison with Poisson distribution Blue bars denote a histogram of data divided into 1 sec bins. Red curve is a Poisson curve with rate = median count rate of data. |
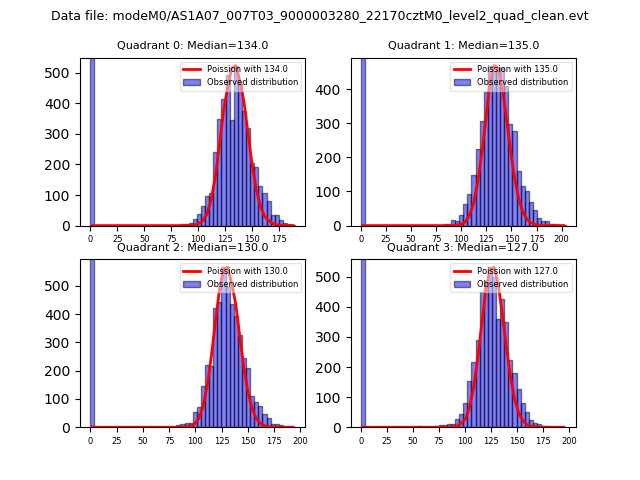 |
 |
| Quadrant-wise count rates Data is divided into 100 sec bins |
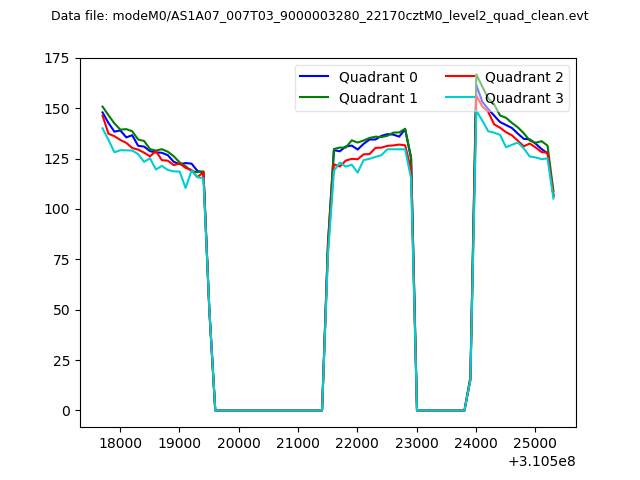 |
|
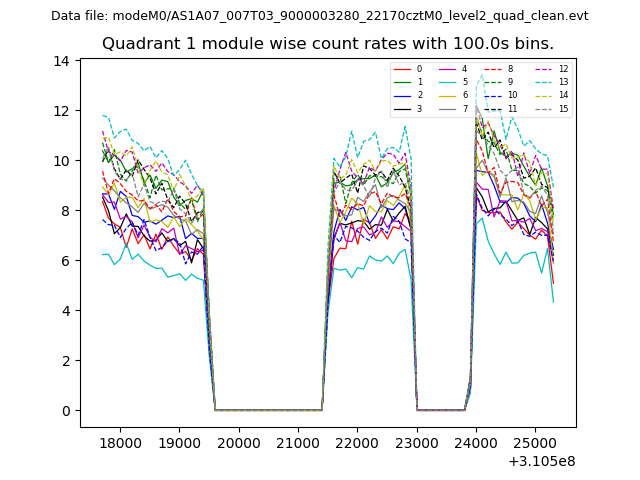
| Module-wise count rates for Quadrant A Data is divided into 100 sec bins |
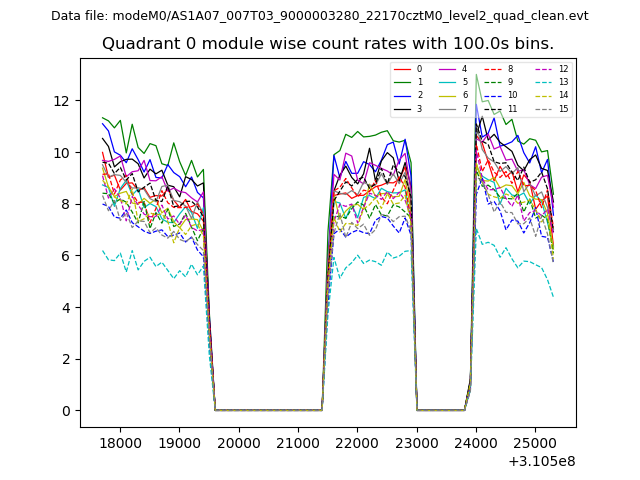 |
 |
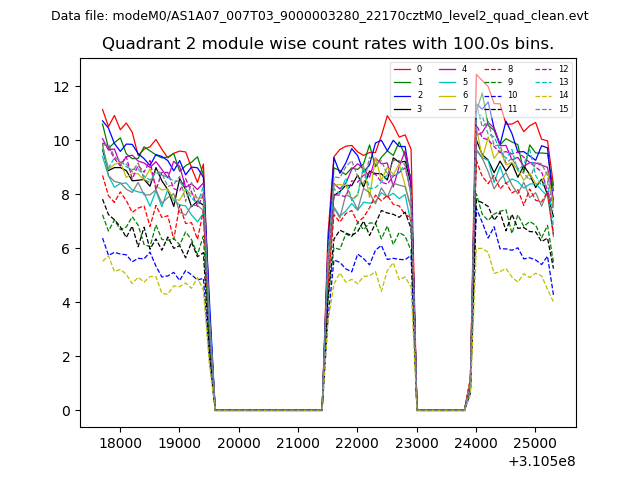
| Module-wise count rates for Quadrant B Data is divided into 100 sec bins |
 |
 |
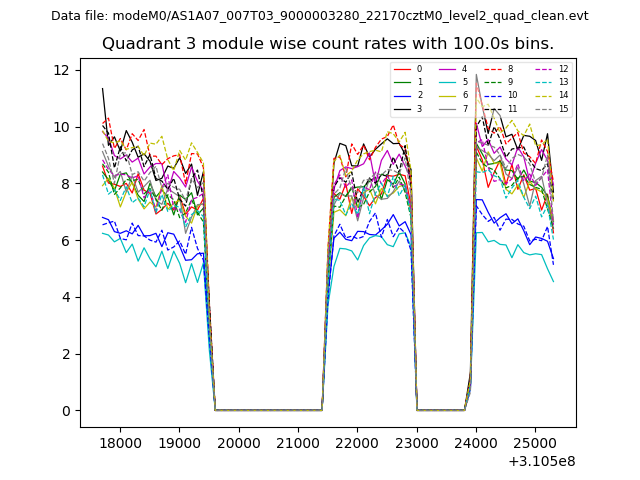
| Module-wise count rates for Quadrant C Data is divided into 100 sec bins |
 |
 |
| Module-wise count rates for Quadrant D Data is divided into 100 sec bins |
 |
 |
| Parameter | Plot |
|---|---|
| CZT HV Monitor | 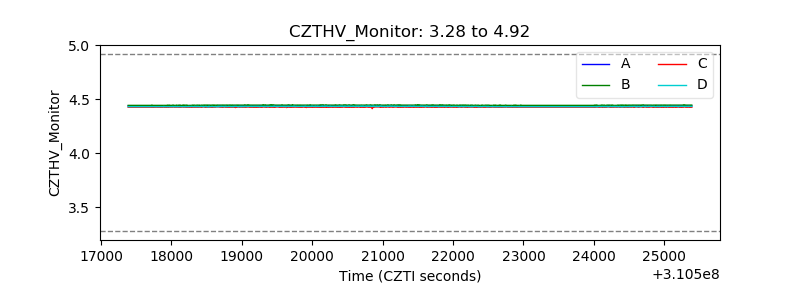 |
| D_VDD | 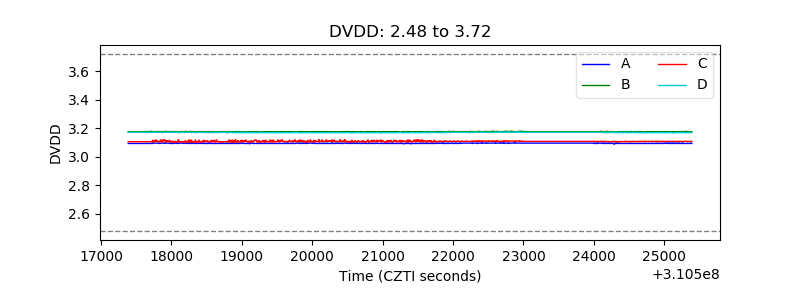 |
| Temperature 1 | 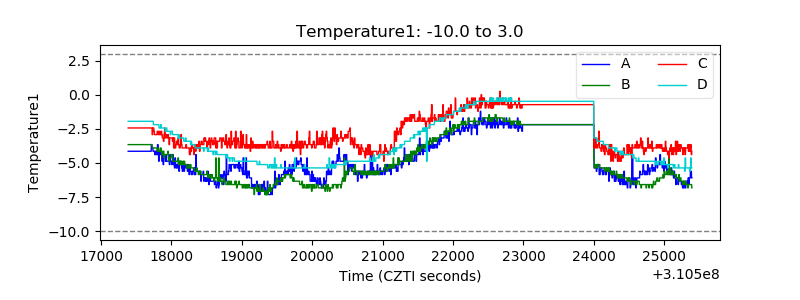 |
| Veto HV Monitor | 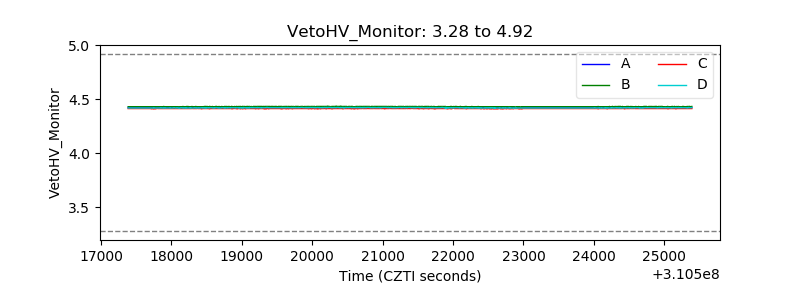 |
| Veto LLD | 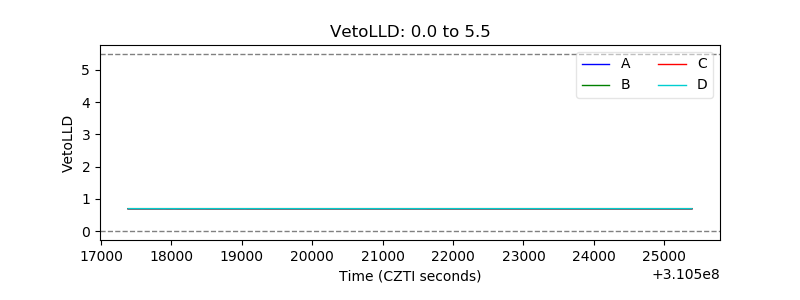 |
| Alpha Counter | 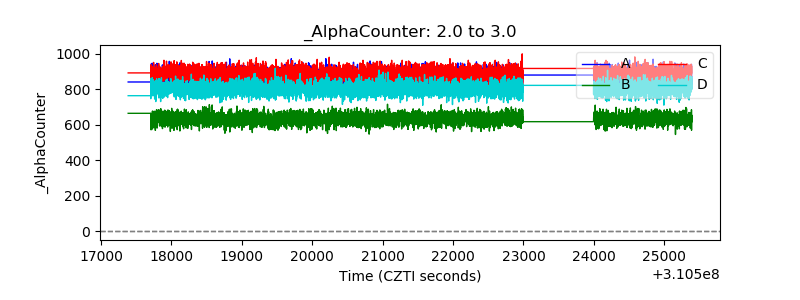 |
| _CPM_Rate | 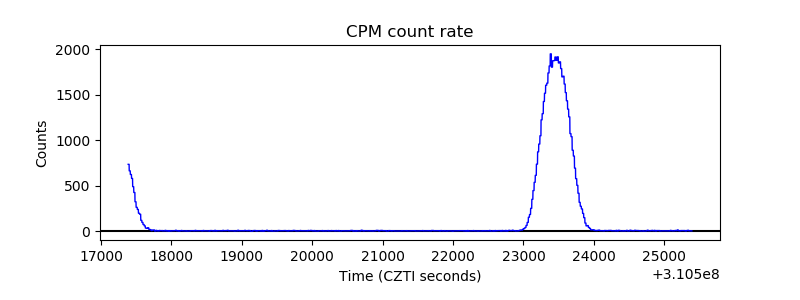 |
| CZT Counter | 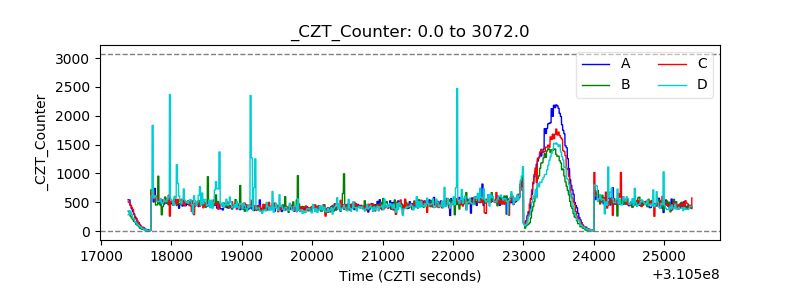 |
| +2.5 Volts monitor |  |
| +5 Volts monitor |  |
| _ROLL_ROT | 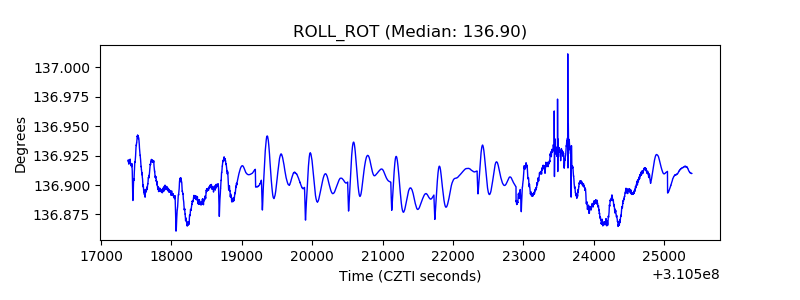 |
| _Roll_DEC | 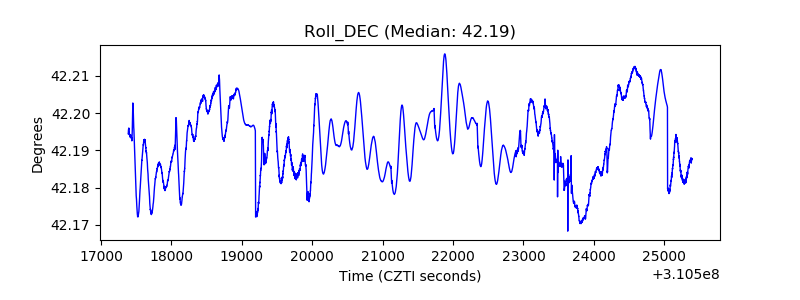 |
| _Roll_RA |  |
| Veto Counter | 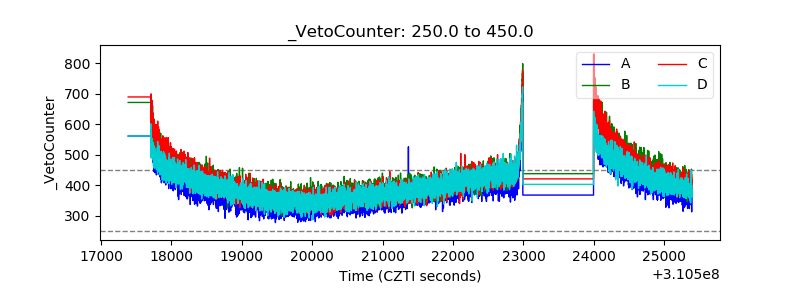 |