| Param | Original file | Final file |
|---|---|---|
| Filename | modeM0/AS1A07_007T03_9000003280_22172cztM0_level2.evt | modeM0/AS1A07_007T03_9000003280_22172cztM0_level2_quad_clean.evt |
| Size (bytes) | 460,782,720 | 97,439,040 |
| Size | 439.4 MB | 92.9 MB |
| Events in quadrant A | 3,260,198 | 632,808 |
| Events in quadrant B | 3,377,029 | 646,507 |
| Events in quadrant C | 3,313,235 | 611,611 |
| Events in quadrant D | 3,542,986 | 586,865 |
| Mode M9 | |||
|---|---|---|---|
| Quadrant | BADHDUFLAG | Total packets | Discarded packets |
| A | 0 | 21 | 0 |
| B | 0 | 21 | 0 |
| C | 0 | 21 | 0 |
| D | 0 | 21 | 0 |
| Mode SS | |||
|---|---|---|---|
| Quadrant | BADHDUFLAG | Total packets | Discarded packets |
| A | 0 | 140 | 0 |
| B | 0 | 140 | 0 |
| C | 0 | 140 | 0 |
| D | 0 | 140 | 0 |
| Mode M0 | |||
|---|---|---|---|
| Quadrant | BADHDUFLAG | Total packets | Discarded packets |
| A | 0 | 13977 | 2 |
| B | 0 | 14247 | 2 |
| C | 0 | 14100 | 2 |
| D | 0 | 15217 | 2 |
| Quadrant | Total seconds | Saturated seconds | Saturation percentage |
|---|---|---|---|
| A | 6786 | 31 | 0.456823% |
| B | 6786 | 49 | 0.722075% |
| C | 6786 | 79 | 1.164162% |
| D | 6787 | 141 | 2.077501% |
Noise dominated data is calculated using 1-second bins in cleaned event files. If a bin has >2000 counts, and if more than 50% of those come from <1% of pixels, then it is considered to be noise-dominated and hence unusable.
| Quadrant | # 1 sec bins | Bins with >0 counts | Bins with >2000 counts | High rate bins dominated by noise | Noise dominated (total time) | Noise dominated (detector-on time) | Marked lightcurve |
|---|---|---|---|---|---|---|---|
| A | 8936 | 6788 | 0 | 0 | 0.00% | 0.00% | 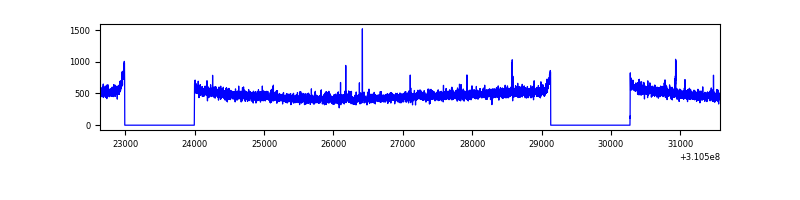 |
| B | 8936 | 6788 | 2 | 2 | 0.02% | 0.03% | 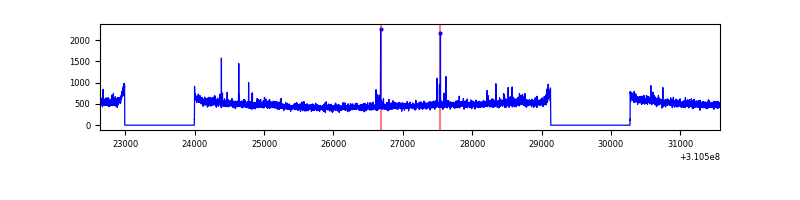 |
| C | 8936 | 6788 | 0 | 0 | 0.00% | 0.00% | 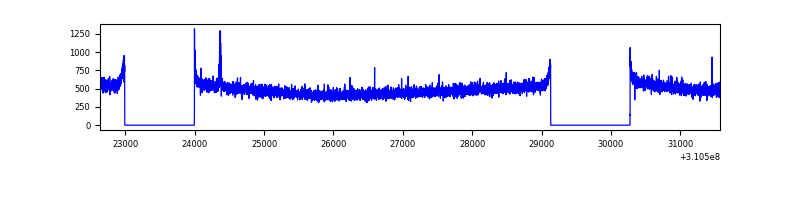 |
| D | 8937 | 6789 | 92 | 92 | 1.03% | 1.36% | 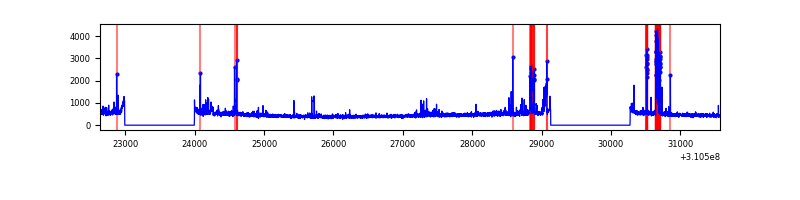 |
Top three noisy pixels from each quadrant. If the there are fewer than three noisy pixels in the level2.evt file, extra rows are filled as -1
| Pixel properties | Quadrant properties | ||||||
|---|---|---|---|---|---|---|---|
| Quadrant | DetID | PixID | Counts | Sigma | Mean | Median | Sigma |
| A | 3 | 1 | 18847 | 106.9 | 840 | 823 | 168.6 |
| A | 13 | 254 | 12123 | 67.02 | 840 | 823 | 168.6 |
| A | 0 | 226 | 7319 | 38.53 | 840 | 823 | 168.6 |
| B | 12 | 111 | 19181 | 115.48 | 844 | 824 | 159.0 |
| B | 0 | 230 | 18649 | 112.14 | 844 | 824 | 159.0 |
| B | 3 | 64 | 16986 | 101.67 | 844 | 824 | 159.0 |
| C | 14 | 238 | 130058 | 677.65 | 812 | 817 | 190.7 |
| C | 10 | 22 | 11666 | 56.88 | 812 | 817 | 190.7 |
| C | 0 | 10 | 5659 | 25.39 | 812 | 817 | 190.7 |
| D | 1 | 52 | 277708 | 1423.42 | 806 | 785 | 194.5 |
| D | 13 | 172 | 132501 | 677.04 | 806 | 785 | 194.5 |
| D | 2 | 136 | 38918 | 196.01 | 806 | 785 | 194.5 |
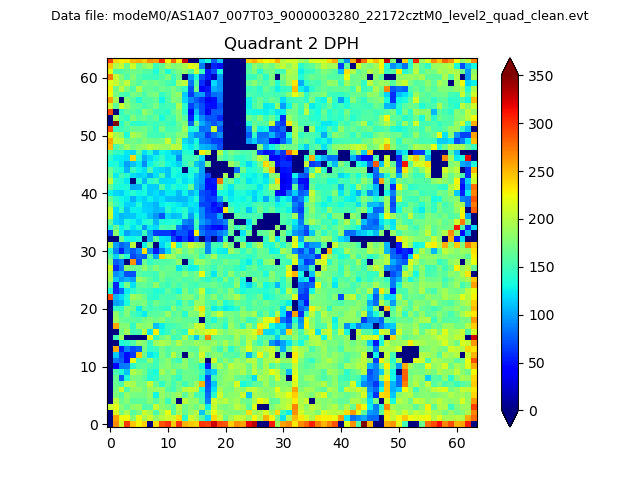
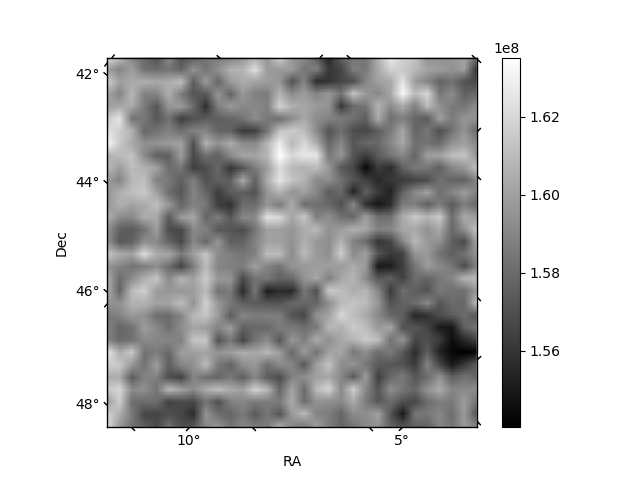
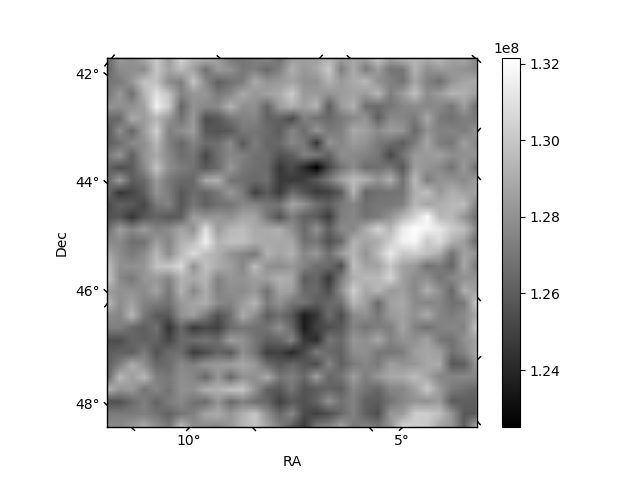
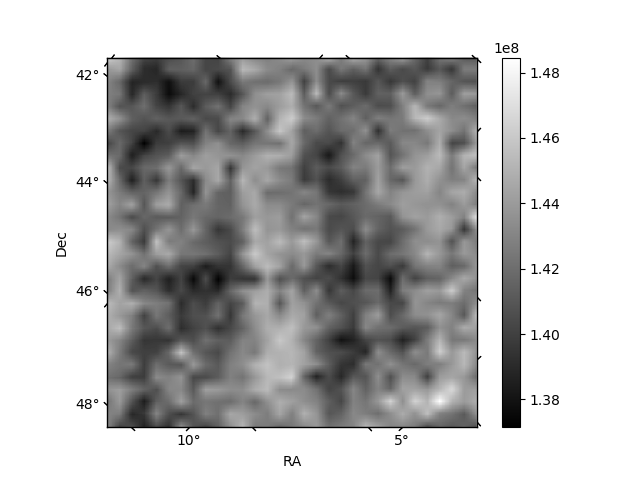
Histogram calculated using DETX and DETY for each event in the final _common_clean file
| Quadrant A | 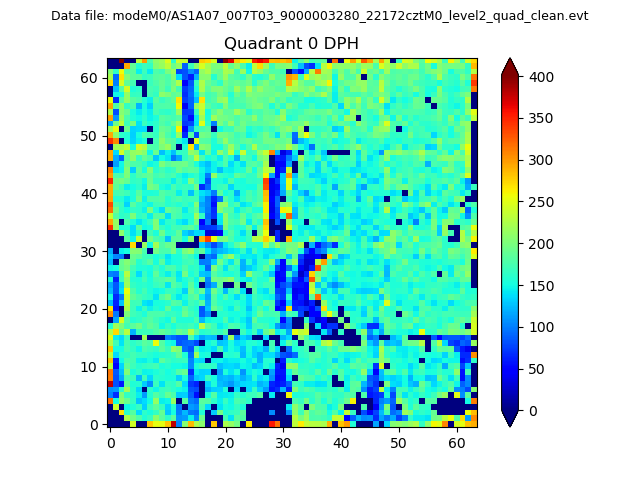 |
 |
Quadrant B |
|---|---|---|---|
| Quadrant D |  |
 |
Quadrant C |
| Plot type | Count rate plots | Images |
|---|---|---|
| Comparison with Poisson distribution Blue bars denote a histogram of data divided into 1 sec bins. Red curve is a Poisson curve with rate = median count rate of data. |
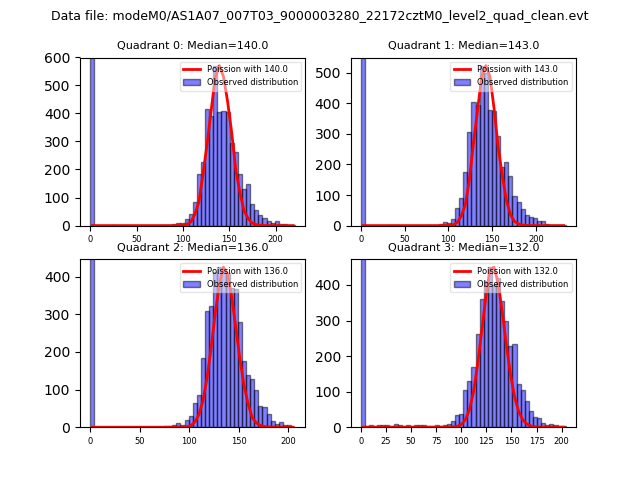 |
 |
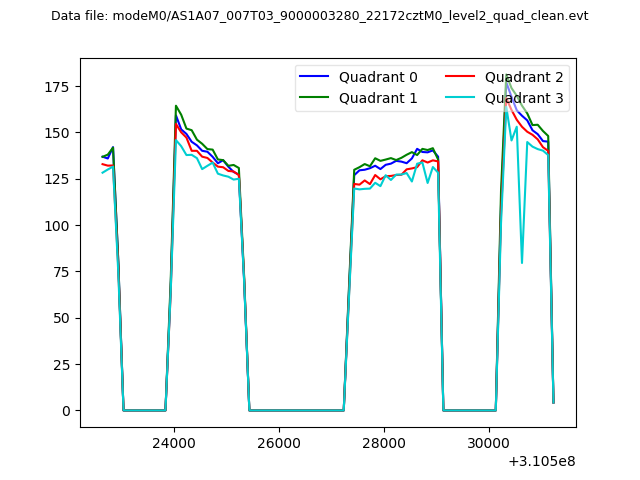
| Quadrant-wise count rates Data is divided into 100 sec bins |
 |
|
| Module-wise count rates for Quadrant A Data is divided into 100 sec bins |
 |
 |
| Module-wise count rates for Quadrant B Data is divided into 100 sec bins |
 |
 |
| Module-wise count rates for Quadrant C Data is divided into 100 sec bins |
 |
 |
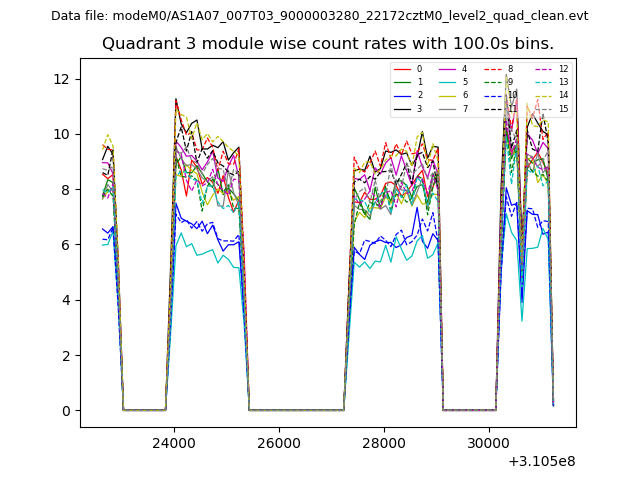
| Module-wise count rates for Quadrant D Data is divided into 100 sec bins |
 |
 |
| Parameter | Plot |
|---|---|
| CZT HV Monitor |  |
| D_VDD | 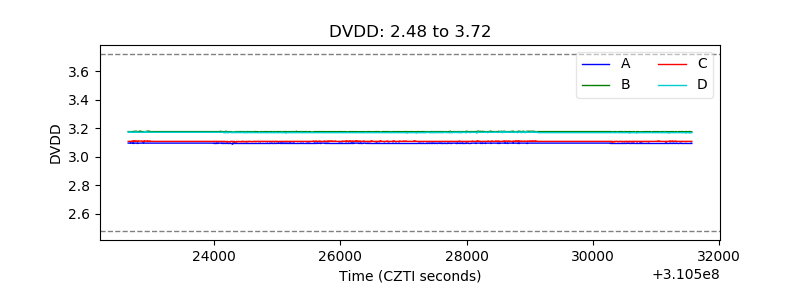 |
| Temperature 1 | 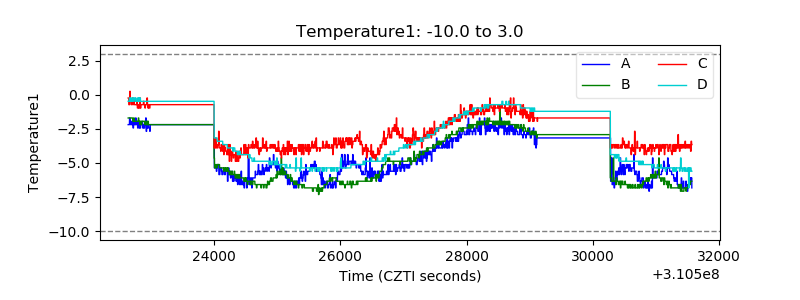 |
| Veto HV Monitor | 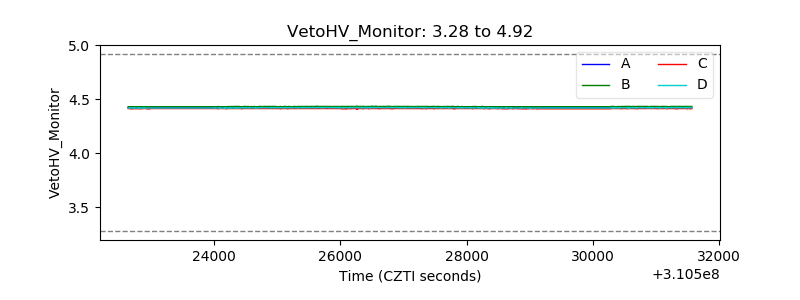 |
| Veto LLD | 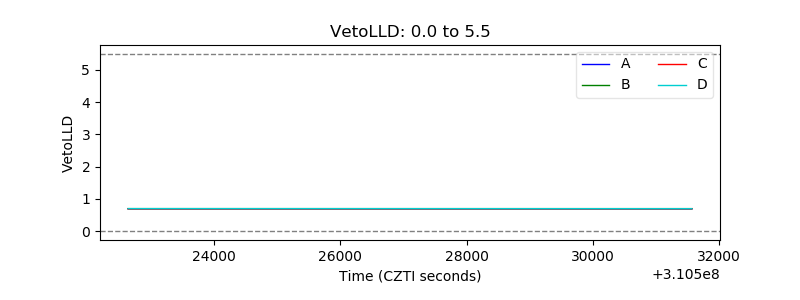 |
| Alpha Counter | 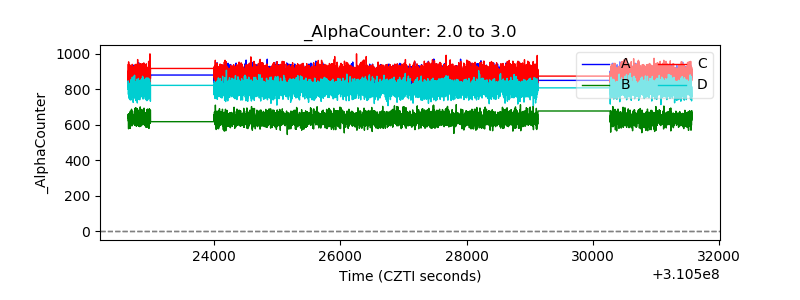 |
| _CPM_Rate | 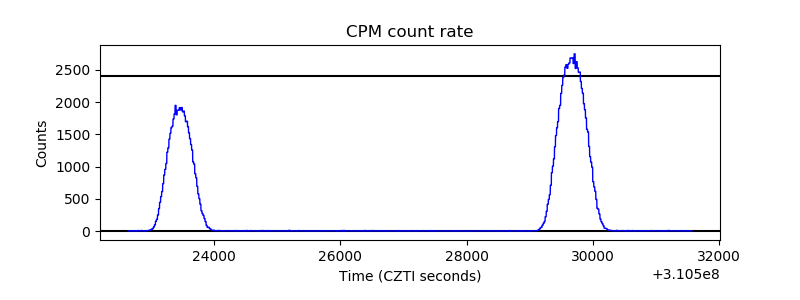 |
| CZT Counter | 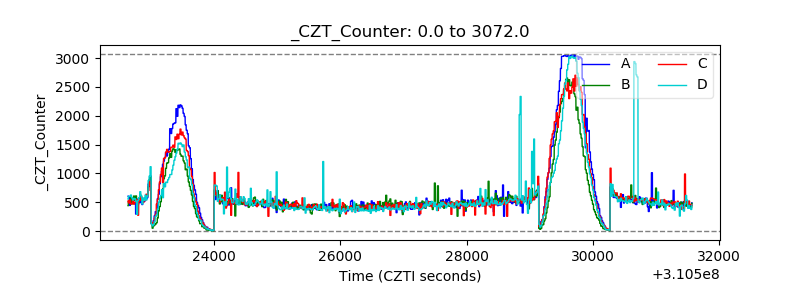 |
| +2.5 Volts monitor |  |
| +5 Volts monitor | 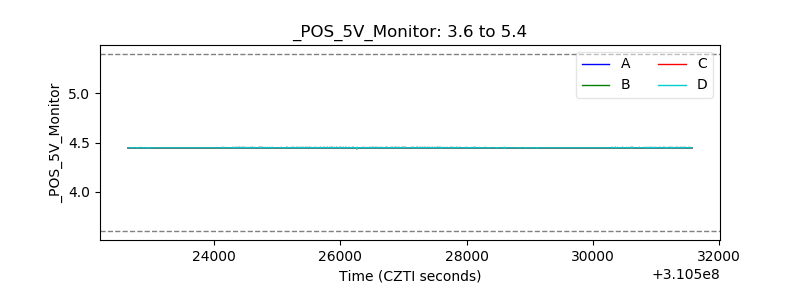 |
| _ROLL_ROT | 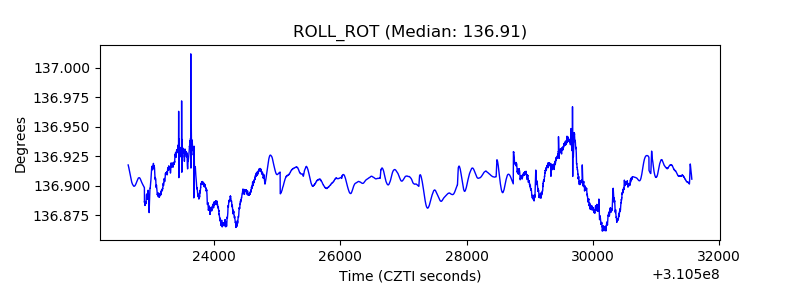 |
| _Roll_DEC | 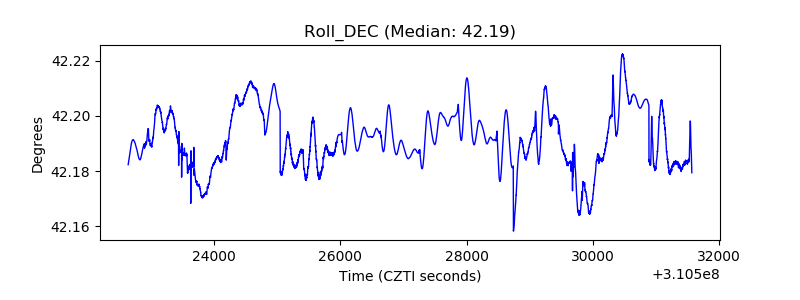 |
| _Roll_RA | 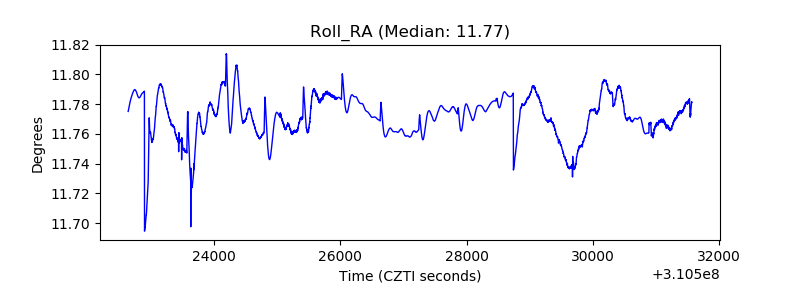 |
| Veto Counter | 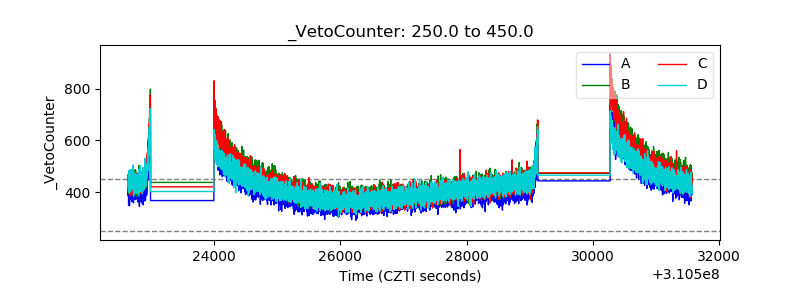 |