| Param | Original file | Final file |
|---|---|---|
| Filename | modeM0/AS1A07_007T03_9000003280_22174cztM0_level2.evt | modeM0/AS1A07_007T03_9000003280_22174cztM0_level2_quad_clean.evt |
| Size (bytes) | 465,883,200 | 76,276,800 |
| Size | 444.3 MB | 72.7 MB |
| Events in quadrant A | 3,310,820 | 479,914 |
| Events in quadrant B | 3,364,863 | 487,455 |
| Events in quadrant C | 3,309,103 | 456,890 |
| Events in quadrant D | 3,693,841 | 442,659 |
| Mode M9 | |||
|---|---|---|---|
| Quadrant | BADHDUFLAG | Total packets | Discarded packets |
| A | 0 | 18 | 0 |
| B | 0 | 19 | 0 |
| C | 0 | 19 | 0 |
| D | 0 | 19 | 0 |
| Mode SS | |||
|---|---|---|---|
| Quadrant | BADHDUFLAG | Total packets | Discarded packets |
| A | 0 | 128 | 0 |
| B | 0 | 128 | 0 |
| C | 0 | 128 | 0 |
| D | 0 | 128 | 0 |
| Mode M0 | |||
|---|---|---|---|
| Quadrant | BADHDUFLAG | Total packets | Discarded packets |
| A | 0 | 13541 | 2 |
| B | 0 | 13722 | 2 |
| C | 0 | 13529 | 3 |
| D | 0 | 15052 | 2 |
| Quadrant | Total seconds | Saturated seconds | Saturation percentage |
|---|---|---|---|
| A | 6346 | 45 | 0.709108% |
| B | 6346 | 68 | 1.071541% |
| C | 6345 | 74 | 1.166273% |
| D | 6345 | 66 | 1.040189% |
Noise dominated data is calculated using 1-second bins in cleaned event files. If a bin has >2000 counts, and if more than 50% of those come from <1% of pixels, then it is considered to be noise-dominated and hence unusable.
| Quadrant | # 1 sec bins | Bins with >0 counts | Bins with >2000 counts | High rate bins dominated by noise | Noise dominated (total time) | Noise dominated (detector-on time) | Marked lightcurve |
|---|---|---|---|---|---|---|---|
| A | 7636 | 6347 | 0 | 0 | 0.00% | 0.00% | 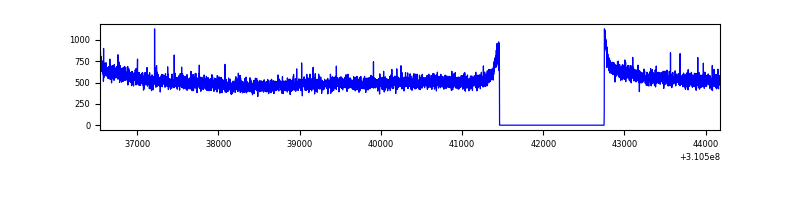 |
| B | 7636 | 6347 | 0 | 0 | 0.00% | 0.00% | 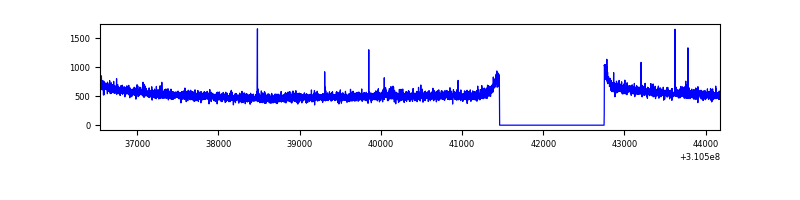 |
| C | 7635 | 6346 | 0 | 0 | 0.00% | 0.00% | 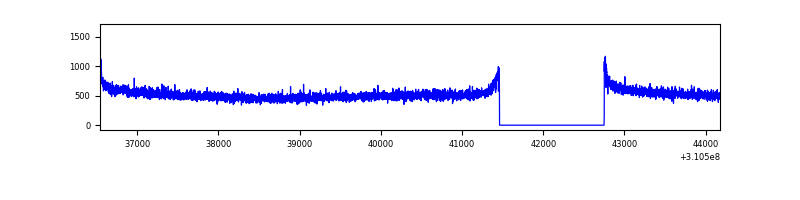 |
| D | 7635 | 6346 | 42 | 42 | 0.55% | 0.66% | 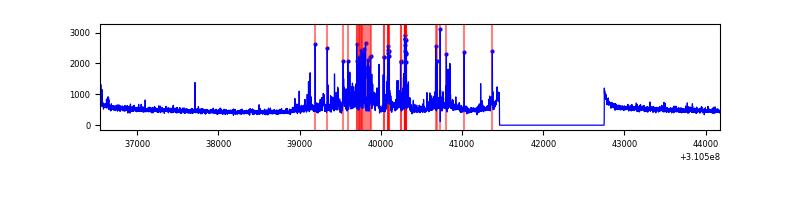 |
Top three noisy pixels from each quadrant. If the there are fewer than three noisy pixels in the level2.evt file, extra rows are filled as -1
| Pixel properties | Quadrant properties | ||||||
|---|---|---|---|---|---|---|---|
| Quadrant | DetID | PixID | Counts | Sigma | Mean | Median | Sigma |
| A | 13 | 254 | 11113 | 60.59 | 859 | 844 | 169.5 |
| A | 0 | 226 | 7439 | 38.91 | 859 | 844 | 169.5 |
| A | 3 | 137 | 6707 | 34.59 | 859 | 844 | 169.5 |
| B | 12 | 111 | 18918 | 114.45 | 855 | 837 | 158.0 |
| B | 11 | 111 | 16677 | 100.26 | 855 | 837 | 158.0 |
| B | 14 | 111 | 14949 | 89.32 | 855 | 837 | 158.0 |
| C | 14 | 238 | 130976 | 698.91 | 812 | 822 | 186.2 |
| C | 0 | 10 | 10161 | 50.15 | 812 | 822 | 186.2 |
| C | 13 | 61 | 5756 | 26.49 | 812 | 822 | 186.2 |
| D | 1 | 52 | 522607 | 2640.28 | 819 | 795 | 197.6 |
| D | 13 | 172 | 31254 | 154.12 | 819 | 795 | 197.6 |
| D | 2 | 136 | 29514 | 145.31 | 819 | 795 | 197.6 |
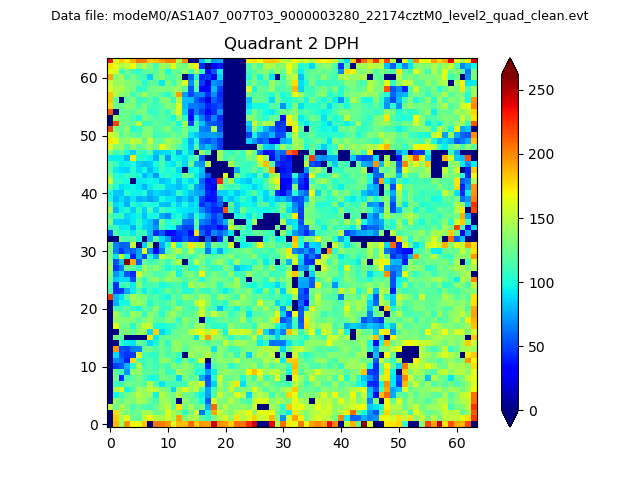
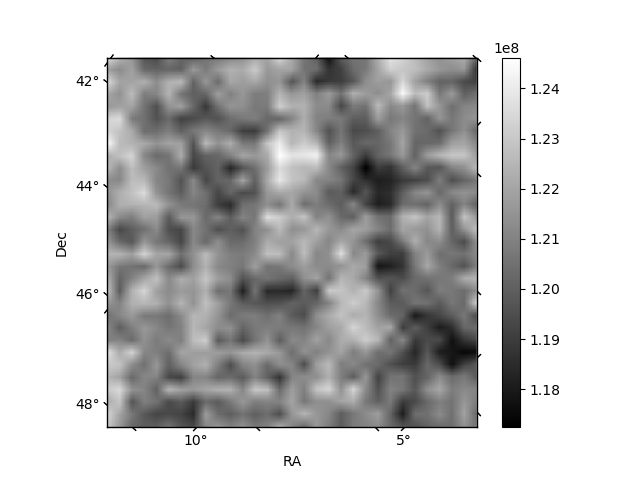
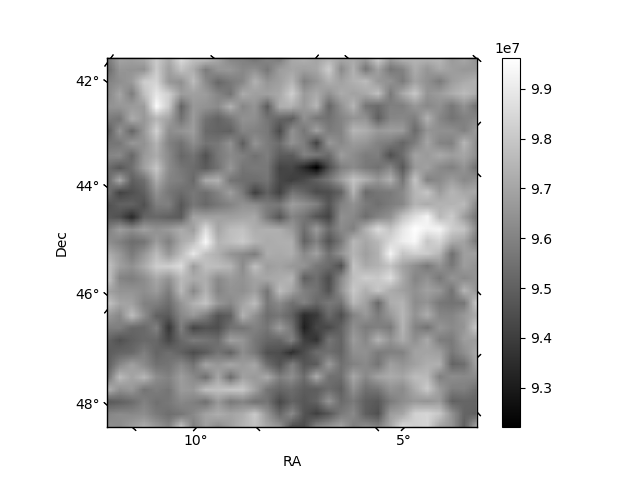
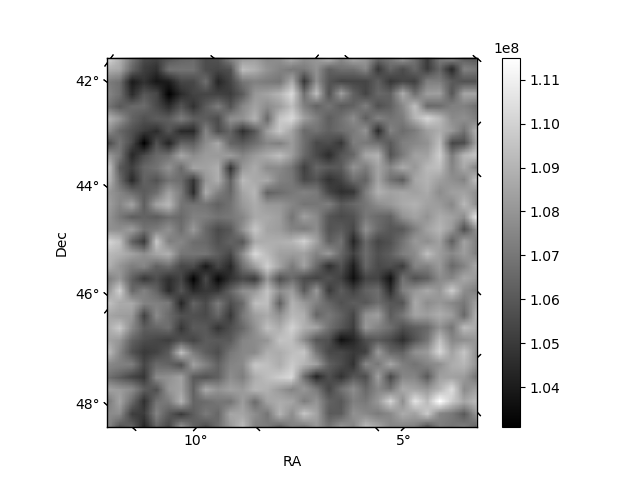
Histogram calculated using DETX and DETY for each event in the final _common_clean file
| Quadrant A |  |
 |
Quadrant B |
|---|---|---|---|
| Quadrant D | 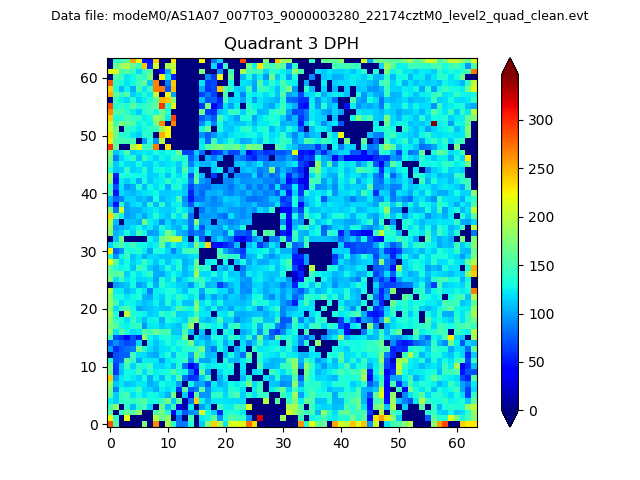 |
 |
Quadrant C |
| Plot type | Count rate plots | Images |
|---|---|---|
| Comparison with Poisson distribution Blue bars denote a histogram of data divided into 1 sec bins. Red curve is a Poisson curve with rate = median count rate of data. |
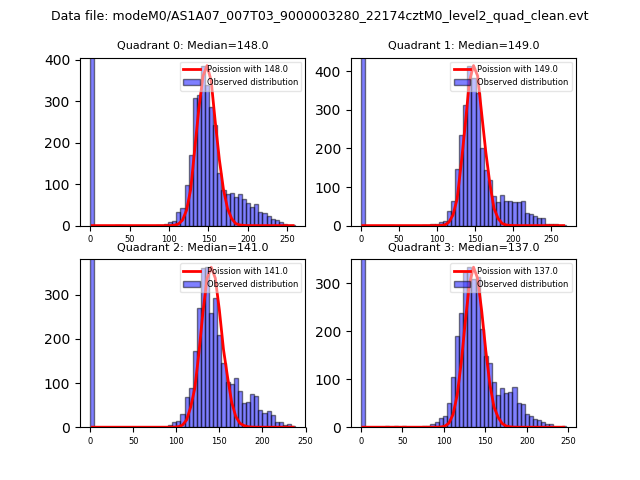 |
 |
| Quadrant-wise count rates Data is divided into 100 sec bins |
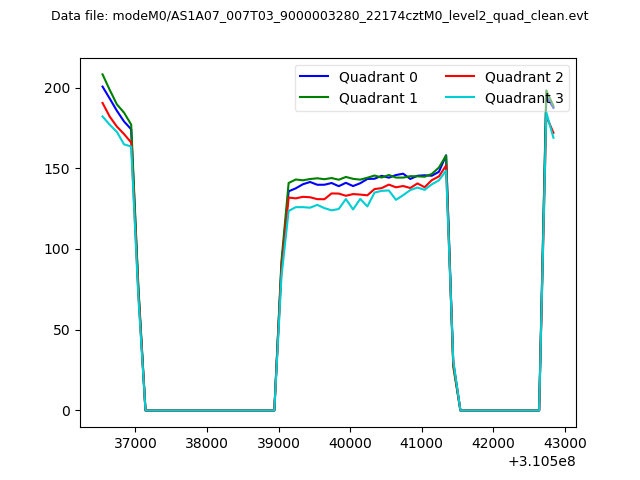 |
|
| Module-wise count rates for Quadrant A Data is divided into 100 sec bins |
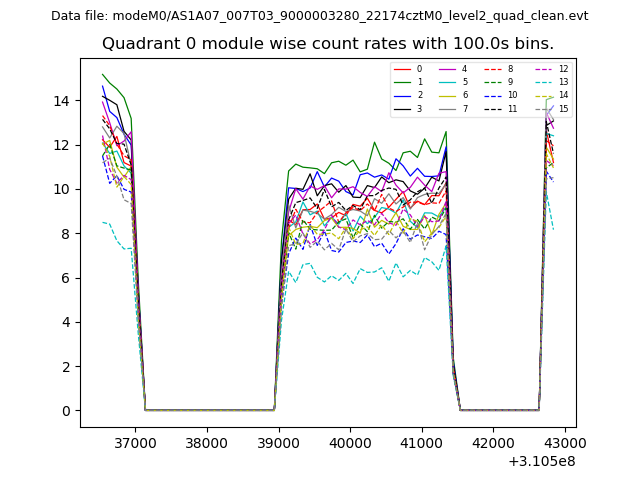 |
 |
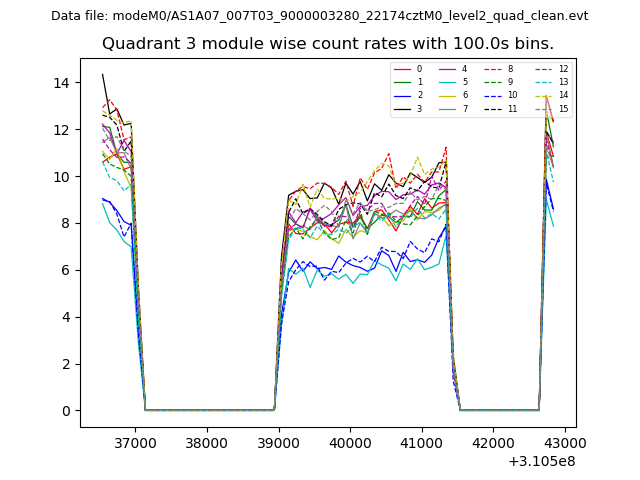
| Module-wise count rates for Quadrant B Data is divided into 100 sec bins |
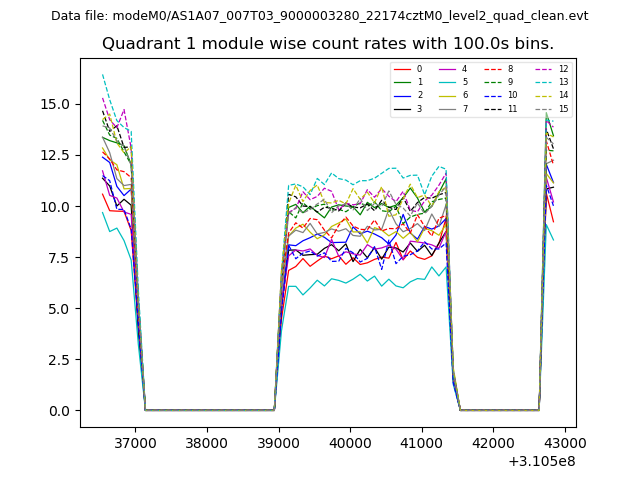 |
 |
| Module-wise count rates for Quadrant C Data is divided into 100 sec bins |
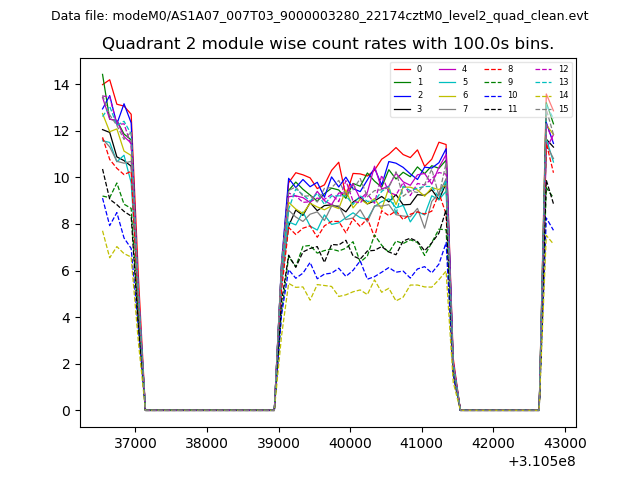 |
 |
| Module-wise count rates for Quadrant D Data is divided into 100 sec bins |
 |
 |
| Parameter | Plot |
|---|---|
| CZT HV Monitor | 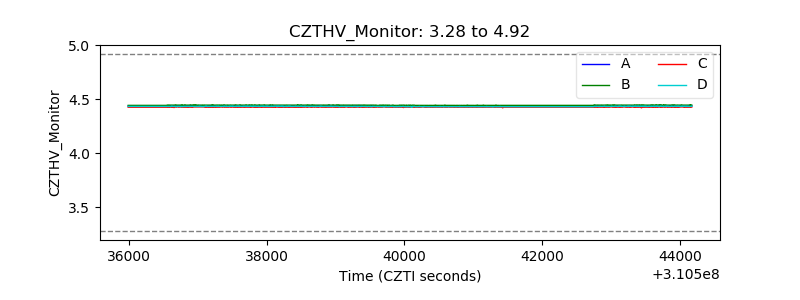 |
| D_VDD | 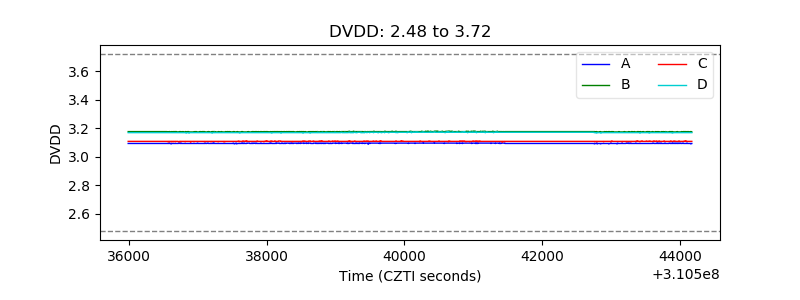 |
| Temperature 1 | 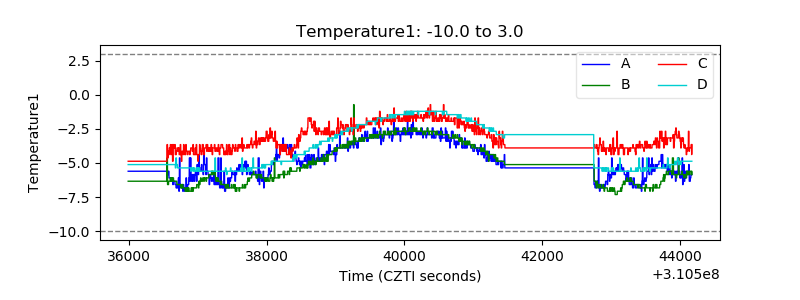 |
| Veto HV Monitor | 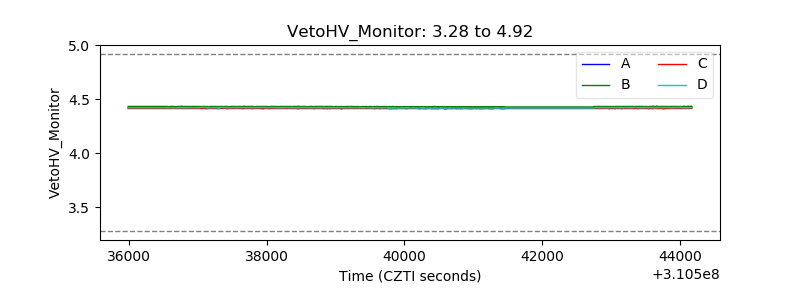 |
| Veto LLD | 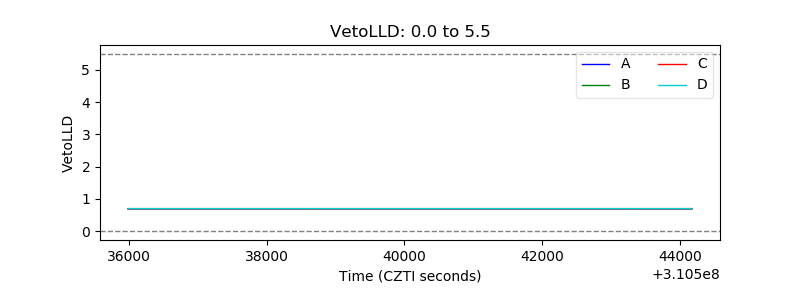 |
| Alpha Counter | 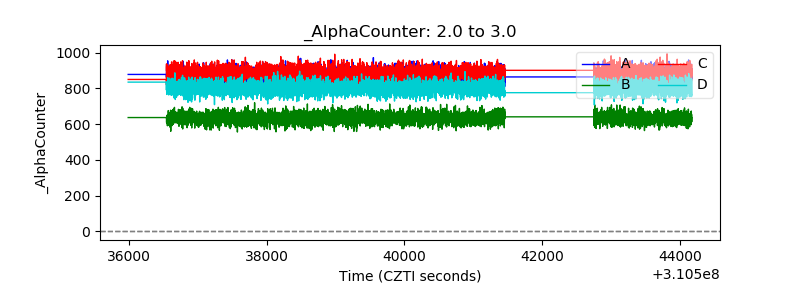 |
| _CPM_Rate | 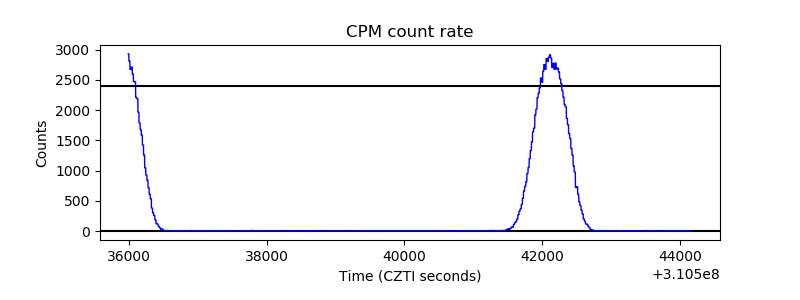 |
| CZT Counter | 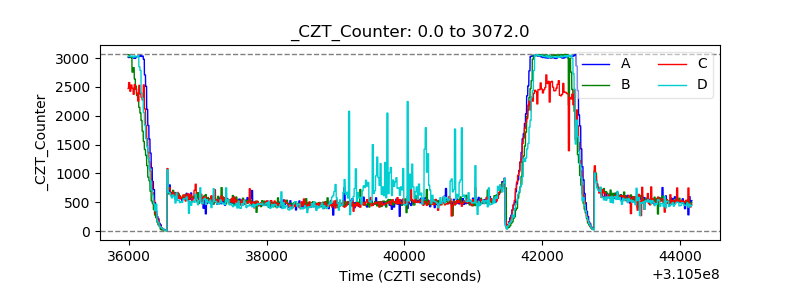 |
| +2.5 Volts monitor |  |
| +5 Volts monitor |  |
| _ROLL_ROT | 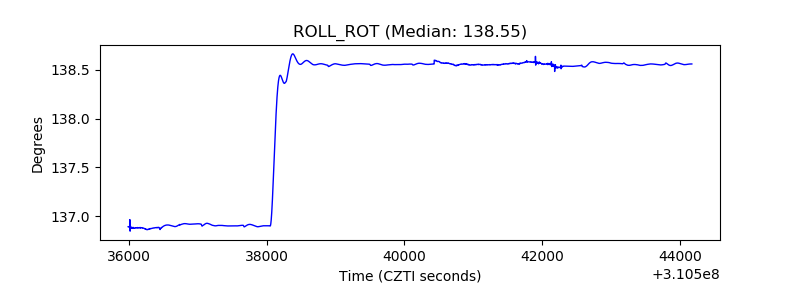 |
| _Roll_DEC | 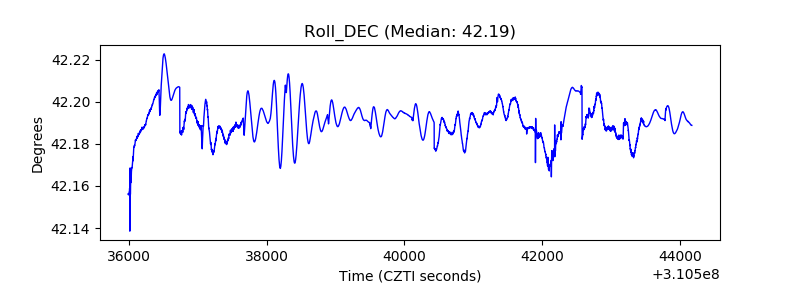 |
| _Roll_RA | 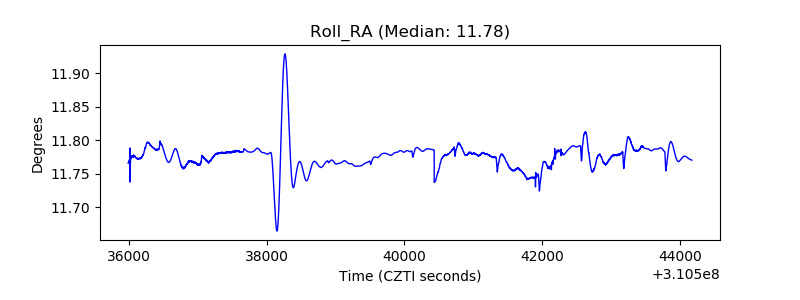 |
| Veto Counter | 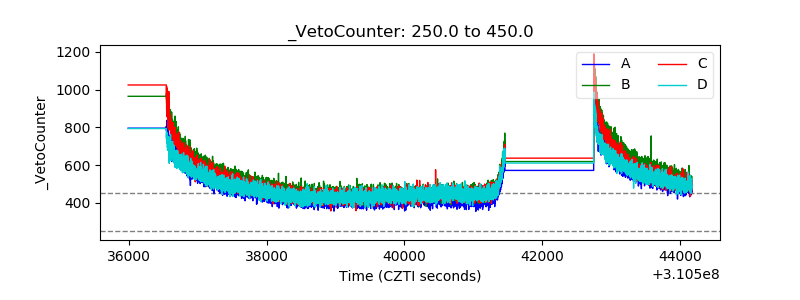 |