| Param | Original file | Final file |
|---|---|---|
| Filename | modeM0/AS1A07_007T03_9000003280_22175cztM0_level2.evt | modeM0/AS1A07_007T03_9000003280_22175cztM0_level2_quad_clean.evt |
| Size (bytes) | 458,930,880 | 71,170,560 |
| Size | 437.7 MB | 67.9 MB |
| Events in quadrant A | 3,415,029 | 440,568 |
| Events in quadrant B | 3,414,433 | 445,862 |
| Events in quadrant C | 3,350,475 | 417,210 |
| Events in quadrant D | 3,289,623 | 410,185 |
| Mode M9 | |||
|---|---|---|---|
| Quadrant | BADHDUFLAG | Total packets | Discarded packets |
| A | 0 | 16 | 0 |
| B | 0 | 17 | 0 |
| C | 0 | 17 | 0 |
| D | 0 | 17 | 0 |
| Mode SS | |||
|---|---|---|---|
| Quadrant | BADHDUFLAG | Total packets | Discarded packets |
| A | 0 | 128 | 0 |
| B | 0 | 128 | 0 |
| C | 0 | 128 | 0 |
| D | 0 | 128 | 0 |
| Mode M0 | |||
|---|---|---|---|
| Quadrant | BADHDUFLAG | Total packets | Discarded packets |
| A | 0 | 13752 | 2 |
| B | 0 | 13815 | 2 |
| C | 0 | 13597 | 2 |
| D | 0 | 13570 | 2 |
| Quadrant | Total seconds | Saturated seconds | Saturation percentage |
|---|---|---|---|
| A | 6322 | 63 | 0.996520% |
| B | 6322 | 88 | 1.391965% |
| C | 6322 | 89 | 1.407782% |
| D | 6321 | 52 | 0.822655% |
Noise dominated data is calculated using 1-second bins in cleaned event files. If a bin has >2000 counts, and if more than 50% of those come from <1% of pixels, then it is considered to be noise-dominated and hence unusable.
| Quadrant | # 1 sec bins | Bins with >0 counts | Bins with >2000 counts | High rate bins dominated by noise | Noise dominated (total time) | Noise dominated (detector-on time) | Marked lightcurve |
|---|---|---|---|---|---|---|---|
| A | 7672 | 6323 | 5 | 5 | 0.07% | 0.08% | 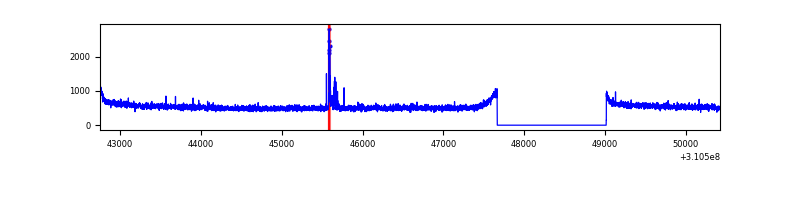 |
| B | 7672 | 6323 | 0 | 0 | 0.00% | 0.00% | 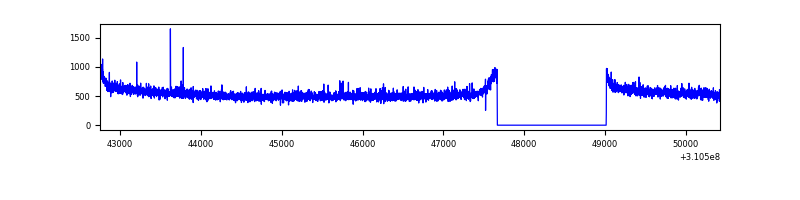 |
| C | 7672 | 6323 | 0 | 0 | 0.00% | 0.00% | 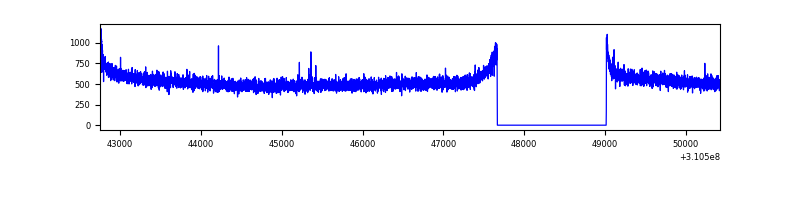 |
| D | 7671 | 6322 | 24 | 24 | 0.31% | 0.38% | 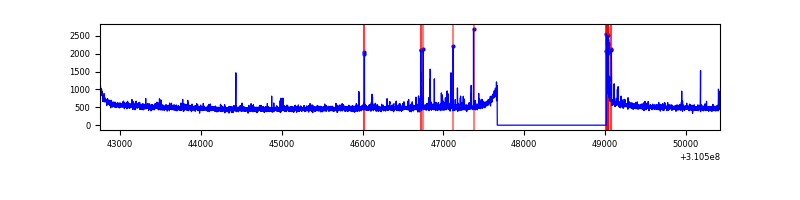 |
Top three noisy pixels from each quadrant. If the there are fewer than three noisy pixels in the level2.evt file, extra rows are filled as -1
| Pixel properties | Quadrant properties | ||||||
|---|---|---|---|---|---|---|---|
| Quadrant | DetID | PixID | Counts | Sigma | Mean | Median | Sigma |
| A | 15 | 174 | 47207 | 269.84 | 874 | 859 | 171.8 |
| A | 13 | 254 | 11110 | 59.68 | 874 | 859 | 171.8 |
| A | 0 | 226 | 7503 | 38.68 | 874 | 859 | 171.8 |
| B | 12 | 111 | 18770 | 111.68 | 869 | 850 | 160.5 |
| B | 11 | 111 | 16744 | 99.05 | 869 | 850 | 160.5 |
| B | 14 | 111 | 15361 | 90.43 | 869 | 850 | 160.5 |
| C | 14 | 238 | 133715 | 704.45 | 821 | 830 | 188.6 |
| C | 0 | 10 | 7847 | 37.2 | 821 | 830 | 188.6 |
| C | 13 | 61 | 5773 | 26.2 | 821 | 830 | 188.6 |
| D | 13 | 172 | 40792 | 201.99 | 832 | 812 | 197.9 |
| D | 7 | 236 | 28316 | 138.96 | 832 | 812 | 197.9 |
| D | 7 | 221 | 26915 | 131.88 | 832 | 812 | 197.9 |
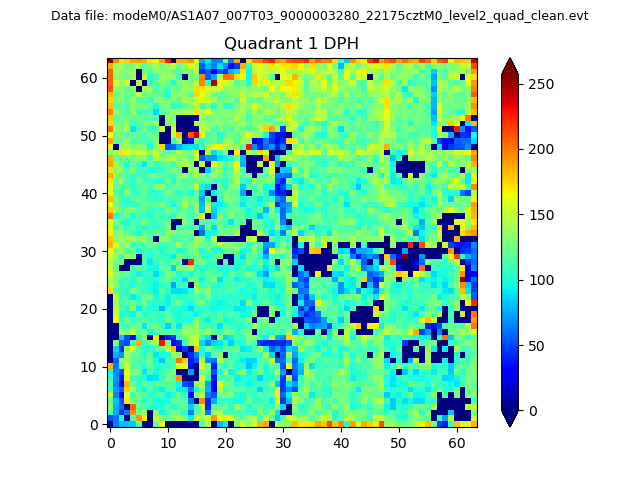
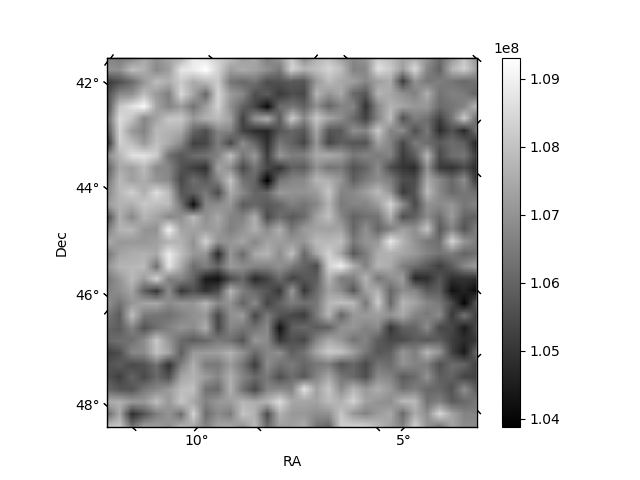
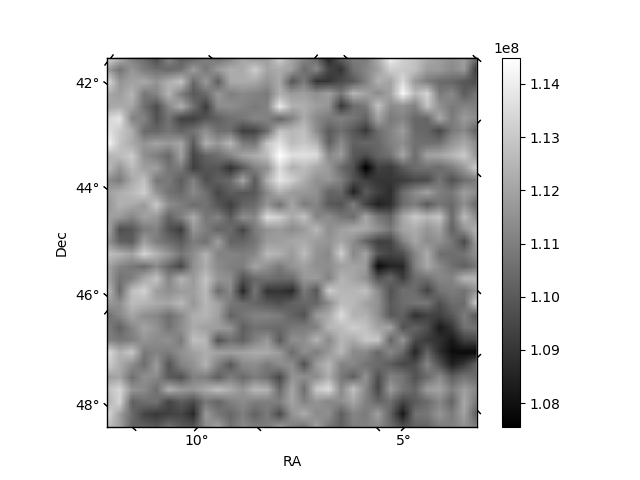
Histogram calculated using DETX and DETY for each event in the final _common_clean file
| Quadrant A |  |
 |
Quadrant B |
|---|---|---|---|
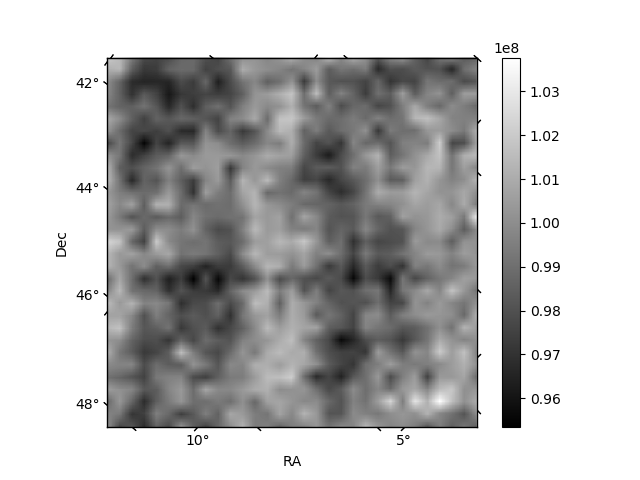
| Quadrant D | 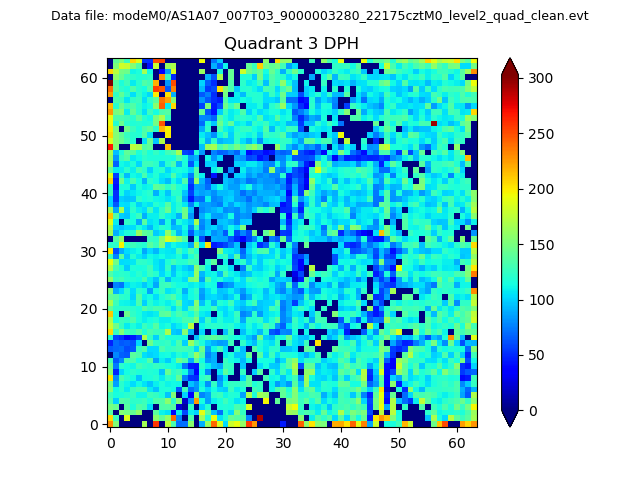 |
 |
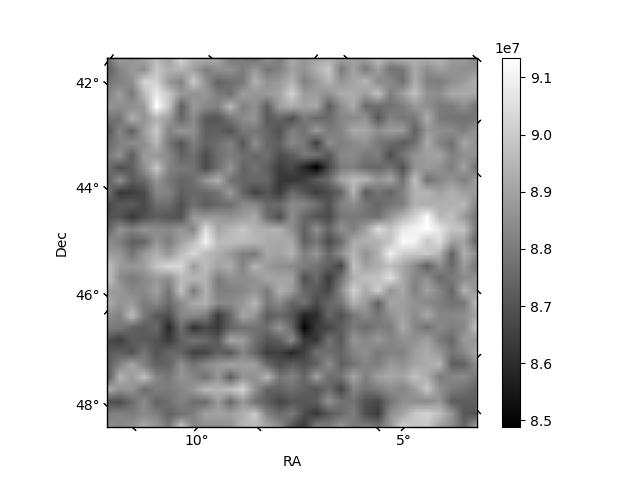
Quadrant C |
| Plot type | Count rate plots | Images |
|---|---|---|
| Comparison with Poisson distribution Blue bars denote a histogram of data divided into 1 sec bins. Red curve is a Poisson curve with rate = median count rate of data. |
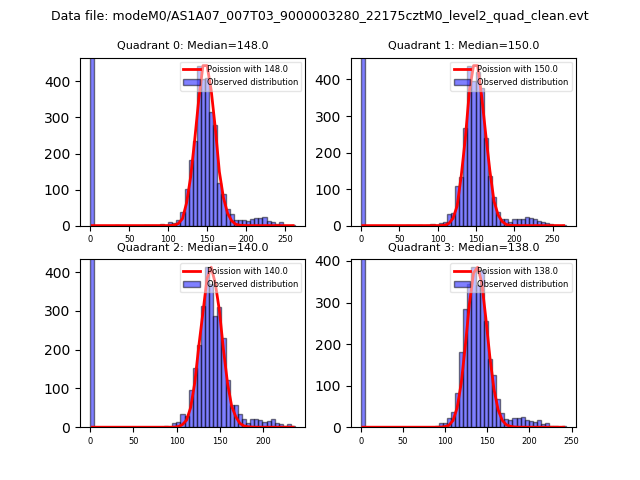 |
 |
| Quadrant-wise count rates Data is divided into 100 sec bins |
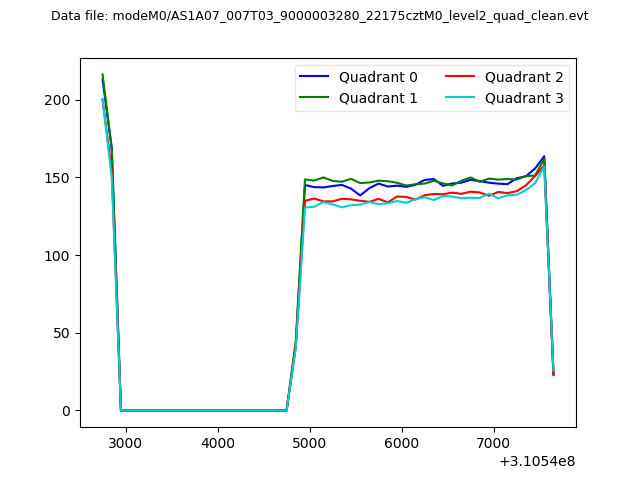 |
|
| Module-wise count rates for Quadrant A Data is divided into 100 sec bins |
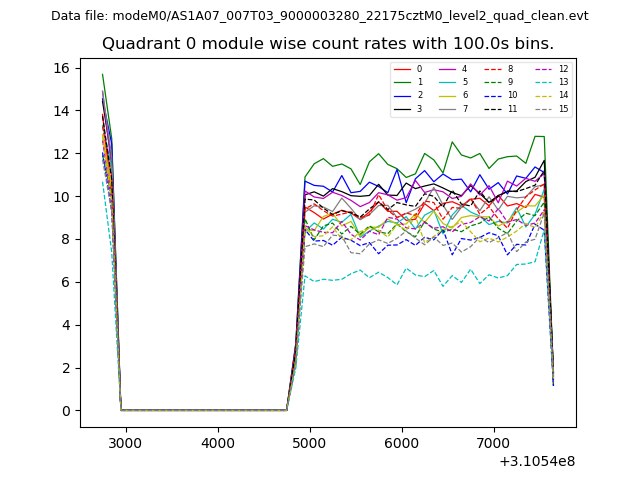 |
 |
| Module-wise count rates for Quadrant B Data is divided into 100 sec bins |
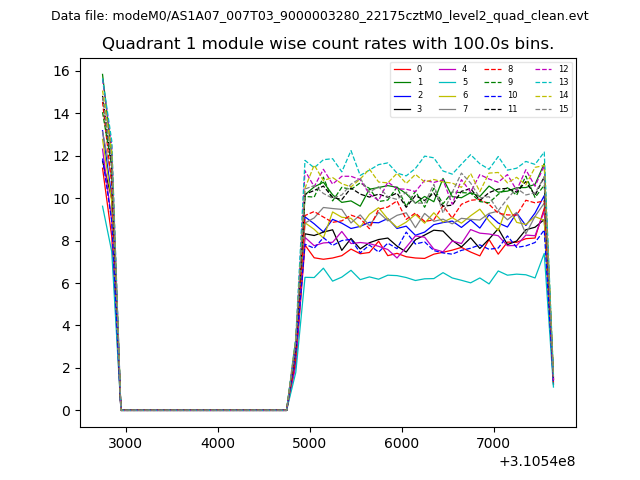 |
 |
| Module-wise count rates for Quadrant C Data is divided into 100 sec bins |
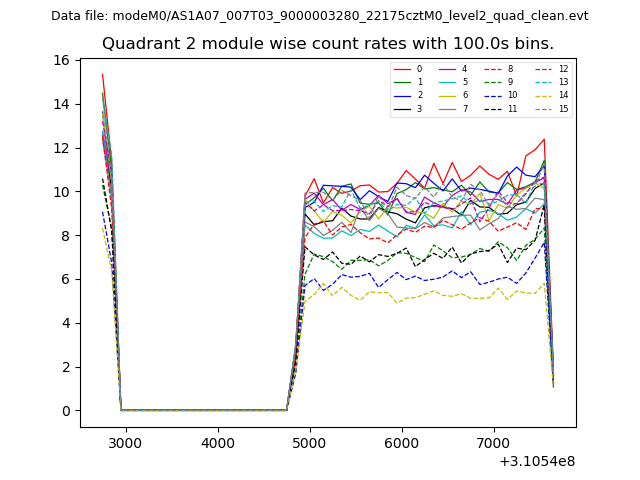 |
 |
| Module-wise count rates for Quadrant D Data is divided into 100 sec bins |
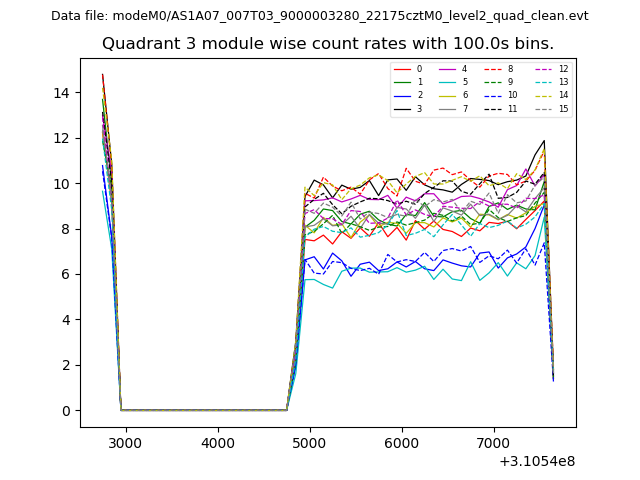 |
 |
| Parameter | Plot |
|---|---|
| CZT HV Monitor | 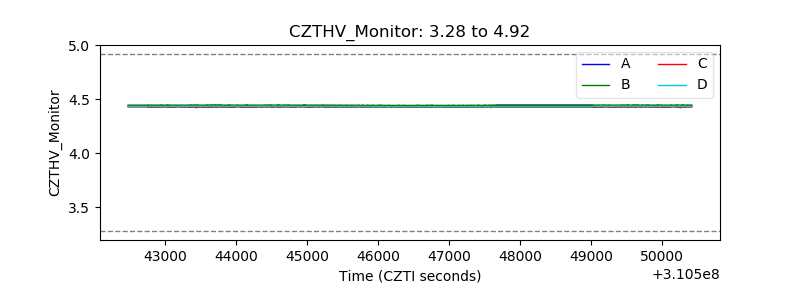 |
| D_VDD | 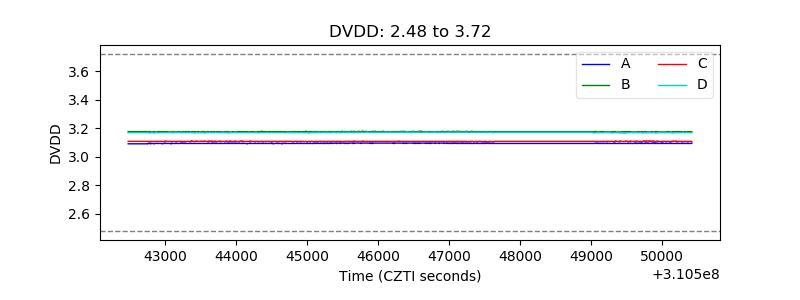 |
| Temperature 1 |  |
| Veto HV Monitor | 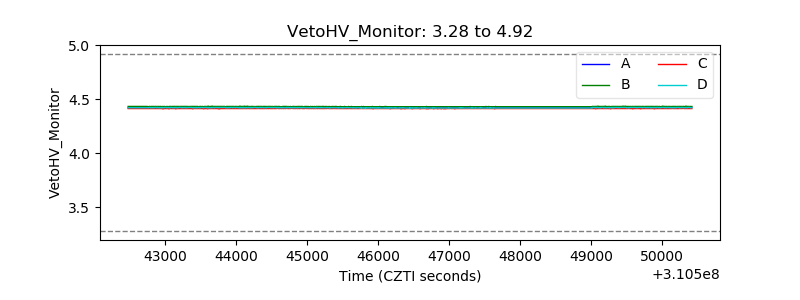 |
| Veto LLD |  |
| Alpha Counter | 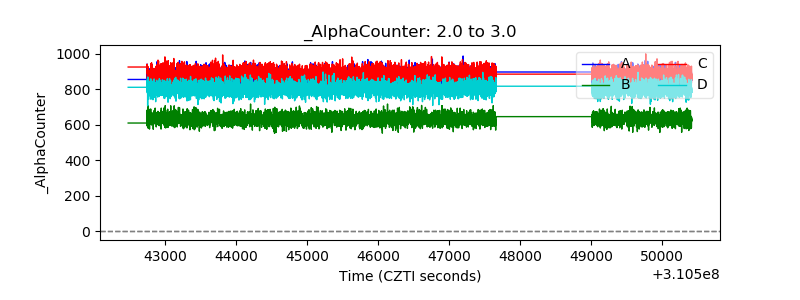 |
| _CPM_Rate | 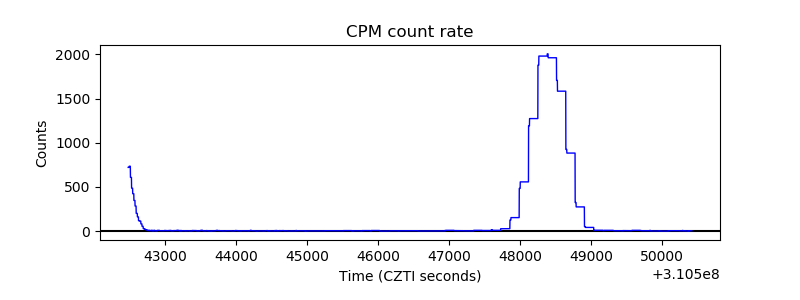 |
| CZT Counter | 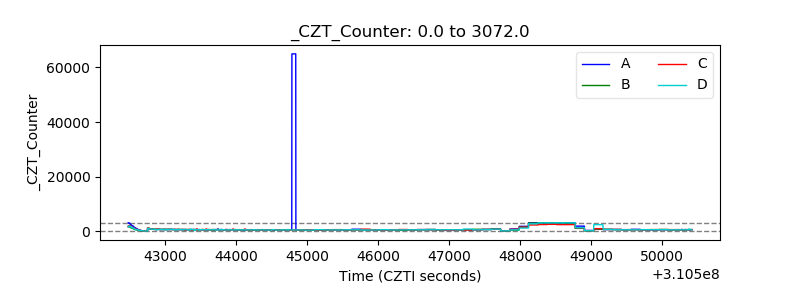 |
| +2.5 Volts monitor |  |
| +5 Volts monitor |  |
| _ROLL_ROT | 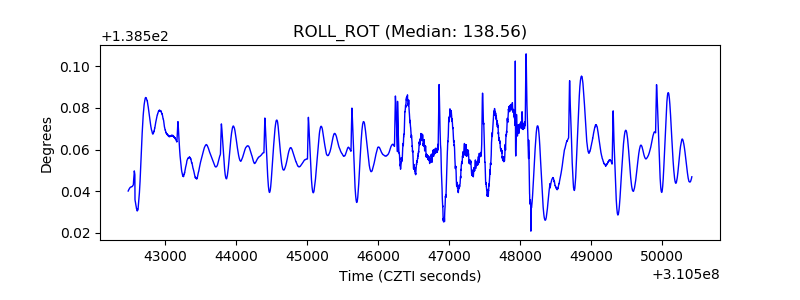 |
| _Roll_DEC | 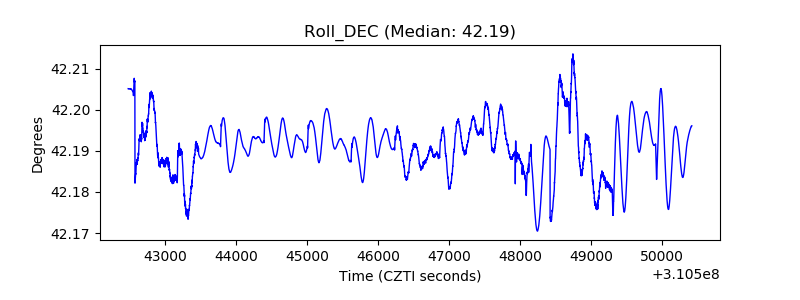 |
| _Roll_RA |  |
| Veto Counter | 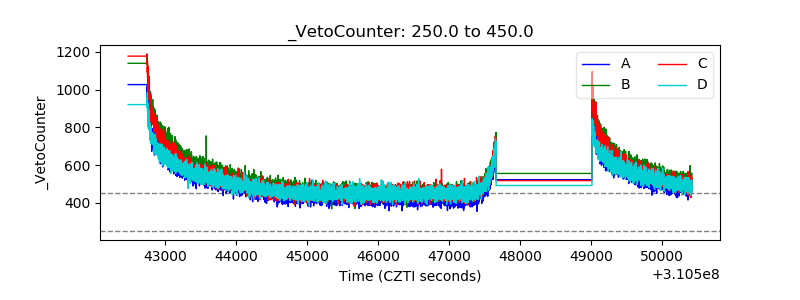 |