| Param | Original file | Final file |
|---|---|---|
| Filename | modeM0/AS1A07_007T03_9000003280_22178cztM0_level2.evt | modeM0/AS1A07_007T03_9000003280_22178cztM0_level2_quad_clean.evt |
| Size (bytes) | 230,051,520 | 47,465,280 |
| Size | 219.4 MB | 45.3 MB |
| Events in quadrant A | 1,573,991 | 309,597 |
| Events in quadrant B | 1,649,400 | 313,682 |
| Events in quadrant C | 1,573,166 | 293,779 |
| Events in quadrant D | 1,944,423 | 285,493 |
| Mode M9 | |||
|---|---|---|---|
| Quadrant | BADHDUFLAG | Total packets | Discarded packets |
| A | 0 | 4 | 0 |
| B | 0 | 5 | 0 |
| C | 0 | 5 | 0 |
| D | 0 | 5 | 0 |
| Mode SS | |||
|---|---|---|---|
| Quadrant | BADHDUFLAG | Total packets | Discarded packets |
| A | 0 | 66 | 0 |
| B | 0 | 66 | 0 |
| C | 0 | 66 | 0 |
| D | 0 | 66 | 0 |
| Mode M0 | |||
|---|---|---|---|
| Quadrant | BADHDUFLAG | Total packets | Discarded packets |
| A | 0 | 6724 | 1 |
| B | 0 | 6915 | 1 |
| C | 0 | 6708 | 1 |
| D | 0 | 7939 | 1 |
| Quadrant | Total seconds | Saturated seconds | Saturation percentage |
|---|---|---|---|
| A | 3301 | 15 | 0.454408% |
| B | 3301 | 24 | 0.727052% |
| C | 3301 | 26 | 0.787640% |
| D | 3301 | 59 | 1.787337% |
Noise dominated data is calculated using 1-second bins in cleaned event files. If a bin has >2000 counts, and if more than 50% of those come from <1% of pixels, then it is considered to be noise-dominated and hence unusable.
| Quadrant | # 1 sec bins | Bins with >0 counts | Bins with >2000 counts | High rate bins dominated by noise | Noise dominated (total time) | Noise dominated (detector-on time) | Marked lightcurve |
|---|---|---|---|---|---|---|---|
| A | 3301 | 3301 | 0 | 0 | 0.00% | 0.00% | 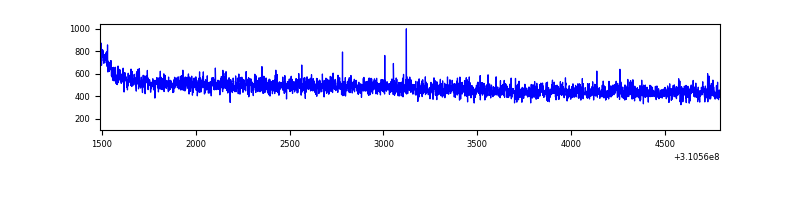 |
| B | 3301 | 3301 | 1 | 1 | 0.03% | 0.03% |  |
| C | 3301 | 3301 | 0 | 0 | 0.00% | 0.00% | 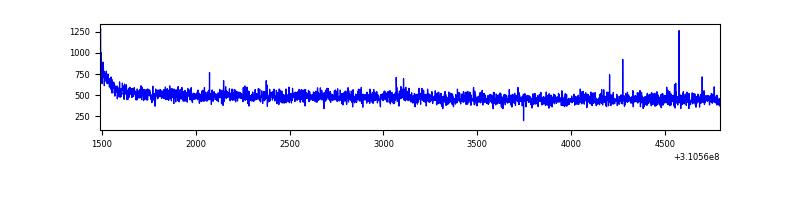 |
| D | 3301 | 3301 | 33 | 33 | 1.00% | 1.00% | 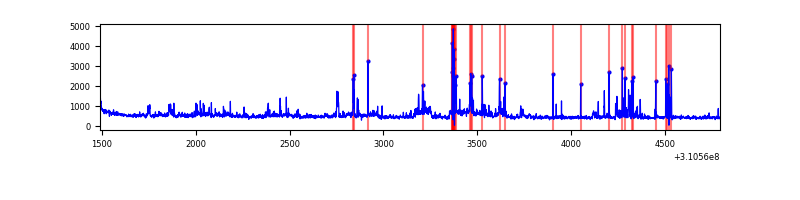 |
Top three noisy pixels from each quadrant. If the there are fewer than three noisy pixels in the level2.evt file, extra rows are filled as -1
| Pixel properties | Quadrant properties | ||||||
|---|---|---|---|---|---|---|---|
| Quadrant | DetID | PixID | Counts | Sigma | Mean | Median | Sigma |
| A | 13 | 254 | 5871 | 65.94 | 408 | 401 | 83.0 |
| A | 0 | 226 | 3461 | 36.89 | 408 | 401 | 83.0 |
| A | 3 | 137 | 3363 | 35.7 | 408 | 401 | 83.0 |
| B | 0 | 190 | 33852 | 436.57 | 401 | 392 | 76.6 |
| B | 4 | 171 | 23269 | 298.49 | 401 | 392 | 76.6 |
| B | 0 | 219 | 9483 | 118.62 | 401 | 392 | 76.6 |
| C | 14 | 238 | 61804 | 675.54 | 384 | 387 | 90.9 |
| C | 9 | 54 | 7241 | 75.39 | 384 | 387 | 90.9 |
| C | 0 | 10 | 3619 | 35.55 | 384 | 387 | 90.9 |
| D | 1 | 52 | 425980 | 4518.13 | 390 | 379 | 94.2 |
| D | 7 | 38 | 14735 | 152.4 | 390 | 379 | 94.2 |
| D | 2 | 234 | 13067 | 134.69 | 390 | 379 | 94.2 |
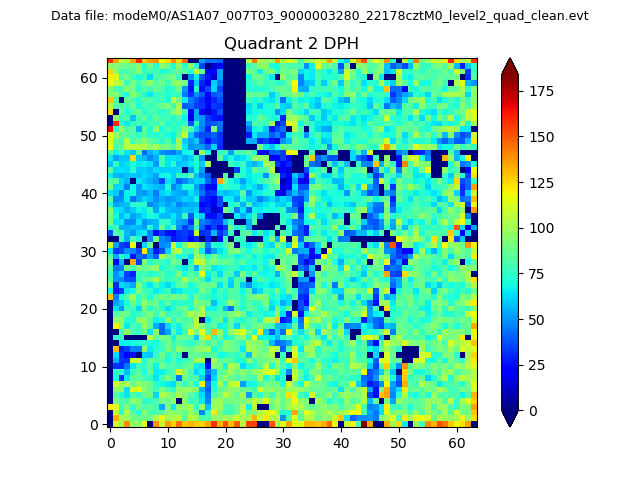
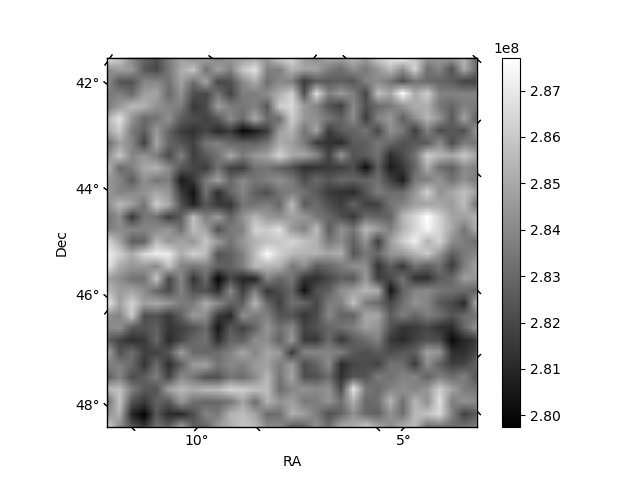
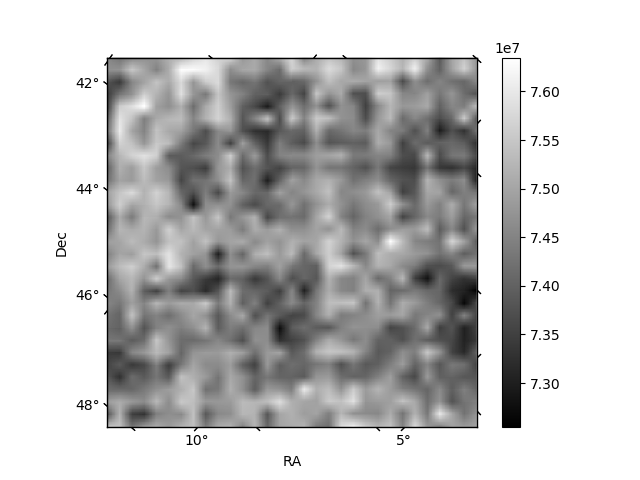
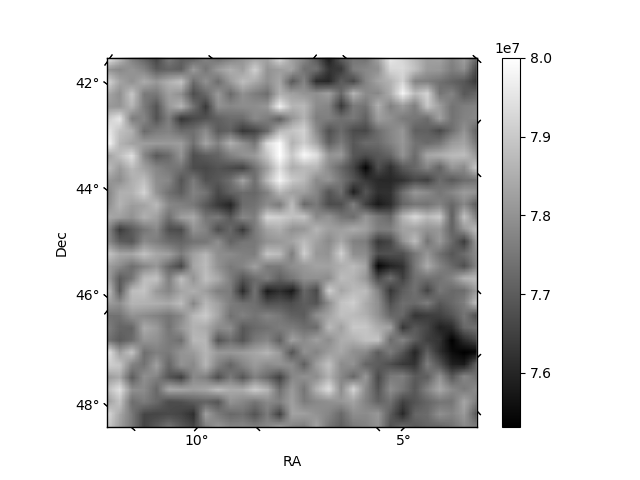
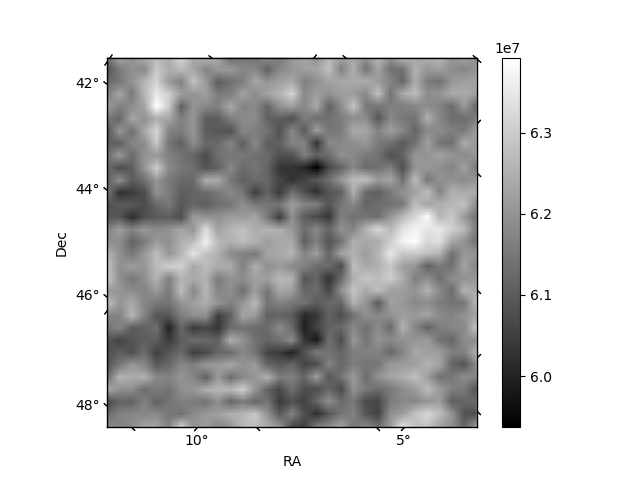
Histogram calculated using DETX and DETY for each event in the final _common_clean file
| Quadrant A |  |
 |
Quadrant B |
|---|---|---|---|
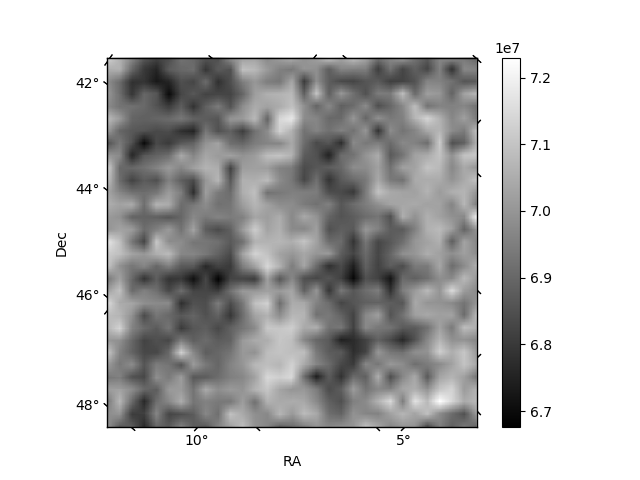
| Quadrant D |  |
 |
Quadrant C |
| Plot type | Count rate plots | Images |
|---|---|---|
| Comparison with Poisson distribution Blue bars denote a histogram of data divided into 1 sec bins. Red curve is a Poisson curve with rate = median count rate of data. |
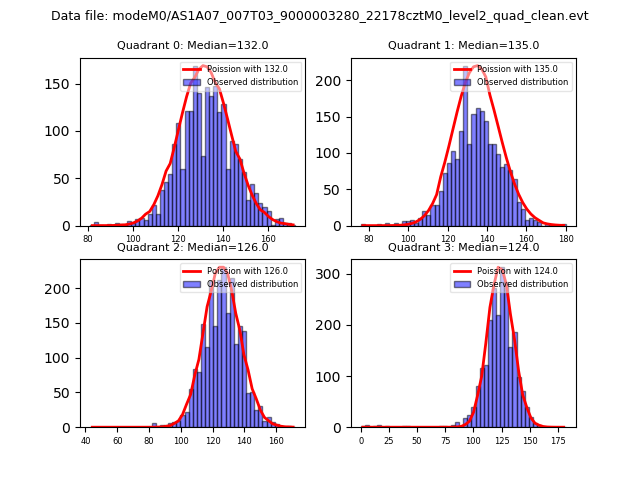 |
 |
| Quadrant-wise count rates Data is divided into 100 sec bins |
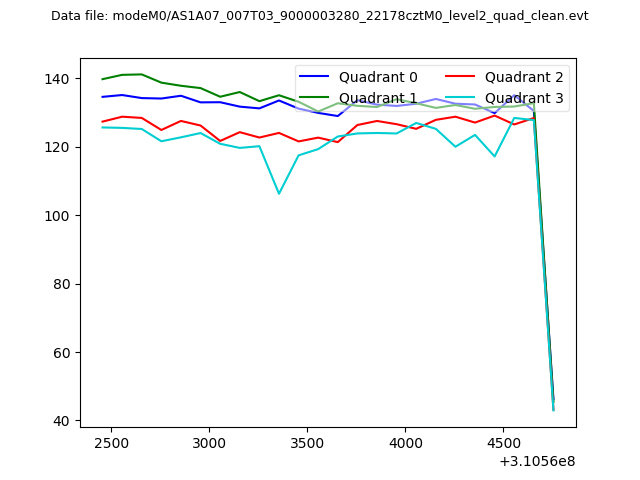 |
|
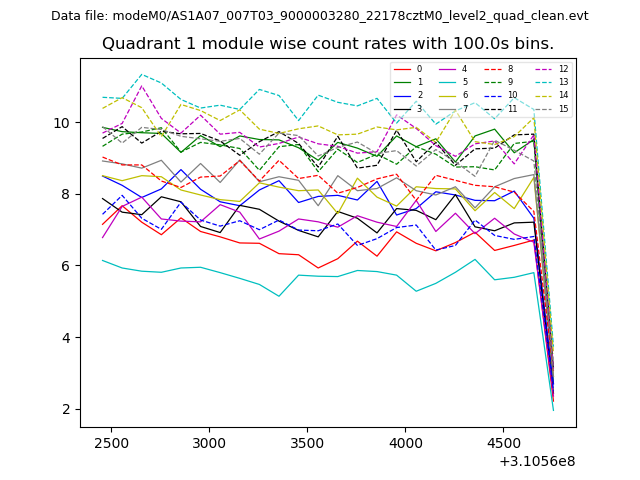
| Module-wise count rates for Quadrant A Data is divided into 100 sec bins |
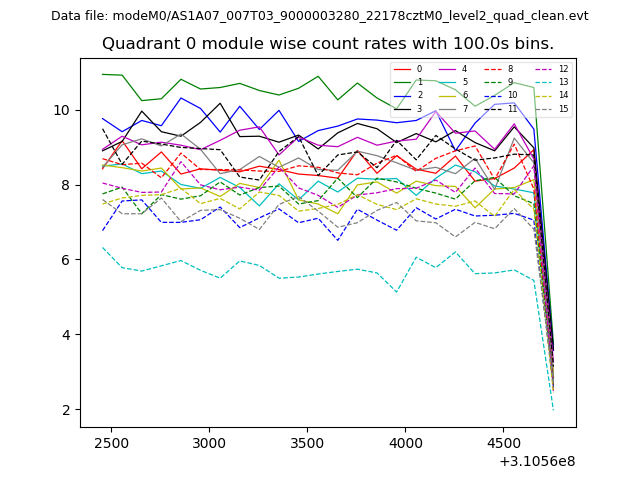 |
 |
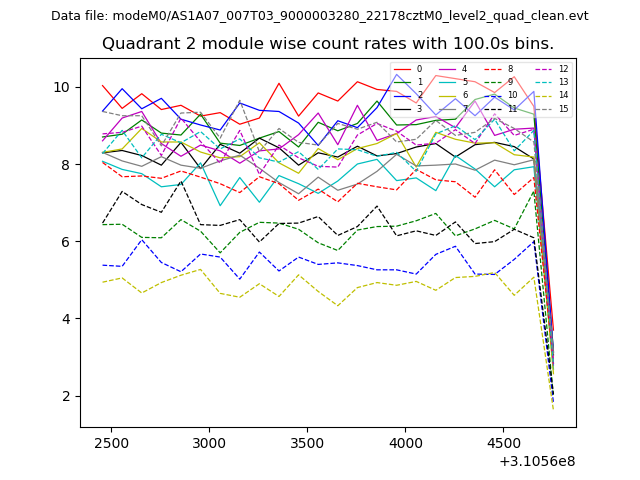
| Module-wise count rates for Quadrant B Data is divided into 100 sec bins |
 |
 |
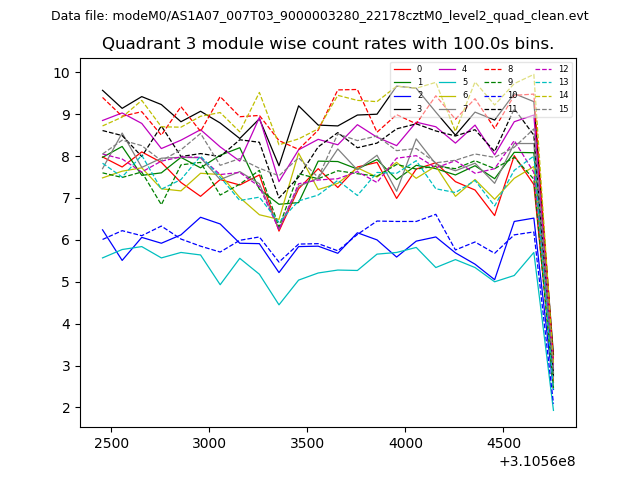
| Module-wise count rates for Quadrant C Data is divided into 100 sec bins |
 |
 |
| Module-wise count rates for Quadrant D Data is divided into 100 sec bins |
 |
 |
| Parameter | Plot |
|---|---|
| CZT HV Monitor | 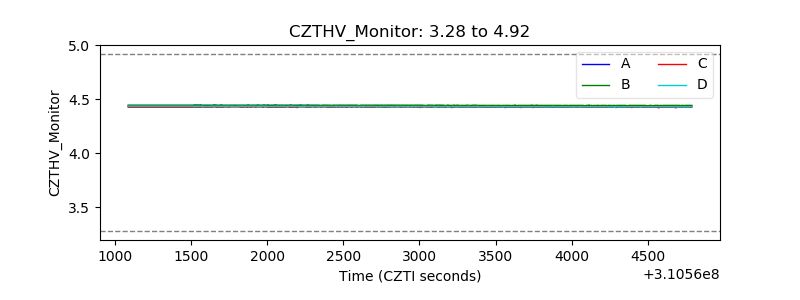 |
| D_VDD | 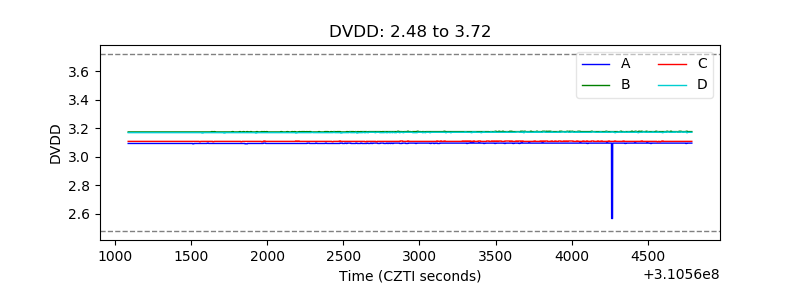 |
| Temperature 1 | 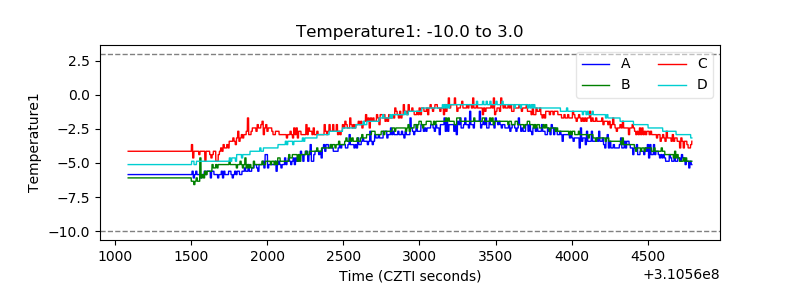 |
| Veto HV Monitor | 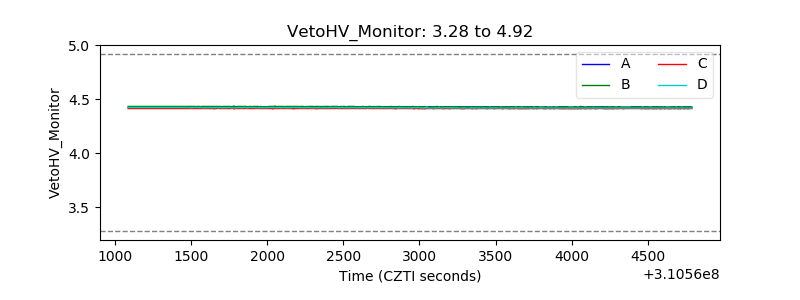 |
| Veto LLD | 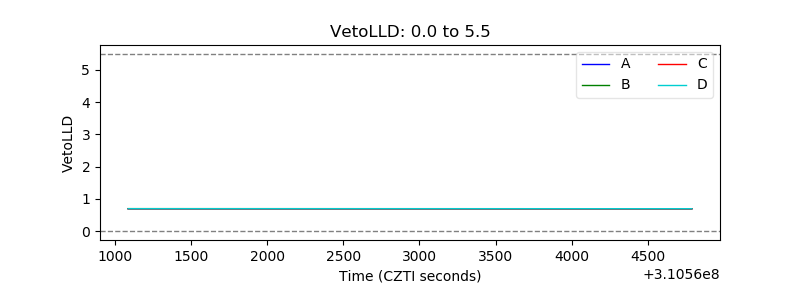 |
| Alpha Counter | 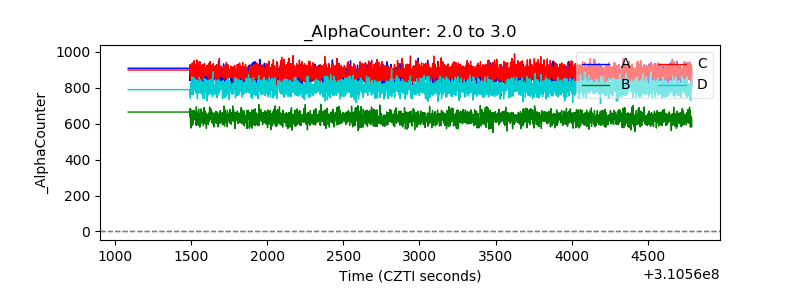 |
| _CPM_Rate | 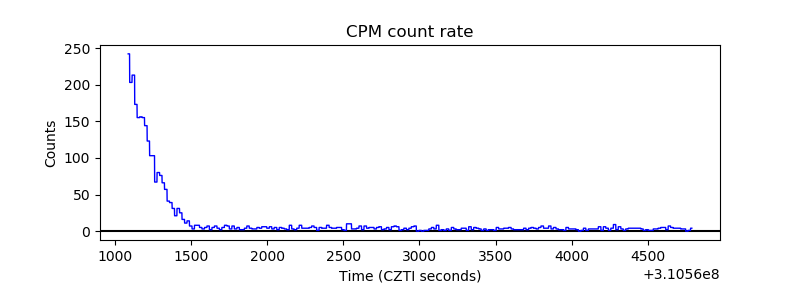 |
| CZT Counter | 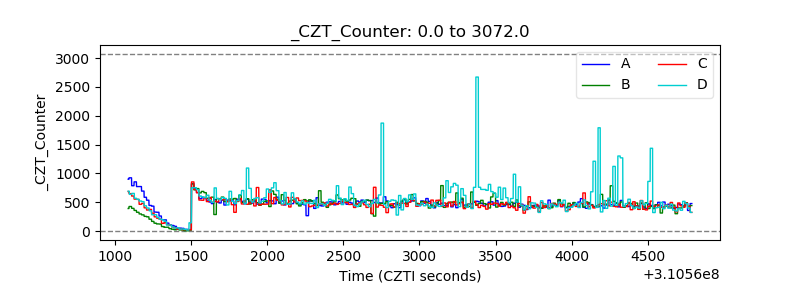 |
| +2.5 Volts monitor |  |
| +5 Volts monitor | 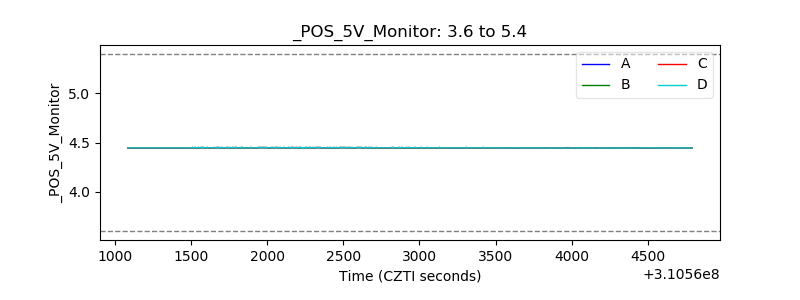 |
| _ROLL_ROT | 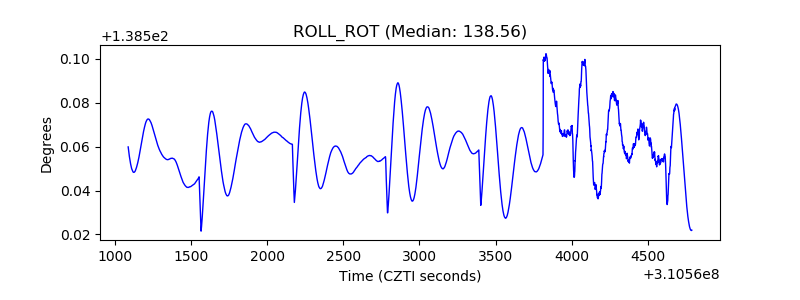 |
| _Roll_DEC | 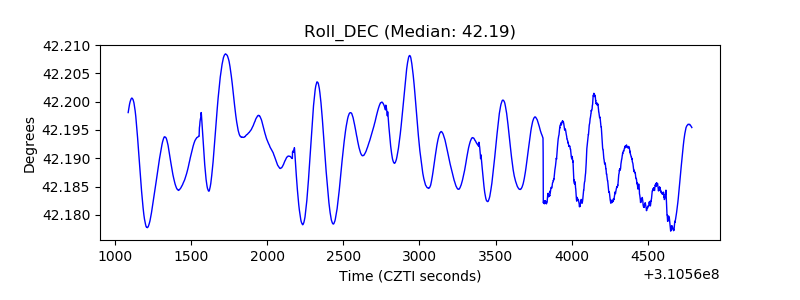 |
| _Roll_RA | 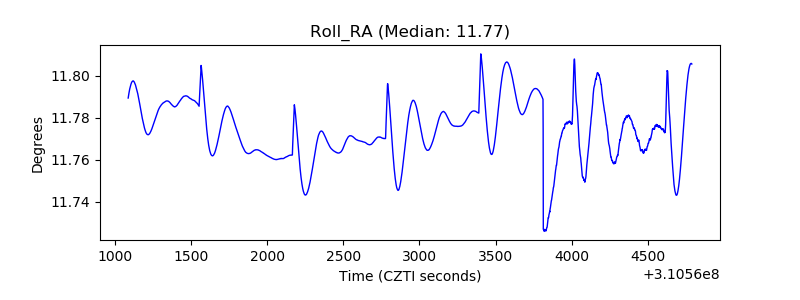 |
| Veto Counter | 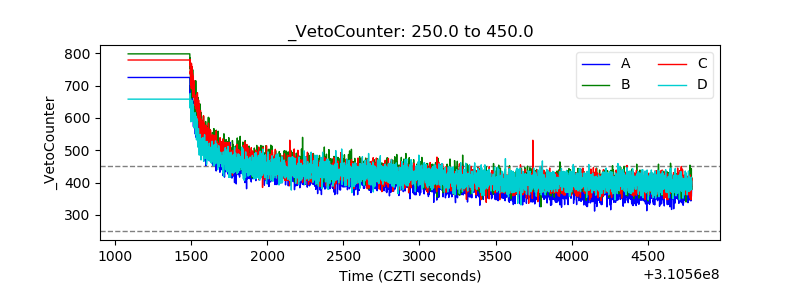 |