| Param | Original file | Final file |
|---|---|---|
| Filename | modeM0/AS1A07_065T01_9000003284cztM0_level2.fits | modeM0/AS1A07_065T01_9000003284cztM0_level2_quad_clean.evt |
| Size (bytes) | 794,350,080 | 538,876,800 |
| Size | 757.6 MB | 513.9 MB |
| Events in quadrant A | 4,957,062 | 2,873,216 |
| Events in quadrant B | 4,738,538 | 2,864,762 |
| Events in quadrant C | 4,805,122 | 2,709,822 |
| Events in quadrant D | 4,169,308 | 2,481,275 |
| Mode SS | |||
|---|---|---|---|
| Quadrant | BADHDUFLAG | Total packets | Discarded packets |
| A | 0 | 1600 | 0 |
| B | 0 | 1600 | 0 |
| C | 0 | 1600 | 0 |
| D | 0 | 1600 | 0 |
| Mode M9 | |||
|---|---|---|---|
| Quadrant | BADHDUFLAG | Total packets | Discarded packets |
| A | 0 | 136 | 0 |
| B | 0 | 136 | 0 |
| C | 0 | 136 | 0 |
| D | 0 | 136 | 0 |
| Mode M0 | |||
|---|---|---|---|
| Quadrant | BADHDUFLAG | Total packets | Discarded packets |
| A | 0 | 162258 | 0 |
| B | 0 | 165839 | 0 |
| C | 0 | 164256 | 0 |
| D | 0 | 189355 | 0 |
| Quadrant | Total seconds | Saturated seconds | Saturation percentage |
|---|---|---|---|
| A | 78575 | 837 | 1.065224% |
| B | 78577 | 1091 | 1.388447% |
| C | 78577 | 1279 | 1.627703% |
| D | 78577 | 2492 | 3.171411% |
Noise dominated data is calculated using 1-second bins in cleaned event files. If a bin has >2000 counts, and if more than 50% of those come from <1% of pixels, then it is considered to be noise-dominated and hence unusable.
| Quadrant | # 1 sec bins | Bins with >0 counts | Bins with >2000 counts | High rate bins dominated by noise | Noise dominated (total time) | Noise dominated (detector-on time) | Marked lightcurve |
|---|---|---|---|---|---|---|---|
| A | 128850 | 78575 | 0 | 0 | 0.00% | 0.00% | 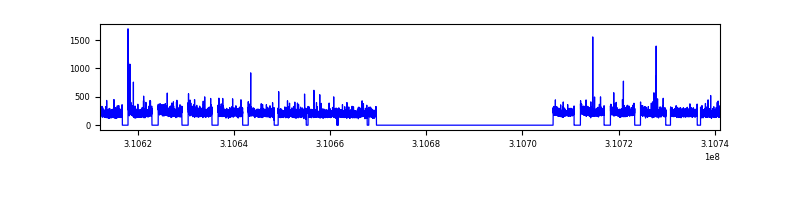 |
| B | 128851 | 78577 | 0 | 0 | 0.00% | 0.00% | 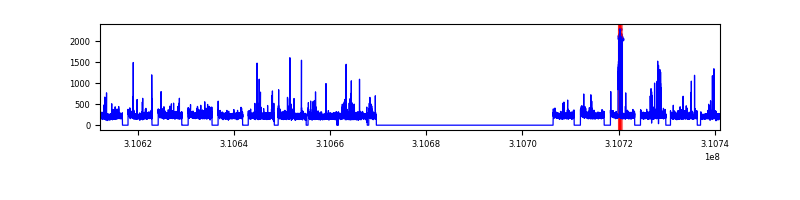 |
| C | 128851 | 78577 | 0 | 0 | 0.00% | 0.00% | 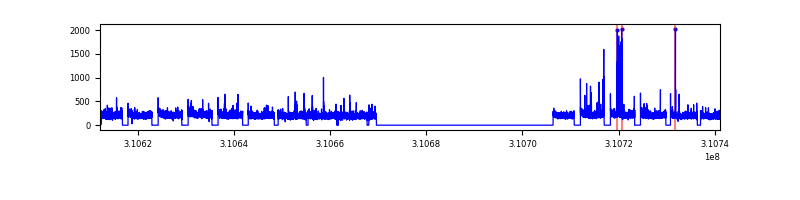 |
| D | 128851 | 78513 | 0 | 0 | 0.00% | 0.00% | 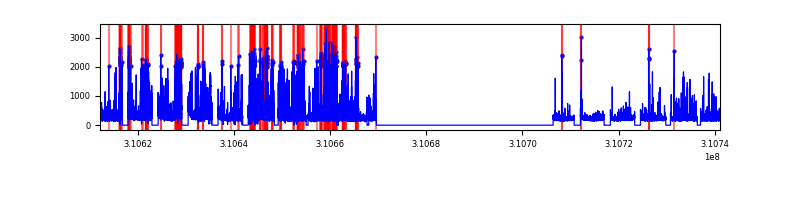 |
Top three noisy pixels from each quadrant. If the there are fewer than three noisy pixels in the level2.evt file, extra rows are filled as -1
| Pixel properties | Quadrant properties | ||||||
|---|---|---|---|---|---|---|---|
| Quadrant | DetID | PixID | Counts | Sigma | Mean | Median | Sigma |
| A | 0 | 29 | 4701 | 10.86 | 1291 | 1211 | 321.3 |
| A | 7 | 110 | 4059 | 8.86 | 1291 | 1211 | 321.3 |
| A | 0 | 30 | 3708 | 7.77 | 1291 | 1211 | 321.3 |
| B | 2 | 9 | 3777 | 10.48 | 1251 | 1197 | 246.1 |
| B | 2 | 8 | 3182 | 8.07 | 1251 | 1197 | 246.1 |
| B | 5 | 128 | 3075 | 7.63 | 1251 | 1197 | 246.1 |
| C | 1 | 80 | 3607 | 7.45 | 1268 | 1186 | 324.9 |
| C | 1 | 81 | 3581 | 7.37 | 1268 | 1186 | 324.9 |
| C | 12 | 241 | 3324 | 6.58 | 1268 | 1186 | 324.9 |
| D | 7 | 3 | 3029 | 6.23 | 1188 | 1083 | 312.5 |
| D | 3 | 14 | 2985 | 6.08 | 1188 | 1083 | 312.5 |
| D | 6 | 67 | 2969 | 6.03 | 1188 | 1083 | 312.5 |
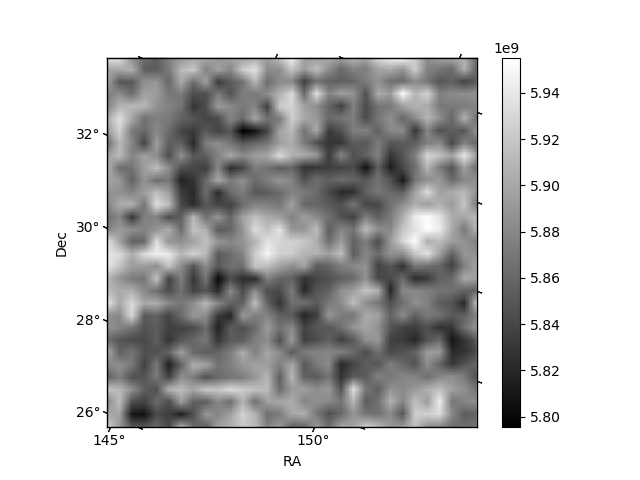
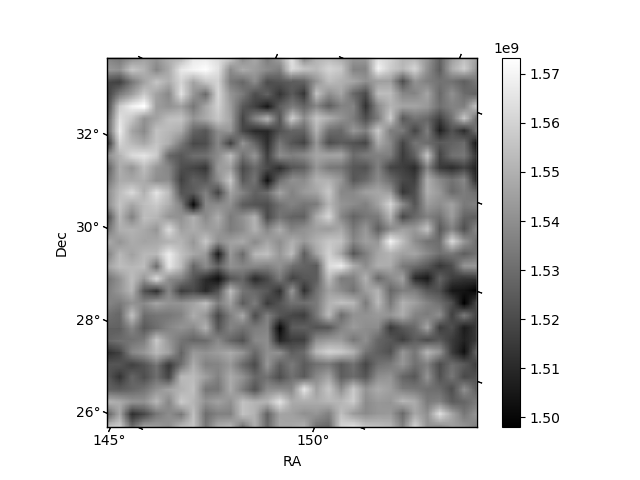
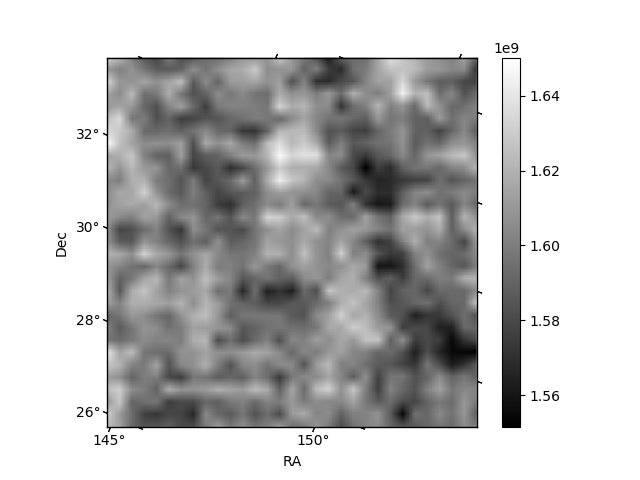
Histogram calculated using DETX and DETY for each event in the final _common_clean file
| Quadrant A | 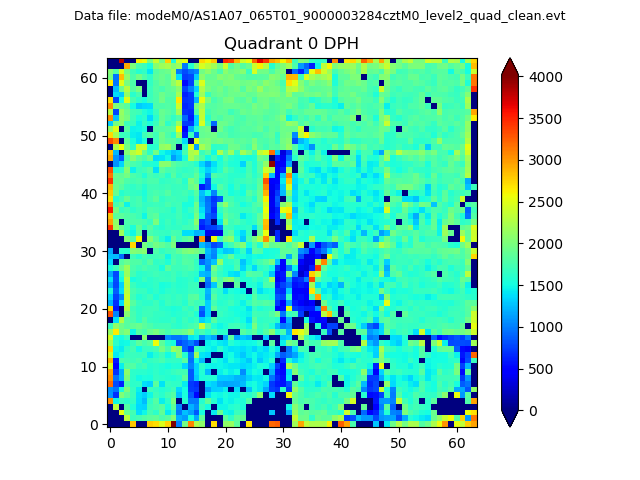 |
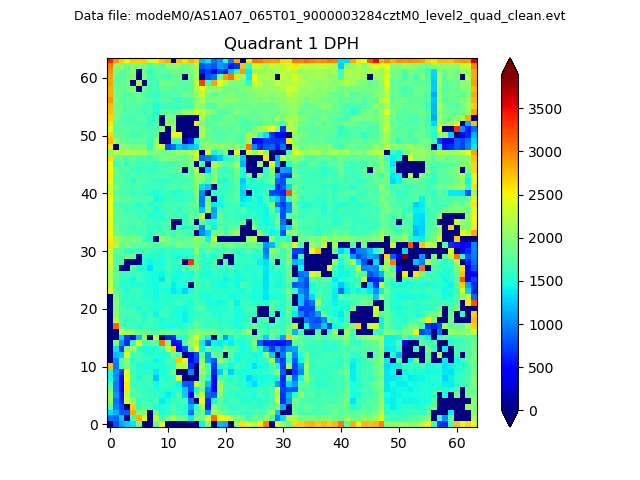 |
Quadrant B |
|---|---|---|---|
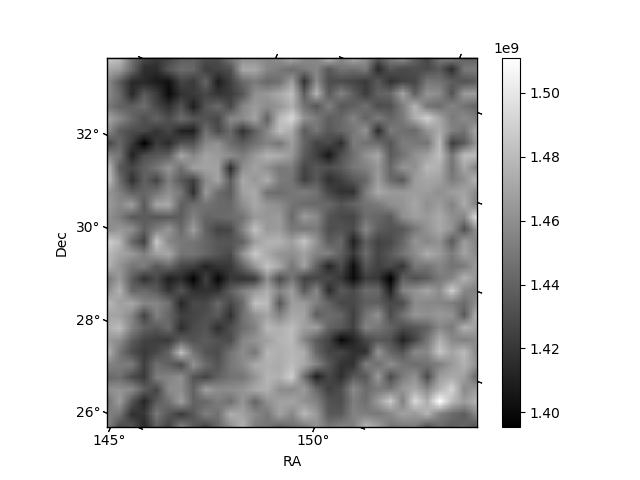
| Quadrant D | 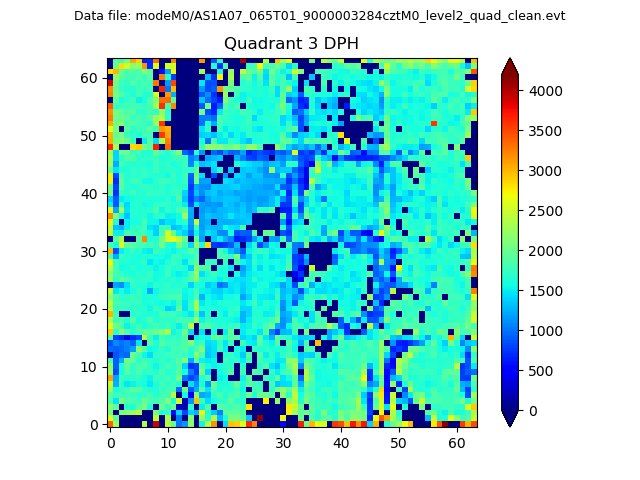 |
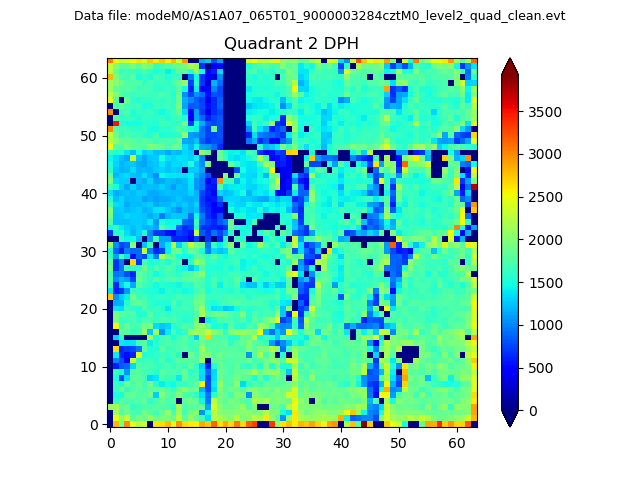 |
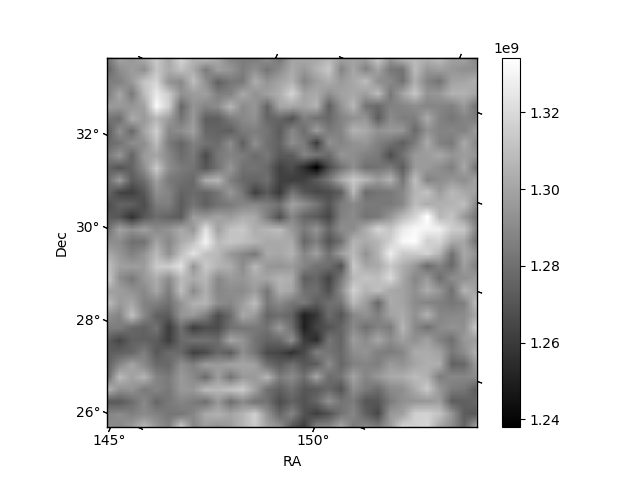
Quadrant C |
| Plot type | Count rate plots | Images |
|---|---|---|
| Comparison with Poisson distribution Blue bars denote a histogram of data divided into 1 sec bins. Red curve is a Poisson curve with rate = median count rate of data. |
 |
 |
| Quadrant-wise count rates Data is divided into 100 sec bins |
 |
|
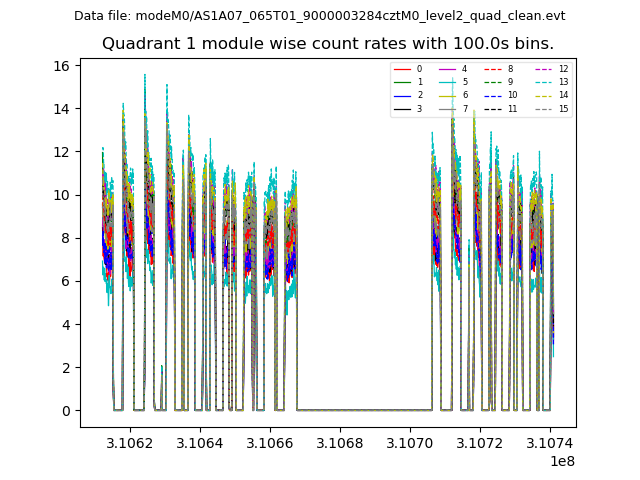
| Module-wise count rates for Quadrant A Data is divided into 100 sec bins |
 |
 |
| Module-wise count rates for Quadrant B Data is divided into 100 sec bins |
 |
 |
| Module-wise count rates for Quadrant C Data is divided into 100 sec bins |
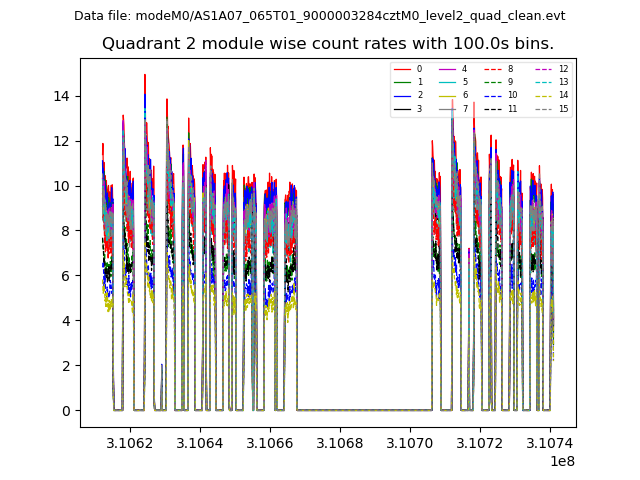 |
 |
| Module-wise count rates for Quadrant D Data is divided into 100 sec bins |
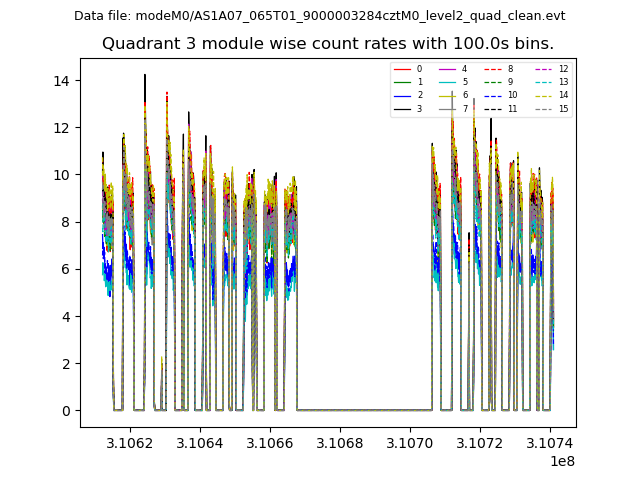 |
 |
| Parameter | Plot |
|---|---|
| CZT HV Monitor |  |
| D_VDD | 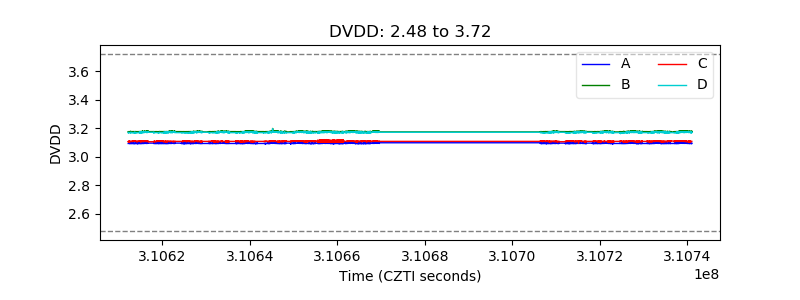 |
| Temperature 1 |  |
| Veto HV Monitor | 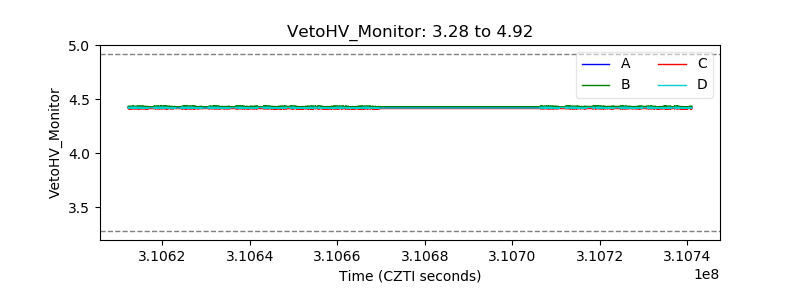 |
| Veto LLD | 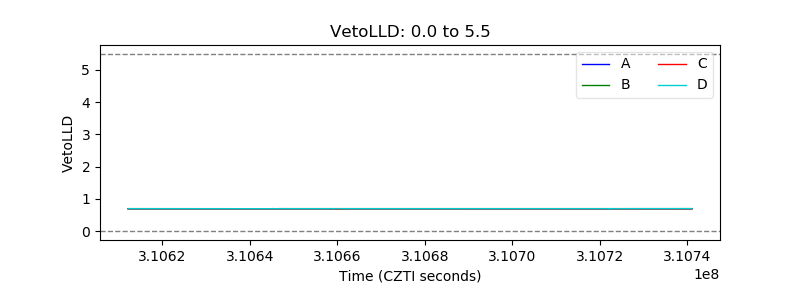 |
| Alpha Counter |  |
| _CPM_Rate | 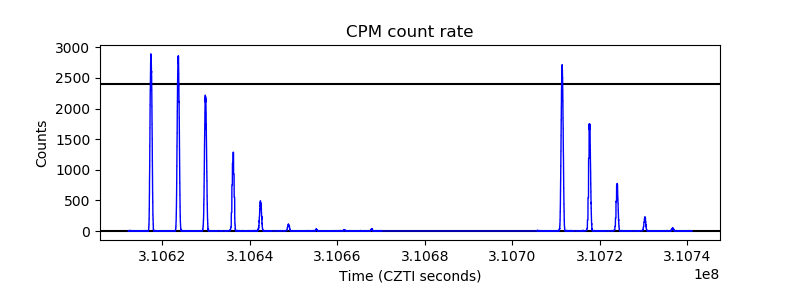 |
| CZT Counter | 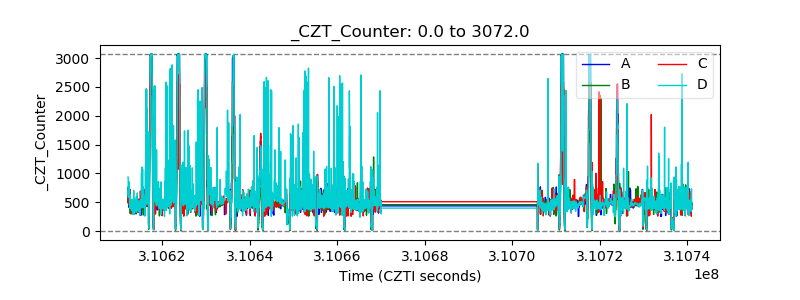 |
| +2.5 Volts monitor | 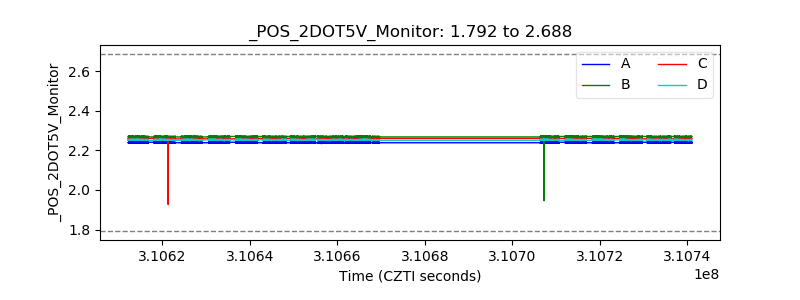 |
| +5 Volts monitor |  |
| _ROLL_ROT |  |
| _Roll_DEC | 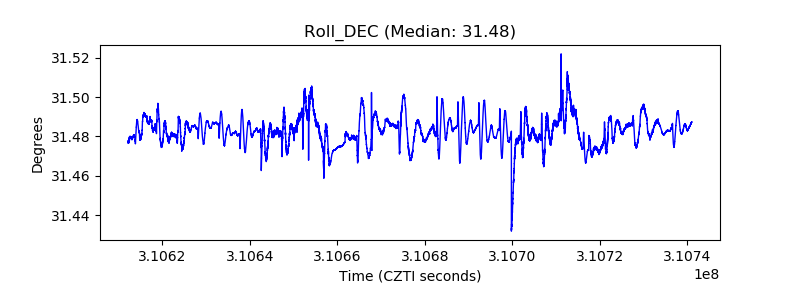 |
| _Roll_RA | 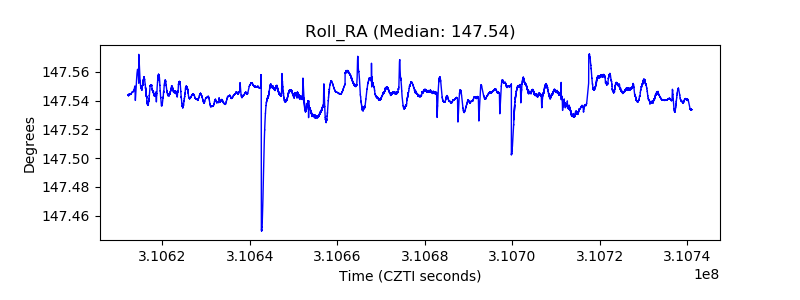 |
| Veto Counter | 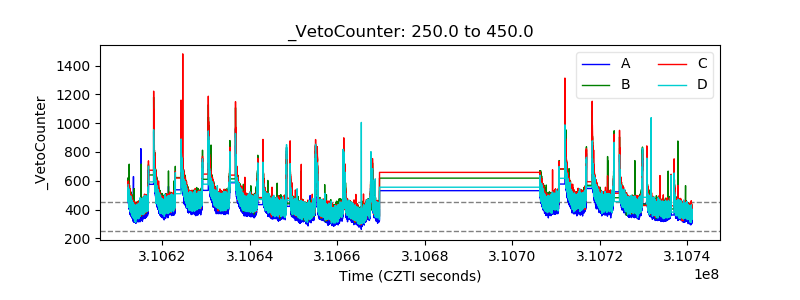 |