| Param | Original file | Final file |
|---|---|---|
| Filename | modeM0/AS1A07_065T01_9000003284_22188cztM0_level2.evt | modeM0/AS1A07_065T01_9000003284_22188cztM0_level2_quad_clean.evt |
| Size (bytes) | 476,864,640 | 101,931,840 |
| Size | 454.8 MB | 97.2 MB |
| Events in quadrant A | 3,184,037 | 675,566 |
| Events in quadrant B | 3,184,000 | 693,283 |
| Events in quadrant C | 3,127,914 | 653,235 |
| Events in quadrant D | 4,514,737 | 621,946 |
| Mode SS | |||
|---|---|---|---|
| Quadrant | BADHDUFLAG | Total packets | Discarded packets |
| A | 0 | 130 | 0 |
| B | 0 | 130 | 0 |
| C | 0 | 130 | 0 |
| D | 0 | 130 | 0 |
| Mode M9 | |||
|---|---|---|---|
| Quadrant | BADHDUFLAG | Total packets | Discarded packets |
| A | 0 | 13 | 0 |
| B | 0 | 13 | 0 |
| C | 0 | 13 | 0 |
| D | 0 | 13 | 0 |
| Mode M0 | |||
|---|---|---|---|
| Quadrant | BADHDUFLAG | Total packets | Discarded packets |
| A | 0 | 13332 | 1 |
| B | 0 | 13341 | 1 |
| C | 0 | 13178 | 1 |
| D | 0 | 17548 | 1 |
| Quadrant | Total seconds | Saturated seconds | Saturation percentage |
|---|---|---|---|
| A | 6347 | 9 | 0.141799% |
| B | 6348 | 22 | 0.346566% |
| C | 6348 | 39 | 0.614367% |
| D | 6348 | 289 | 4.552615% |
Noise dominated data is calculated using 1-second bins in cleaned event files. If a bin has >2000 counts, and if more than 50% of those come from <1% of pixels, then it is considered to be noise-dominated and hence unusable.
| Quadrant | # 1 sec bins | Bins with >0 counts | Bins with >2000 counts | High rate bins dominated by noise | Noise dominated (total time) | Noise dominated (detector-on time) | Marked lightcurve |
|---|---|---|---|---|---|---|---|
| A | 7652 | 6348 | 0 | 0 | 0.00% | 0.00% | 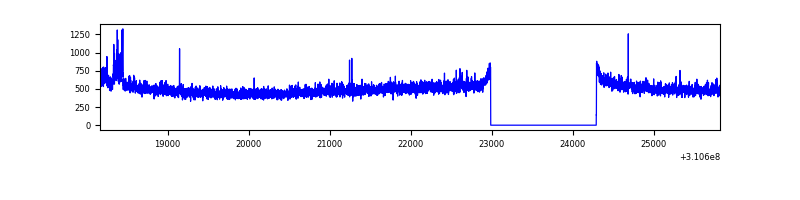 |
| B | 7653 | 6349 | 1 | 1 | 0.01% | 0.02% | 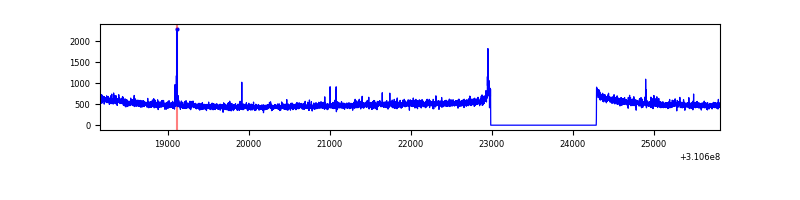 |
| C | 7653 | 6349 | 0 | 0 | 0.00% | 0.00% | 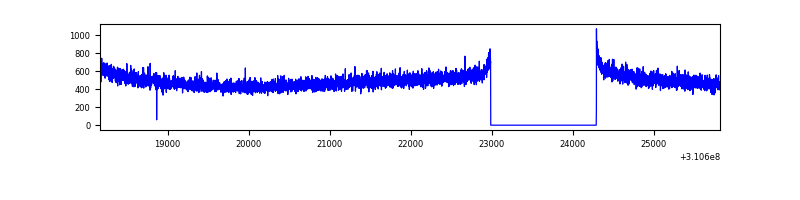 |
| D | 7653 | 6349 | 238 | 238 | 3.11% | 3.75% | 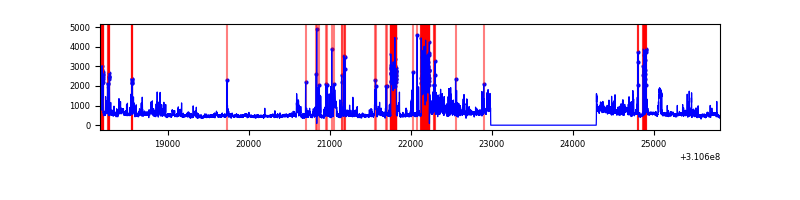 |
Top three noisy pixels from each quadrant. If the there are fewer than three noisy pixels in the level2.evt file, extra rows are filled as -1
| Pixel properties | Quadrant properties | ||||||
|---|---|---|---|---|---|---|---|
| Quadrant | DetID | PixID | Counts | Sigma | Mean | Median | Sigma |
| A | 3 | 1 | 72192 | 442.14 | 807 | 795 | 161.5 |
| A | 13 | 254 | 10966 | 62.99 | 807 | 795 | 161.5 |
| A | 0 | 226 | 6969 | 38.23 | 807 | 795 | 161.5 |
| B | 12 | 111 | 17720 | 113.76 | 807 | 788 | 148.8 |
| B | 11 | 111 | 15956 | 101.91 | 807 | 788 | 148.8 |
| B | 14 | 111 | 14461 | 91.87 | 807 | 788 | 148.8 |
| C | 14 | 238 | 124720 | 695.45 | 770 | 775 | 178.2 |
| C | 13 | 61 | 5345 | 25.64 | 770 | 775 | 178.2 |
| C | 15 | 78 | 1824 | 5.89 | 770 | 775 | 178.2 |
| D | 1 | 52 | 1365598 | 7546.01 | 751 | 731 | 180.9 |
| D | 2 | 136 | 298296 | 1645.16 | 751 | 731 | 180.9 |
| D | 2 | 234 | 21501 | 114.83 | 751 | 731 | 180.9 |
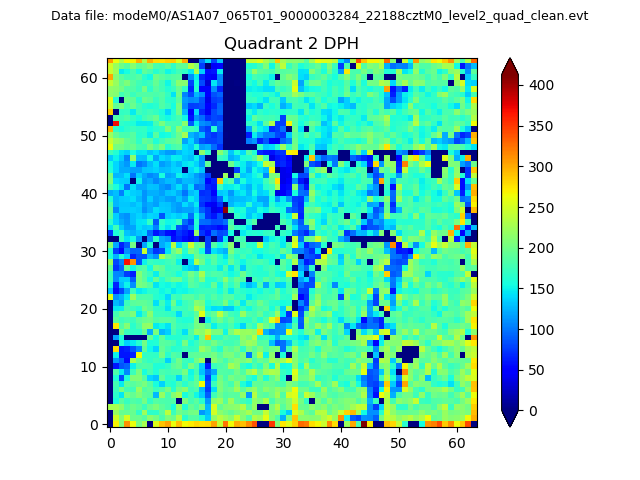
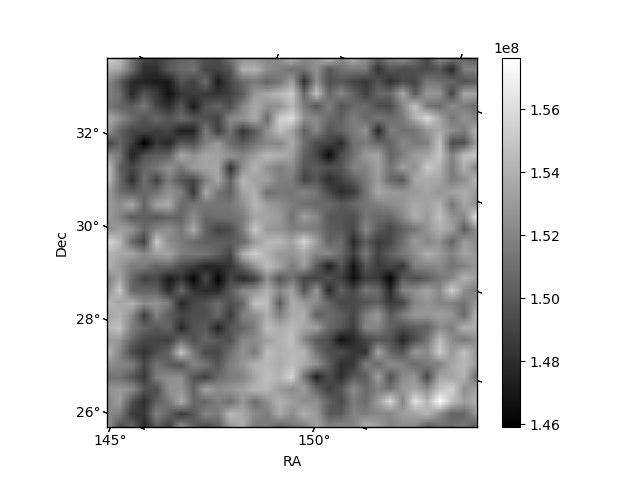
Histogram calculated using DETX and DETY for each event in the final _common_clean file
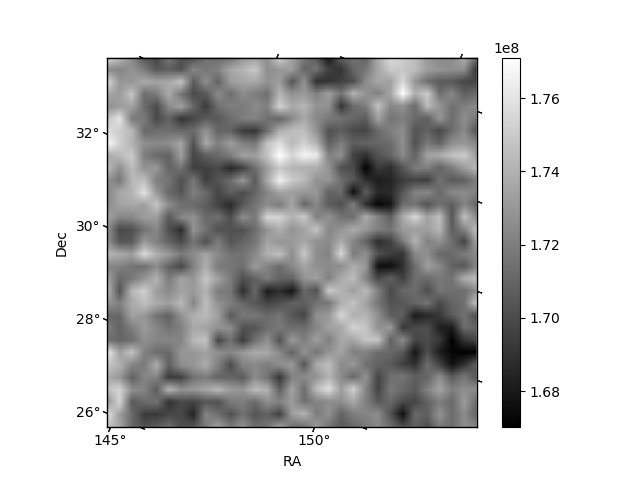
| Quadrant A | 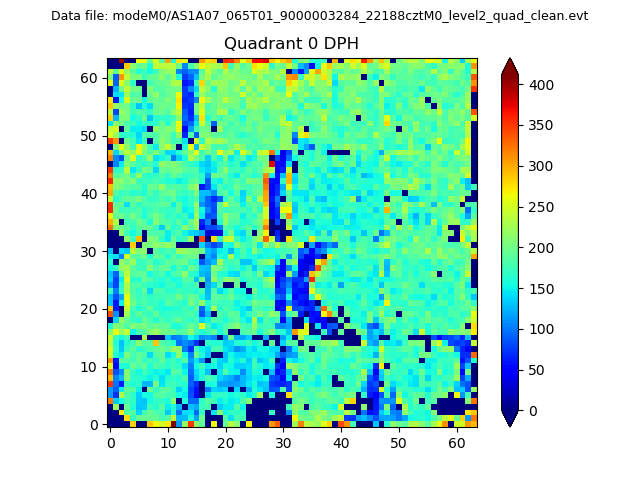 |
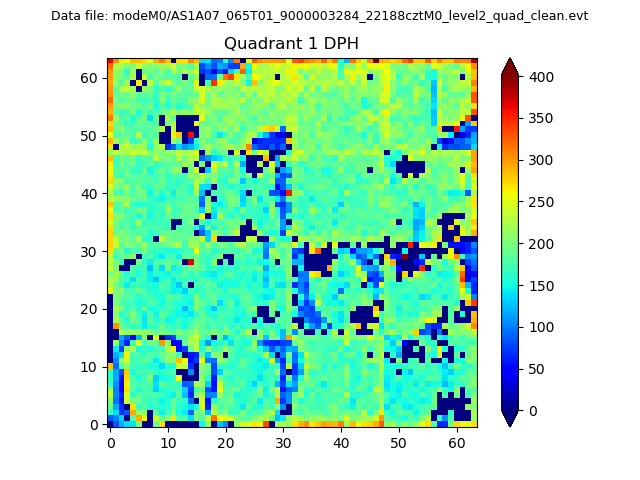 |
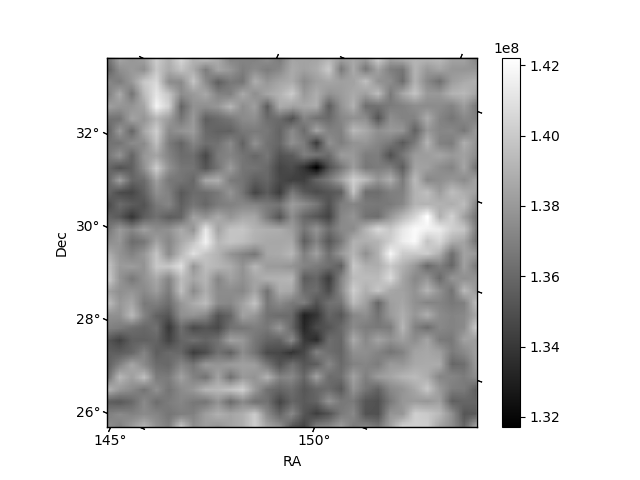
Quadrant B |
|---|---|---|---|
| Quadrant D | 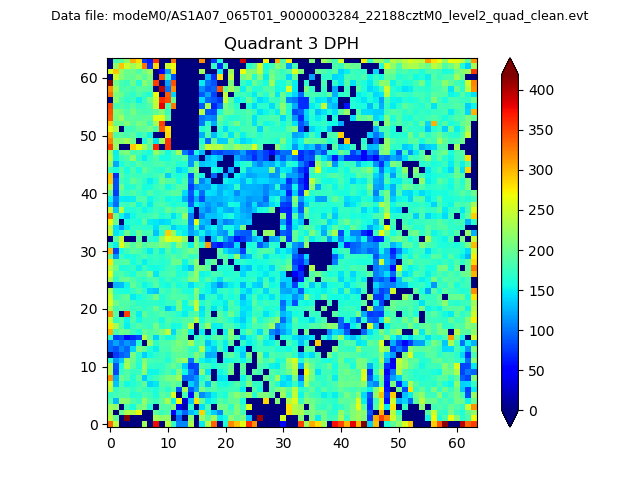 |
 |
Quadrant C |
| Plot type | Count rate plots | Images |
|---|---|---|
| Comparison with Poisson distribution Blue bars denote a histogram of data divided into 1 sec bins. Red curve is a Poisson curve with rate = median count rate of data. |
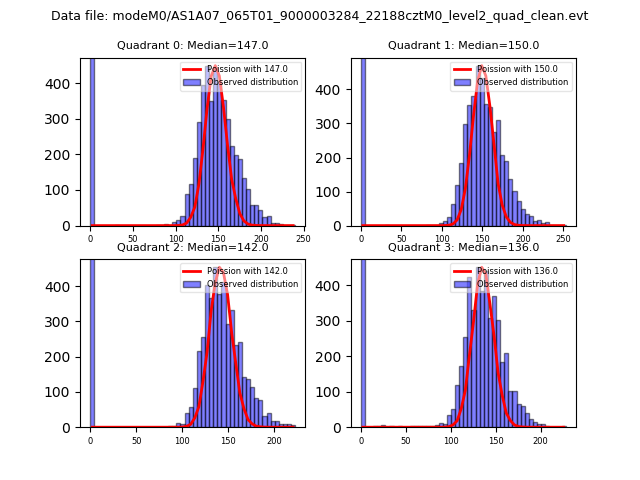 |
 |
| Quadrant-wise count rates Data is divided into 100 sec bins |
 |
|
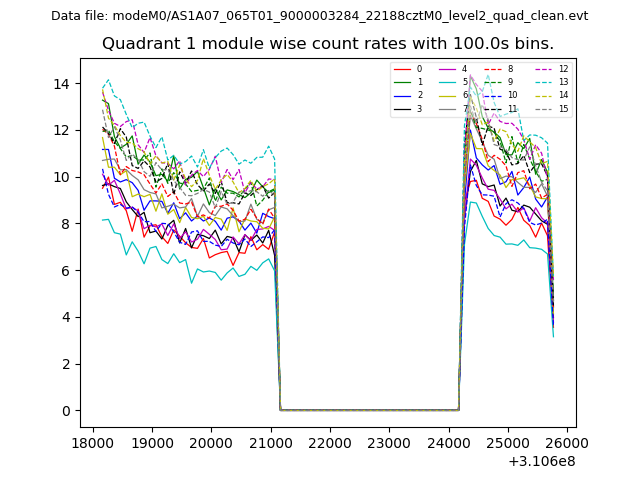
| Module-wise count rates for Quadrant A Data is divided into 100 sec bins |
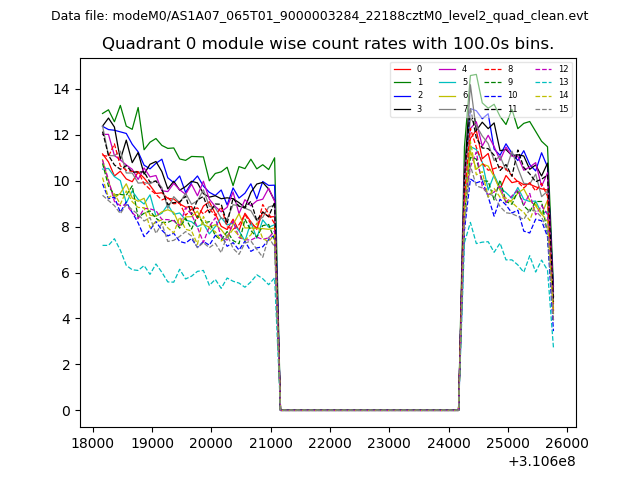 |
 |
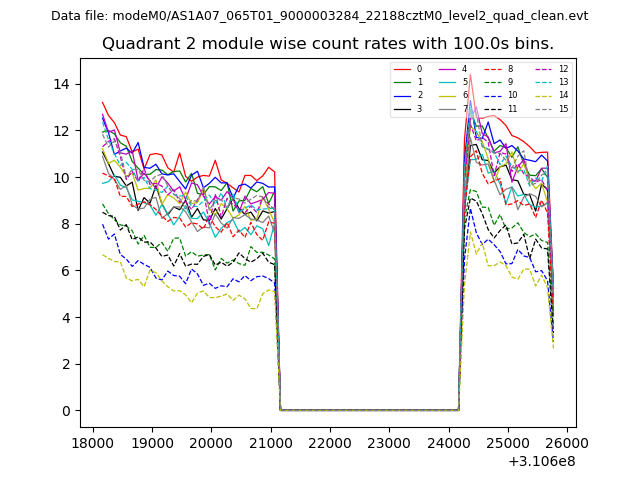
| Module-wise count rates for Quadrant B Data is divided into 100 sec bins |
 |
 |
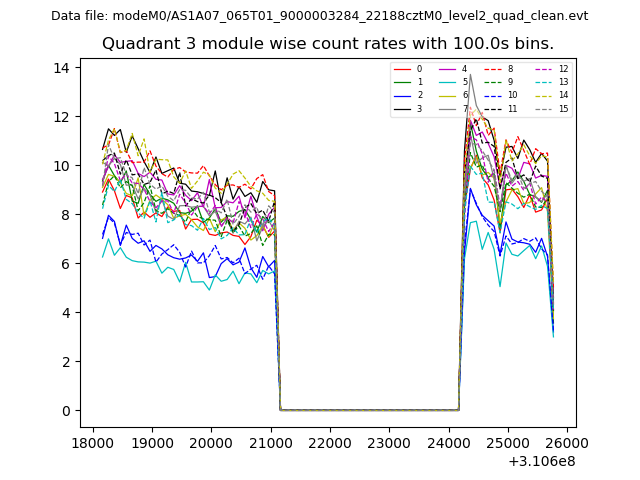
| Module-wise count rates for Quadrant C Data is divided into 100 sec bins |
 |
 |
| Module-wise count rates for Quadrant D Data is divided into 100 sec bins |
 |
 |
| Parameter | Plot |
|---|---|
| CZT HV Monitor | 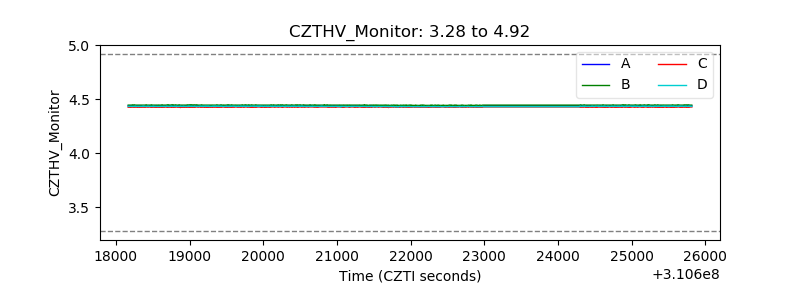 |
| D_VDD | 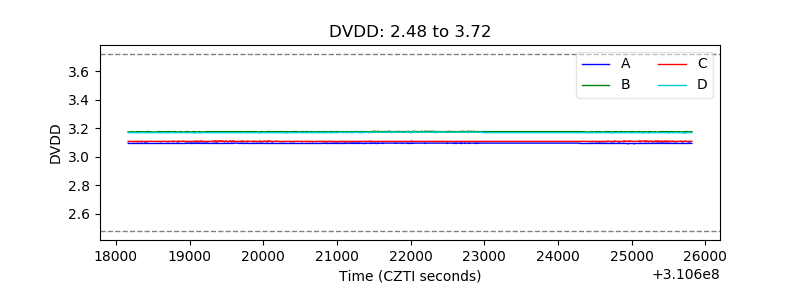 |
| Temperature 1 | 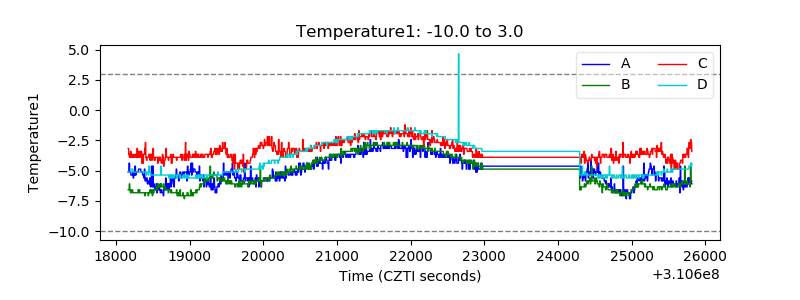 |
| Veto HV Monitor | 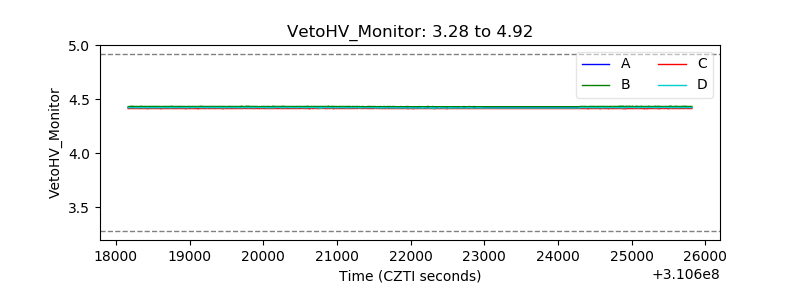 |
| Veto LLD | 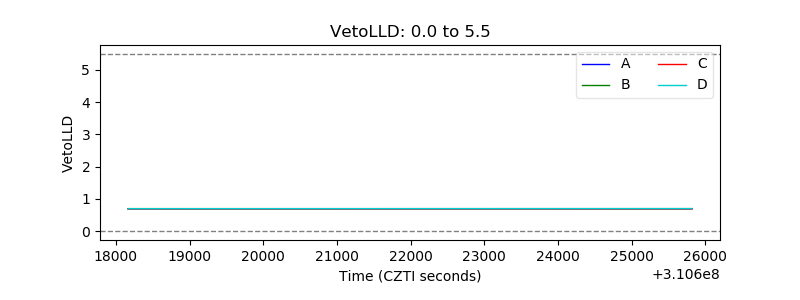 |
| Alpha Counter | 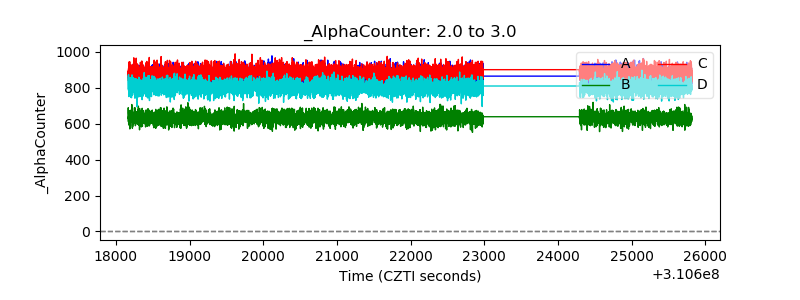 |
| _CPM_Rate | 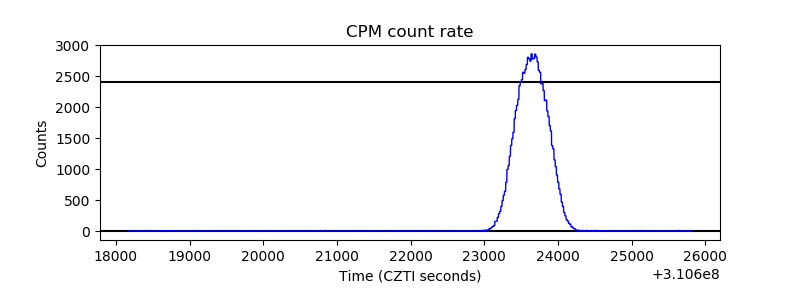 |
| CZT Counter | 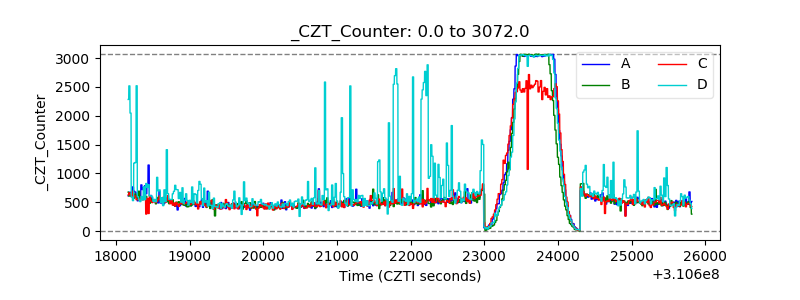 |
| +2.5 Volts monitor |  |
| +5 Volts monitor |  |
| _ROLL_ROT | 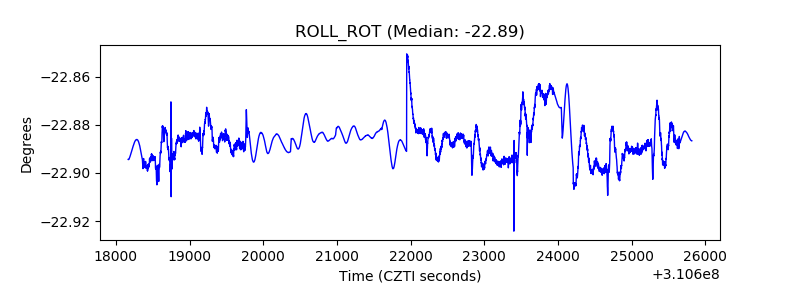 |
| _Roll_DEC | 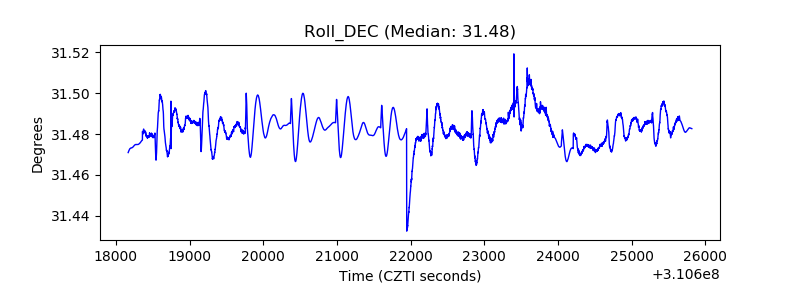 |
| _Roll_RA | 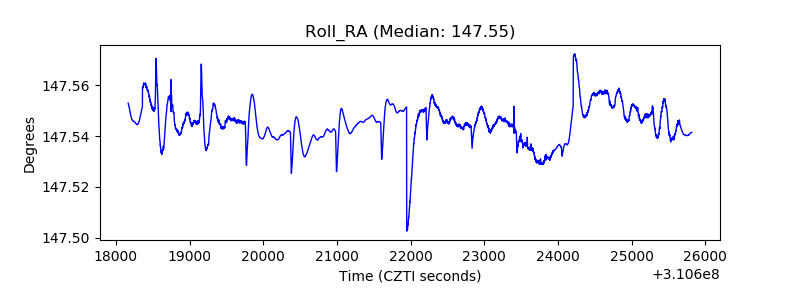 |
| Veto Counter | 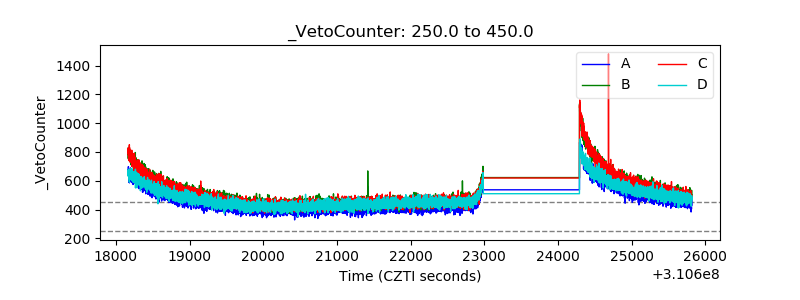 |