| Param | Original file | Final file |
|---|---|---|
| Filename | modeM0/AS1A07_065T01_9000003284_22191cztM0_level2.evt | modeM0/AS1A07_065T01_9000003284_22191cztM0_level2_quad_clean.evt |
| Size (bytes) | 435,156,480 | 86,042,880 |
| Size | 415.0 MB | 82.1 MB |
| Events in quadrant A | 3,004,372 | 558,872 |
| Events in quadrant B | 3,003,066 | 567,777 |
| Events in quadrant C | 3,005,366 | 540,035 |
| Events in quadrant D | 3,752,217 | 514,071 |
| Mode SS | |||
|---|---|---|---|
| Quadrant | BADHDUFLAG | Total packets | Discarded packets |
| A | 0 | 124 | 0 |
| B | 0 | 124 | 0 |
| C | 0 | 124 | 0 |
| D | 0 | 124 | 0 |
| Mode M9 | |||
|---|---|---|---|
| Quadrant | BADHDUFLAG | Total packets | Discarded packets |
| A | 0 | 12 | 0 |
| B | 0 | 12 | 0 |
| C | 0 | 12 | 0 |
| D | 0 | 12 | 0 |
| Mode M0 | |||
|---|---|---|---|
| Quadrant | BADHDUFLAG | Total packets | Discarded packets |
| A | 0 | 12488 | 1 |
| B | 0 | 12505 | 1 |
| C | 0 | 12506 | 1 |
| D | 0 | 15024 | 1 |
| Quadrant | Total seconds | Saturated seconds | Saturation percentage |
|---|---|---|---|
| A | 6083 | 38 | 0.624692% |
| B | 6083 | 36 | 0.591813% |
| C | 6084 | 59 | 0.969757% |
| D | 6084 | 254 | 4.174885% |
Noise dominated data is calculated using 1-second bins in cleaned event files. If a bin has >2000 counts, and if more than 50% of those come from <1% of pixels, then it is considered to be noise-dominated and hence unusable.
| Quadrant | # 1 sec bins | Bins with >0 counts | Bins with >2000 counts | High rate bins dominated by noise | Noise dominated (total time) | Noise dominated (detector-on time) | Marked lightcurve |
|---|---|---|---|---|---|---|---|
| A | 7253 | 6084 | 0 | 0 | 0.00% | 0.00% | 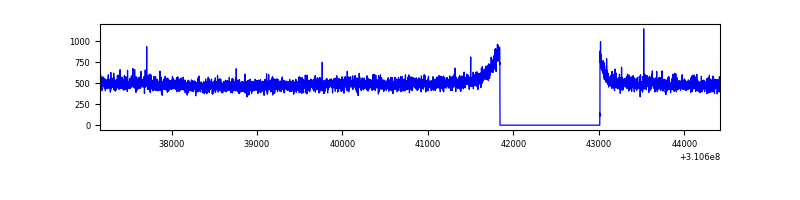 |
| B | 7253 | 6084 | 0 | 0 | 0.00% | 0.00% | 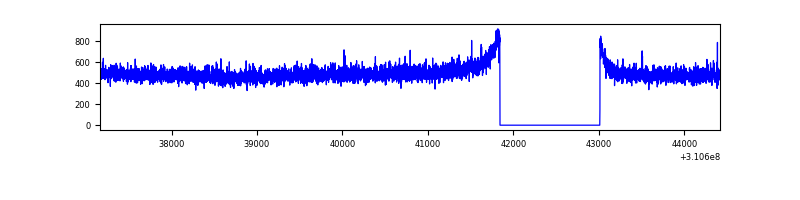 |
| C | 7254 | 6085 | 0 | 0 | 0.00% | 0.00% | 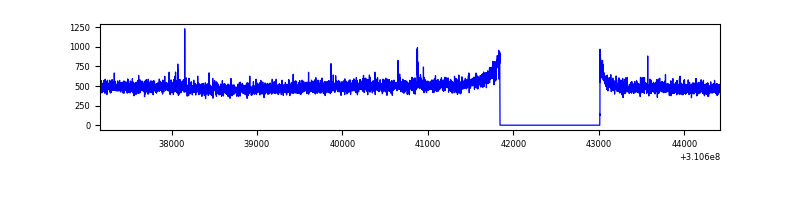 |
| D | 7254 | 6085 | 216 | 216 | 2.98% | 3.55% | 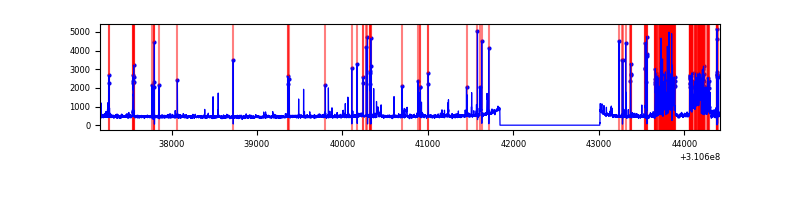 |
Top three noisy pixels from each quadrant. If the there are fewer than three noisy pixels in the level2.evt file, extra rows are filled as -1
| Pixel properties | Quadrant properties | ||||||
|---|---|---|---|---|---|---|---|
| Quadrant | DetID | PixID | Counts | Sigma | Mean | Median | Sigma |
| A | 13 | 254 | 10977 | 65.47 | 776 | 763 | 156.0 |
| A | 4 | 2 | 9953 | 58.91 | 776 | 763 | 156.0 |
| A | 0 | 226 | 6757 | 38.42 | 776 | 763 | 156.0 |
| B | 12 | 111 | 17527 | 116.22 | 765 | 744 | 144.4 |
| B | 11 | 111 | 15778 | 104.11 | 765 | 744 | 144.4 |
| B | 14 | 111 | 13779 | 90.27 | 765 | 744 | 144.4 |
| C | 14 | 238 | 116061 | 666.1 | 738 | 742 | 173.1 |
| C | 10 | 22 | 14299 | 78.31 | 738 | 742 | 173.1 |
| C | 13 | 61 | 5201 | 25.76 | 738 | 742 | 173.1 |
| D | 12 | 235 | 461481 | 2561.87 | 739 | 718 | 179.9 |
| D | 1 | 52 | 443288 | 2460.72 | 739 | 718 | 179.9 |
| D | 2 | 234 | 23568 | 127.05 | 739 | 718 | 179.9 |
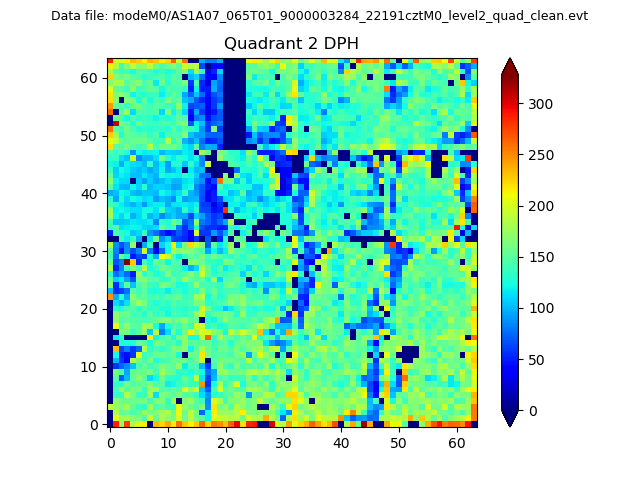
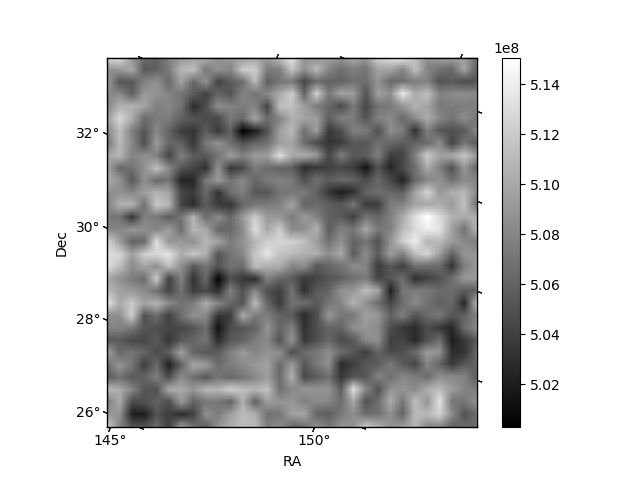
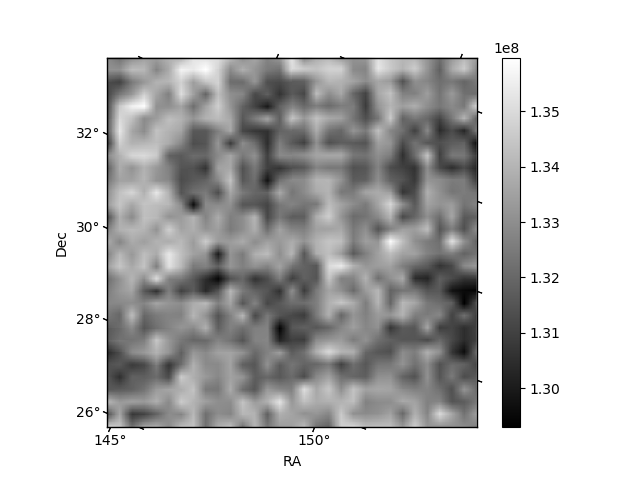
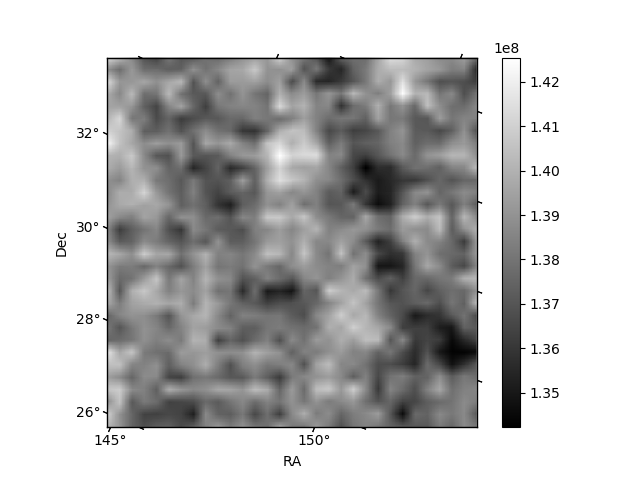
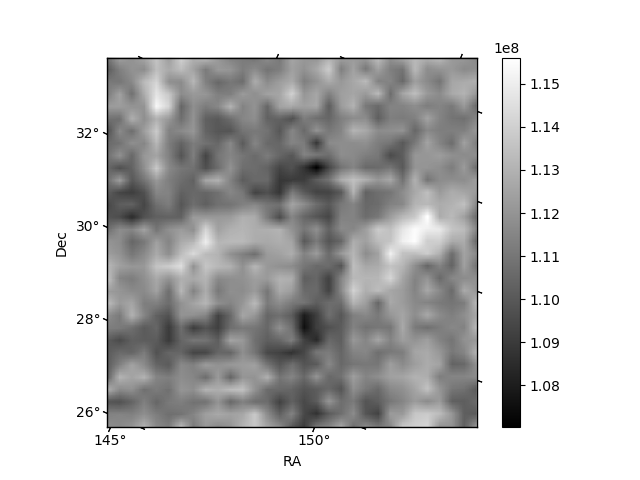
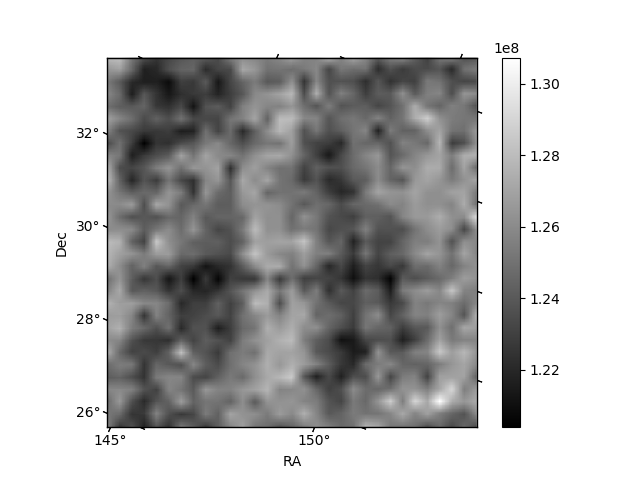
Histogram calculated using DETX and DETY for each event in the final _common_clean file
| Quadrant A | 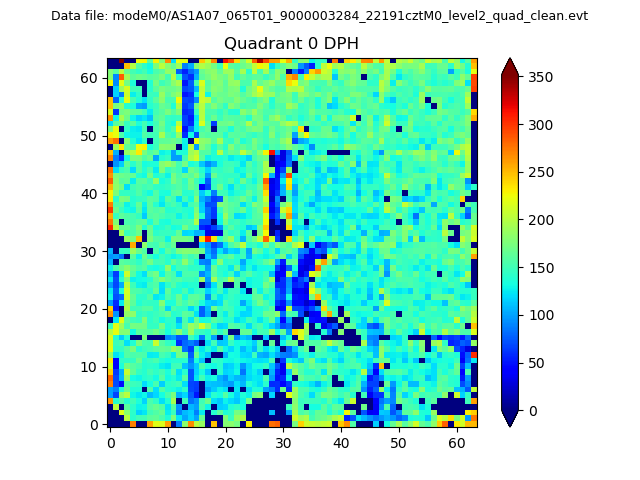 |
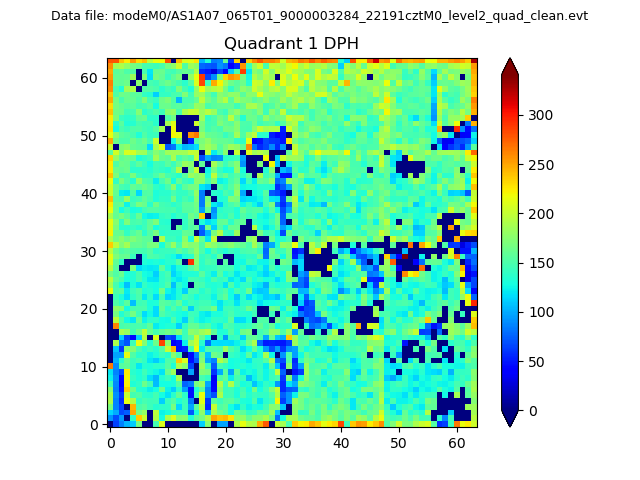 |
Quadrant B |
|---|---|---|---|
| Quadrant D | 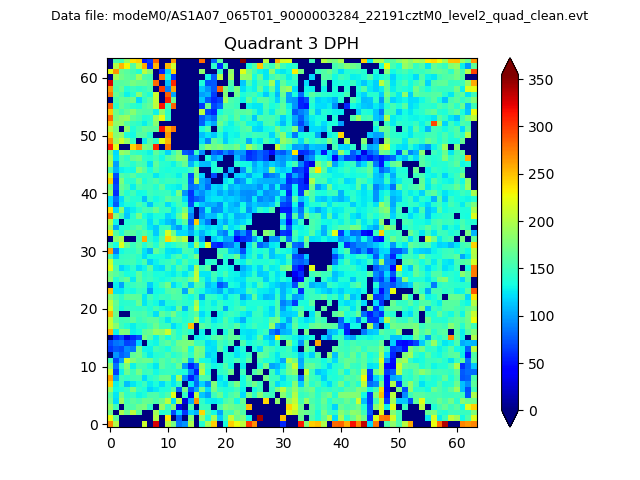 |
 |
Quadrant C |
| Plot type | Count rate plots | Images |
|---|---|---|
| Comparison with Poisson distribution Blue bars denote a histogram of data divided into 1 sec bins. Red curve is a Poisson curve with rate = median count rate of data. |
 |
 |
| Quadrant-wise count rates Data is divided into 100 sec bins |
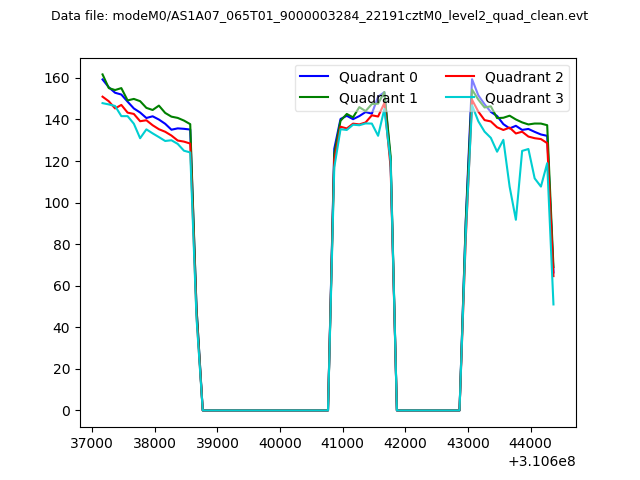 |
|
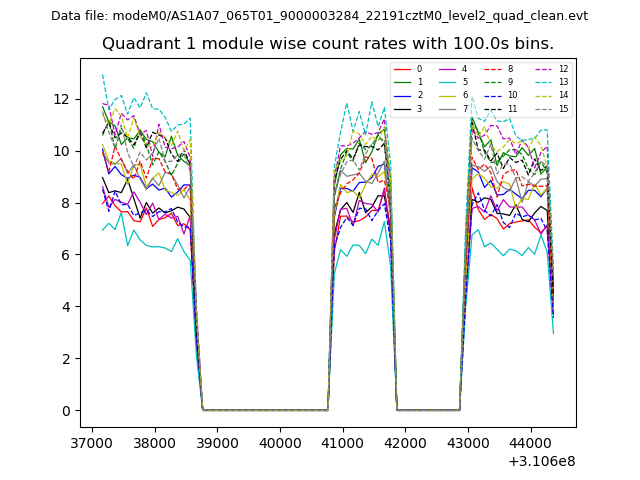
| Module-wise count rates for Quadrant A Data is divided into 100 sec bins |
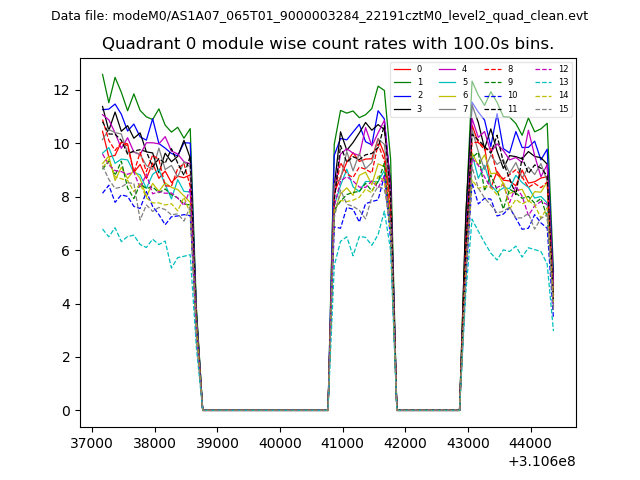 |
 |
| Module-wise count rates for Quadrant B Data is divided into 100 sec bins |
 |
 |
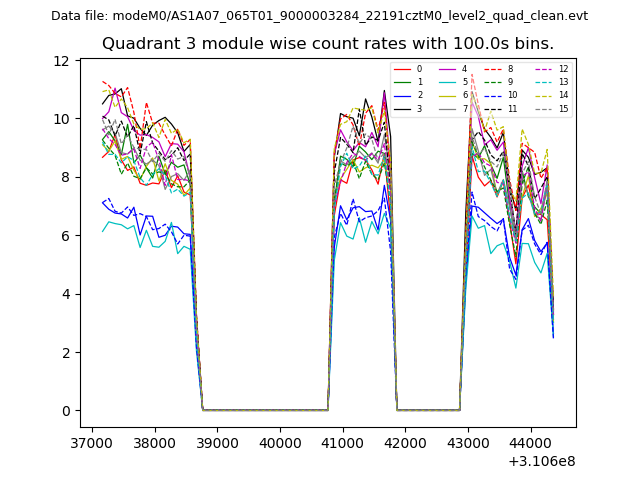
| Module-wise count rates for Quadrant C Data is divided into 100 sec bins |
 |
 |
| Module-wise count rates for Quadrant D Data is divided into 100 sec bins |
 |
 |
| Parameter | Plot |
|---|---|
| CZT HV Monitor | 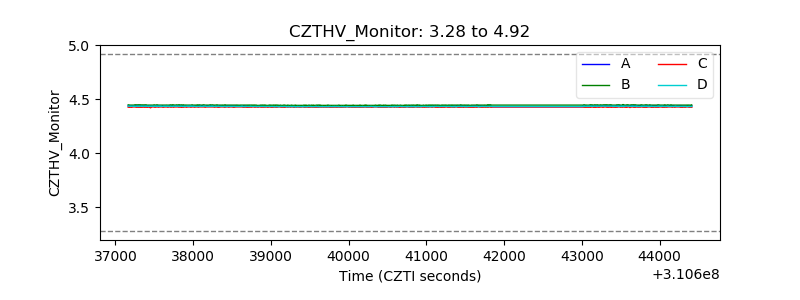 |
| D_VDD | 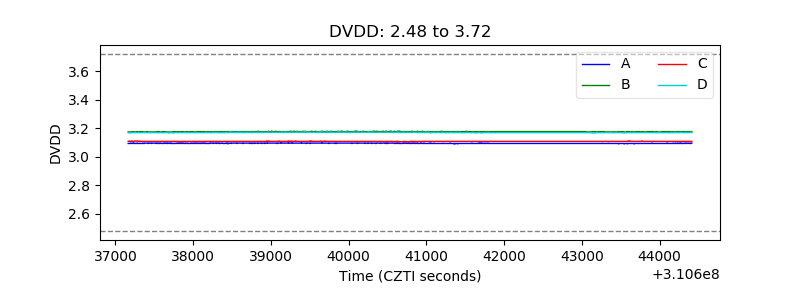 |
| Temperature 1 | 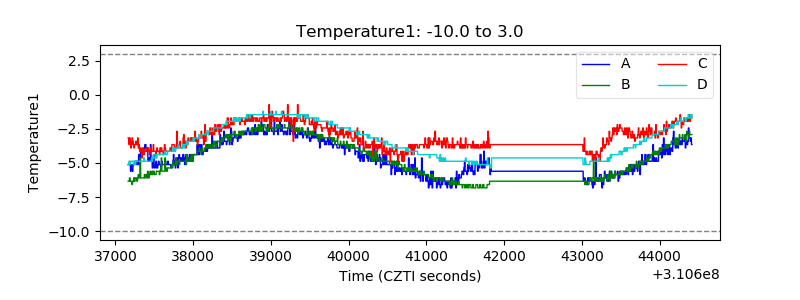 |
| Veto HV Monitor | 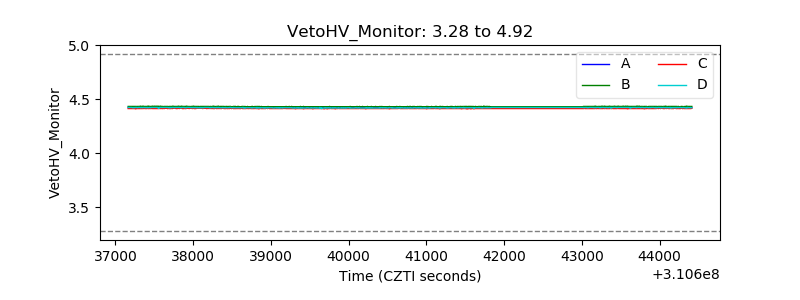 |
| Veto LLD | 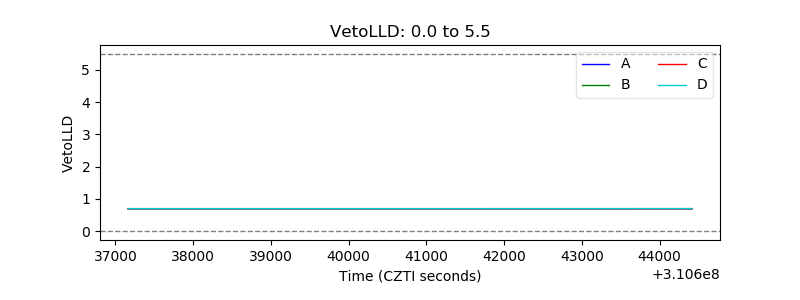 |
| Alpha Counter |  |
| _CPM_Rate | 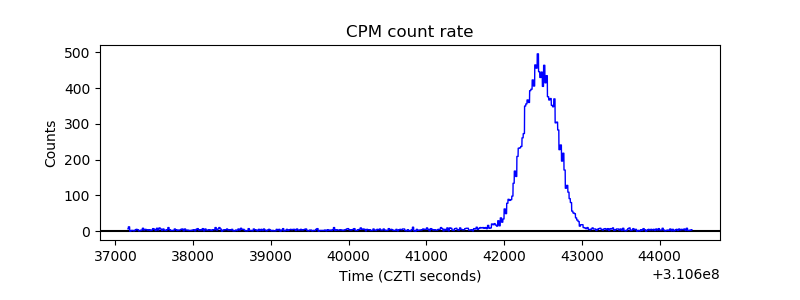 |
| CZT Counter |  |
| +2.5 Volts monitor |  |
| +5 Volts monitor |  |
| _ROLL_ROT | 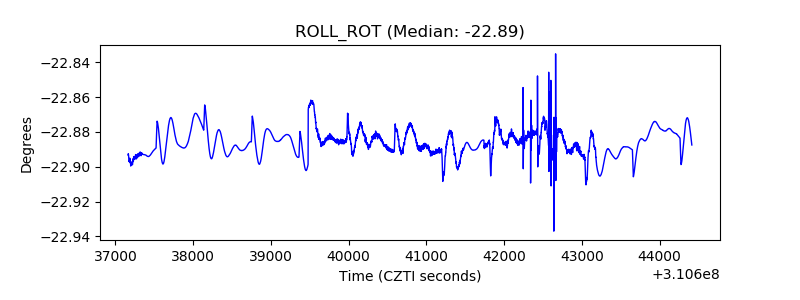 |
| _Roll_DEC | 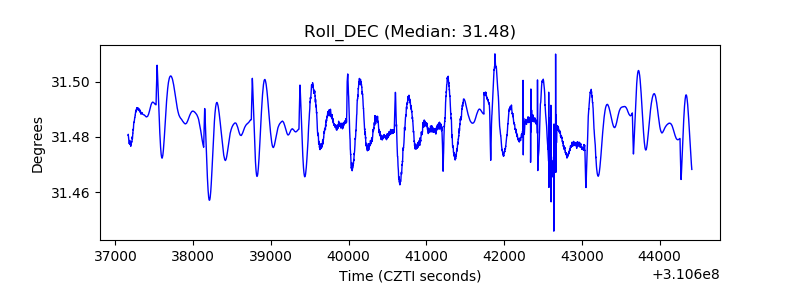 |
| _Roll_RA | 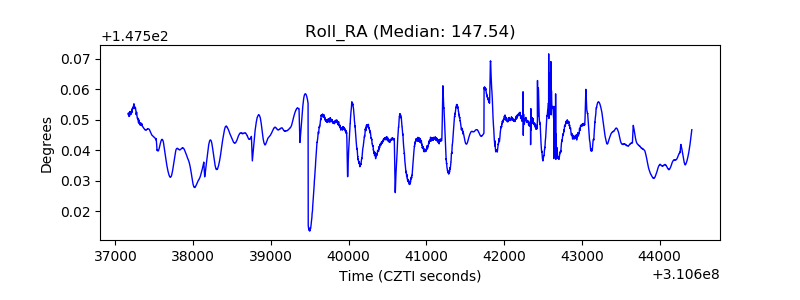 |
| Veto Counter | 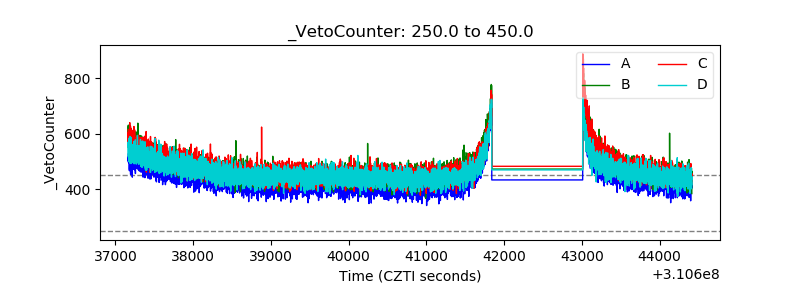 |