| Param | Original file | Final file |
|---|---|---|
| Filename | modeM0/AS1A07_065T01_9000003284_22192cztM0_level2.evt | modeM0/AS1A07_065T01_9000003284_22192cztM0_level2_quad_clean.evt |
| Size (bytes) | 477,993,600 | 80,507,520 |
| Size | 455.9 MB | 76.8 MB |
| Events in quadrant A | 3,016,023 | 513,989 |
| Events in quadrant B | 3,078,029 | 522,108 |
| Events in quadrant C | 3,026,211 | 497,488 |
| Events in quadrant D | 4,930,057 | 466,761 |
| Mode SS | |||
|---|---|---|---|
| Quadrant | BADHDUFLAG | Total packets | Discarded packets |
| A | 0 | 126 | 0 |
| B | 0 | 126 | 0 |
| C | 0 | 126 | 0 |
| D | 0 | 126 | 0 |
| Mode M9 | |||
|---|---|---|---|
| Quadrant | BADHDUFLAG | Total packets | Discarded packets |
| A | 0 | 8 | 0 |
| B | 0 | 8 | 0 |
| C | 0 | 8 | 0 |
| D | 0 | 8 | 0 |
| Mode M0 | |||
|---|---|---|---|
| Quadrant | BADHDUFLAG | Total packets | Discarded packets |
| A | 0 | 12811 | 1 |
| B | 0 | 12953 | 1 |
| C | 0 | 12814 | 1 |
| D | 0 | 18772 | 1 |
| Quadrant | Total seconds | Saturated seconds | Saturation percentage |
|---|---|---|---|
| A | 6270 | 107 | 1.706539% |
| B | 6270 | 110 | 1.754386% |
| C | 6271 | 124 | 1.977356% |
| D | 6271 | 519 | 8.276192% |
Noise dominated data is calculated using 1-second bins in cleaned event files. If a bin has >2000 counts, and if more than 50% of those come from <1% of pixels, then it is considered to be noise-dominated and hence unusable.
| Quadrant | # 1 sec bins | Bins with >0 counts | Bins with >2000 counts | High rate bins dominated by noise | Noise dominated (total time) | Noise dominated (detector-on time) | Marked lightcurve |
|---|---|---|---|---|---|---|---|
| A | 7085 | 6271 | 0 | 0 | 0.00% | 0.00% | 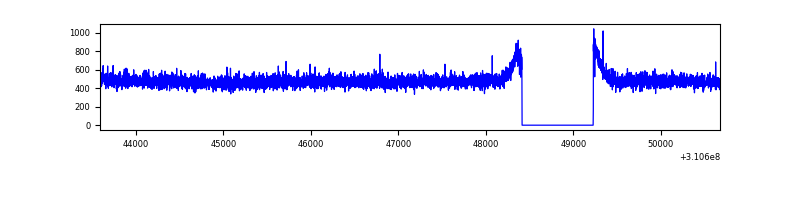 |
| B | 7085 | 6271 | 1 | 1 | 0.01% | 0.02% | 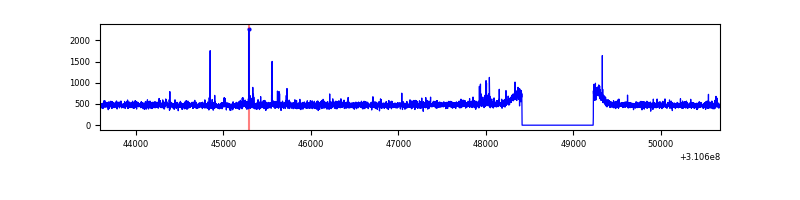 |
| C | 7086 | 6272 | 0 | 0 | 0.00% | 0.00% | 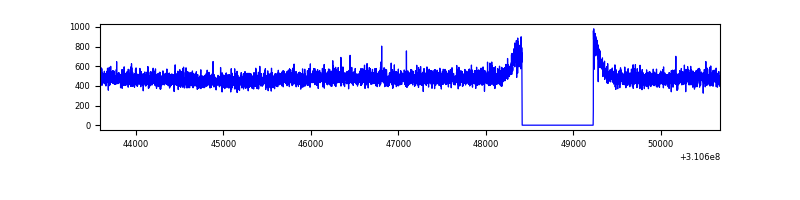 |
| D | 7086 | 6272 | 432 | 432 | 6.10% | 6.89% | 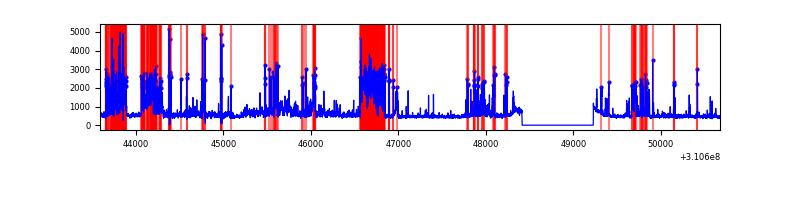 |
Top three noisy pixels from each quadrant. If the there are fewer than three noisy pixels in the level2.evt file, extra rows are filled as -1
| Pixel properties | Quadrant properties | ||||||
|---|---|---|---|---|---|---|---|
| Quadrant | DetID | PixID | Counts | Sigma | Mean | Median | Sigma |
| A | 13 | 254 | 11754 | 69.65 | 780 | 764 | 157.8 |
| A | 4 | 2 | 7476 | 42.54 | 780 | 764 | 157.8 |
| A | 0 | 226 | 6757 | 37.98 | 780 | 764 | 157.8 |
| B | 0 | 190 | 27915 | 185.2 | 769 | 750 | 146.7 |
| B | 3 | 64 | 26999 | 178.96 | 769 | 750 | 146.7 |
| B | 12 | 111 | 18035 | 117.84 | 769 | 750 | 146.7 |
| C | 14 | 238 | 117644 | 670.46 | 744 | 748 | 174.4 |
| C | 10 | 91 | 6603 | 33.58 | 744 | 748 | 174.4 |
| C | 13 | 61 | 5246 | 25.8 | 744 | 748 | 174.4 |
| D | 12 | 235 | 1146215 | 6389.85 | 736 | 714 | 179.3 |
| D | 1 | 52 | 639597 | 3563.82 | 736 | 714 | 179.3 |
| D | 7 | 223 | 219176 | 1218.63 | 736 | 714 | 179.3 |
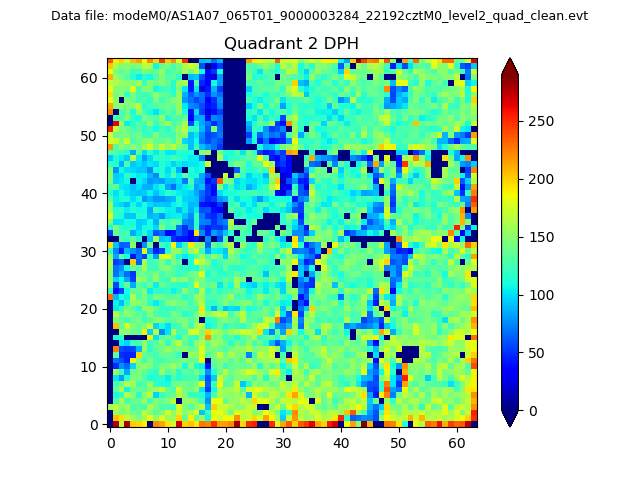
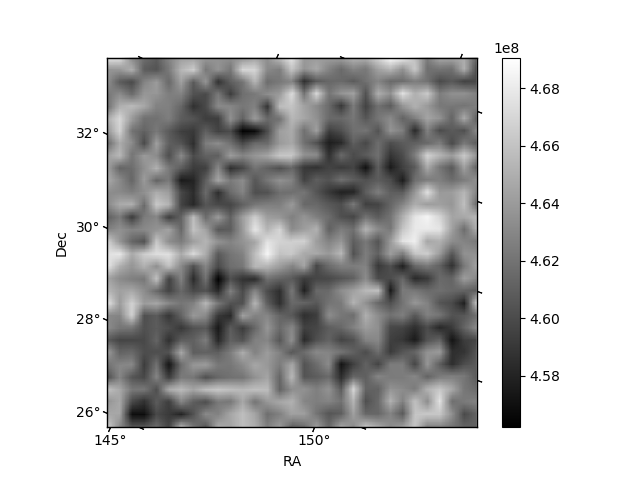
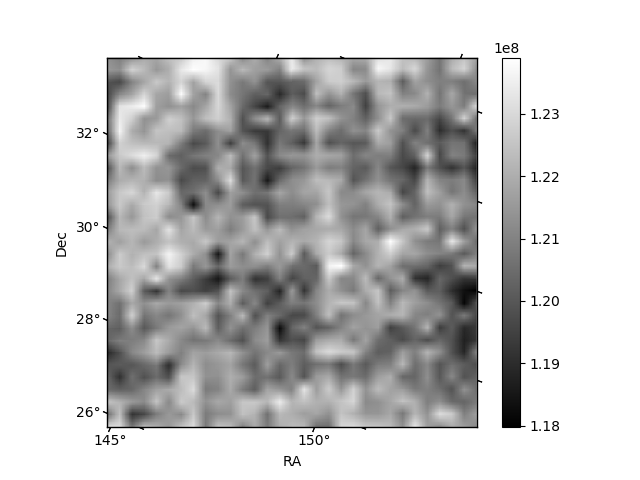
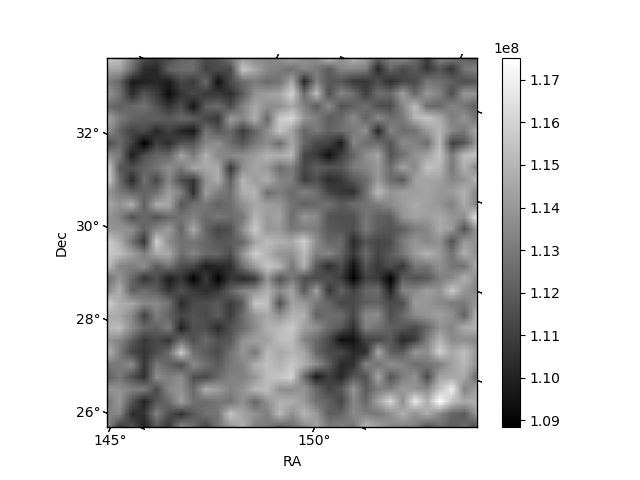
Histogram calculated using DETX and DETY for each event in the final _common_clean file
| Quadrant A | 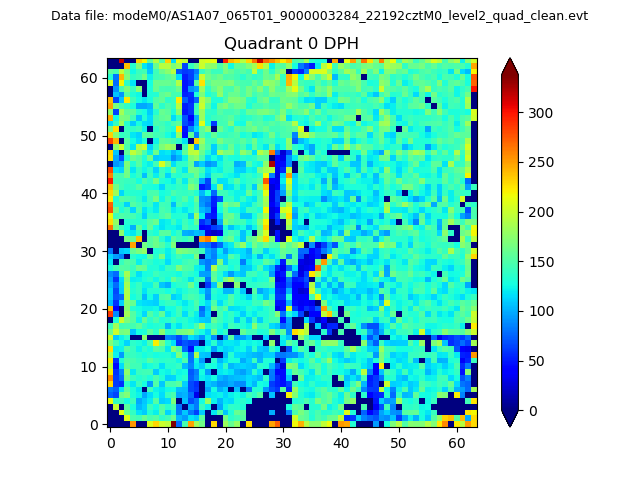 |
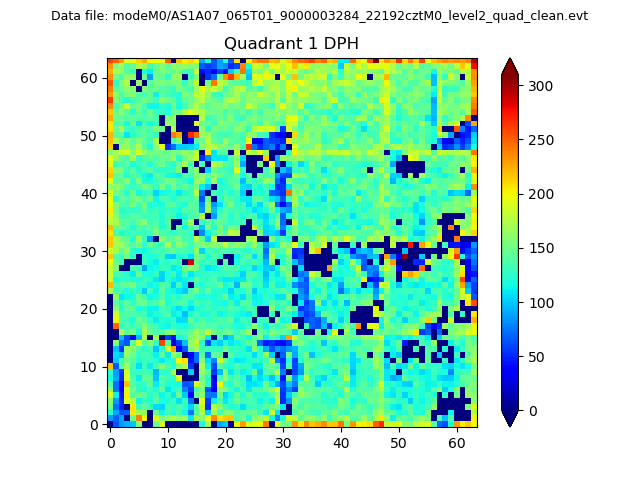 |
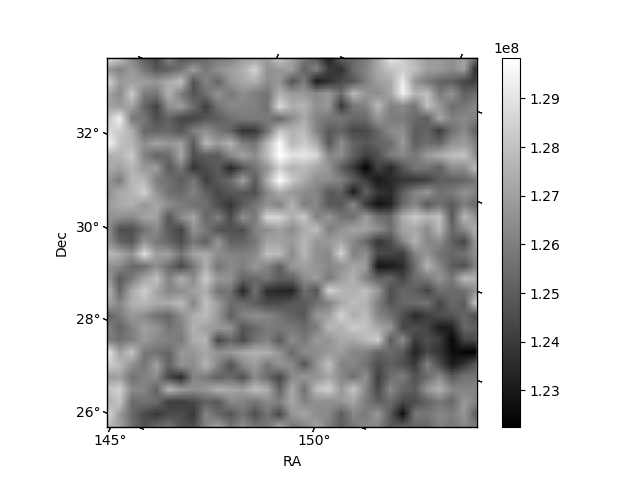
Quadrant B |
|---|---|---|---|
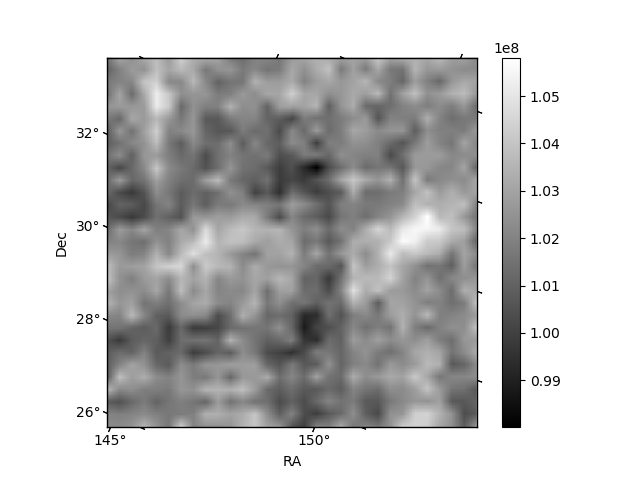
| Quadrant D | 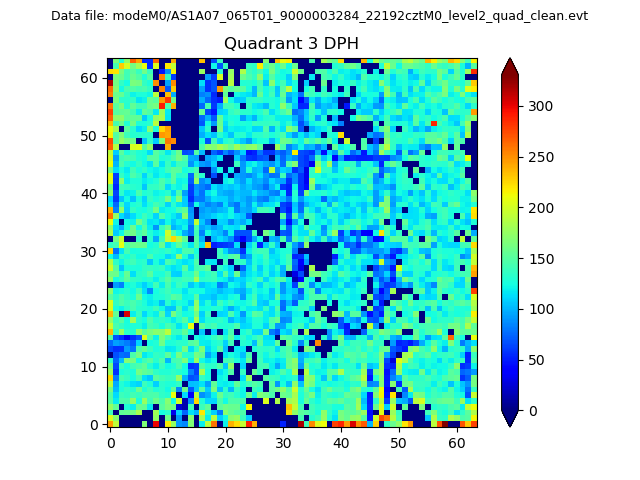 |
 |
Quadrant C |
| Plot type | Count rate plots | Images |
|---|---|---|
| Comparison with Poisson distribution Blue bars denote a histogram of data divided into 1 sec bins. Red curve is a Poisson curve with rate = median count rate of data. |
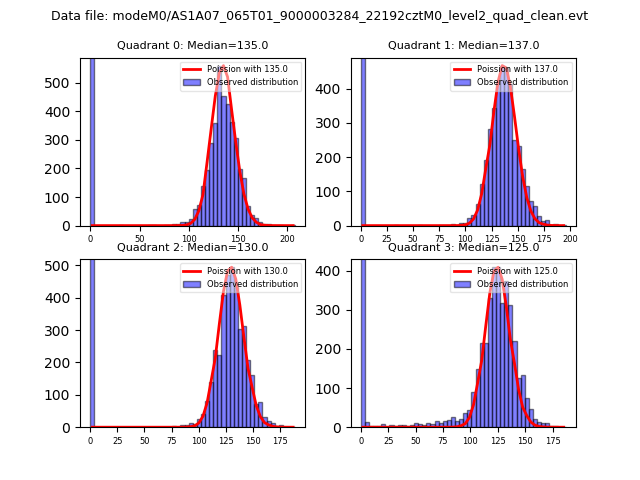 |
 |
| Quadrant-wise count rates Data is divided into 100 sec bins |
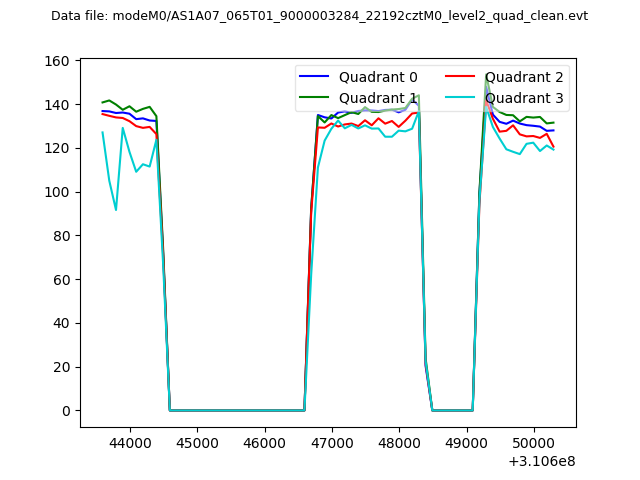 |
|
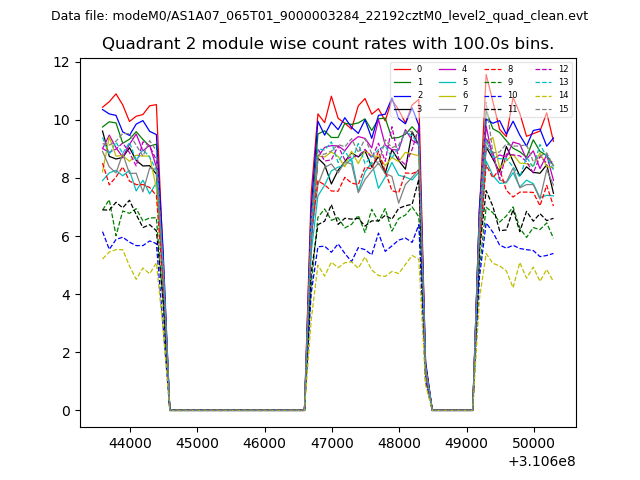
| Module-wise count rates for Quadrant A Data is divided into 100 sec bins |
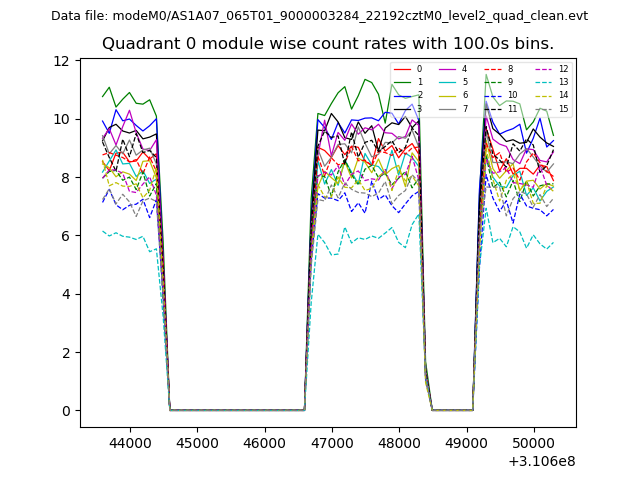 |
 |
| Module-wise count rates for Quadrant B Data is divided into 100 sec bins |
 |
 |
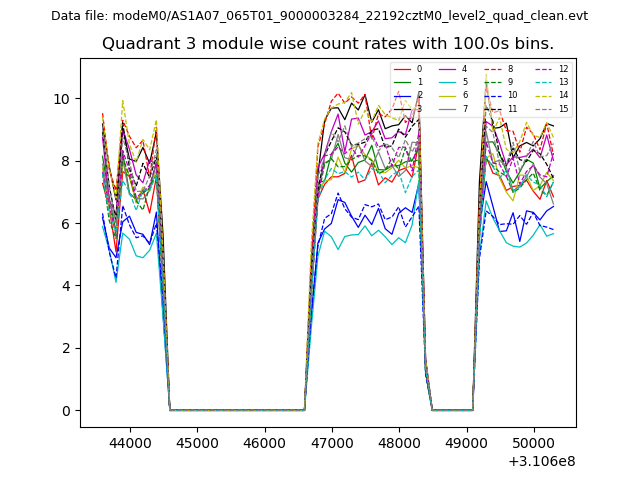
| Module-wise count rates for Quadrant C Data is divided into 100 sec bins |
 |
 |
| Module-wise count rates for Quadrant D Data is divided into 100 sec bins |
 |
 |
| Parameter | Plot |
|---|---|
| CZT HV Monitor | 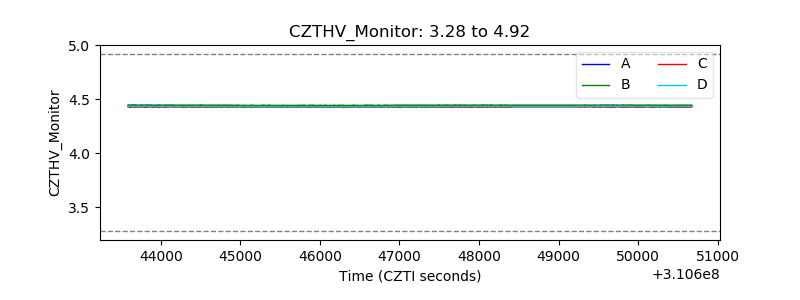 |
| D_VDD | 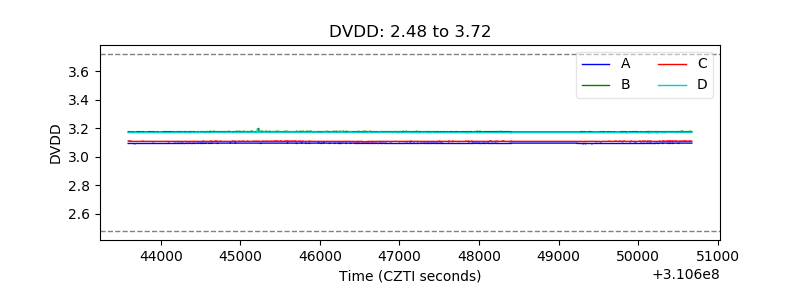 |
| Temperature 1 | 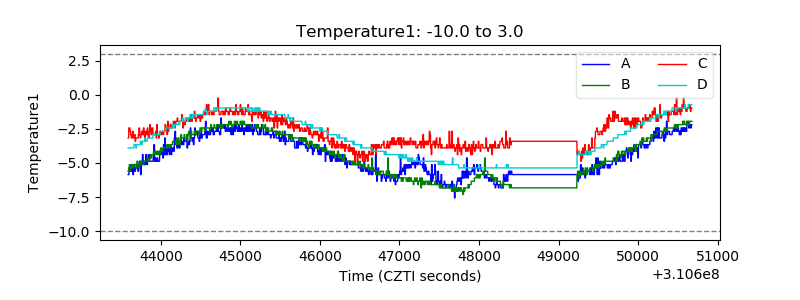 |
| Veto HV Monitor | 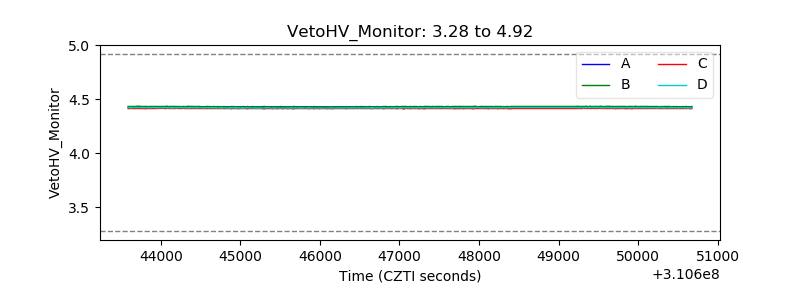 |
| Veto LLD |  |
| Alpha Counter | 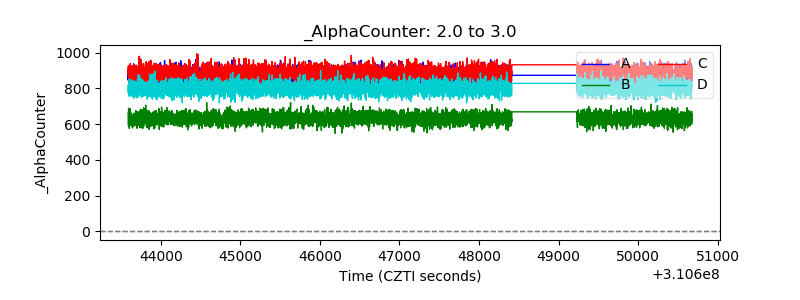 |
| _CPM_Rate | 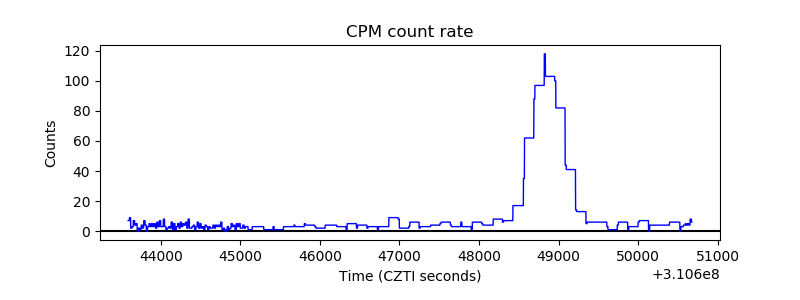 |
| CZT Counter | 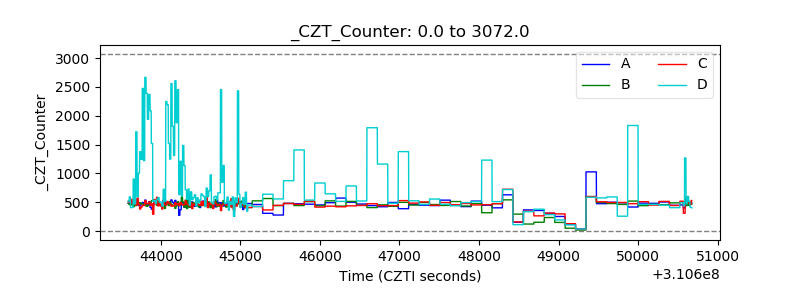 |
| +2.5 Volts monitor |  |
| +5 Volts monitor | 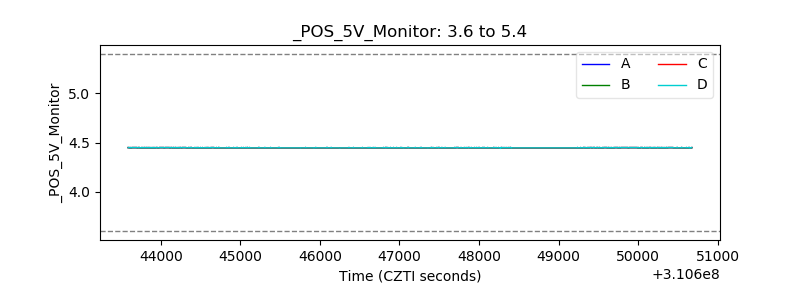 |
| _ROLL_ROT | 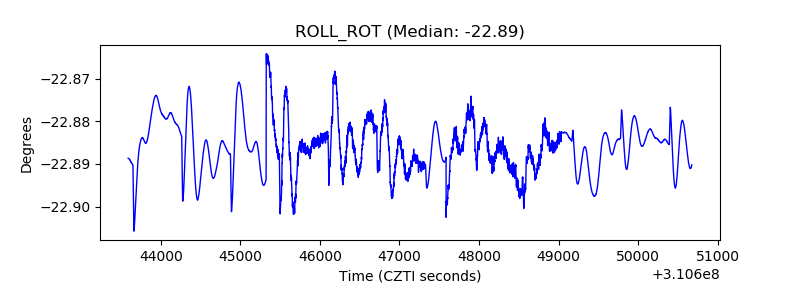 |
| _Roll_DEC | 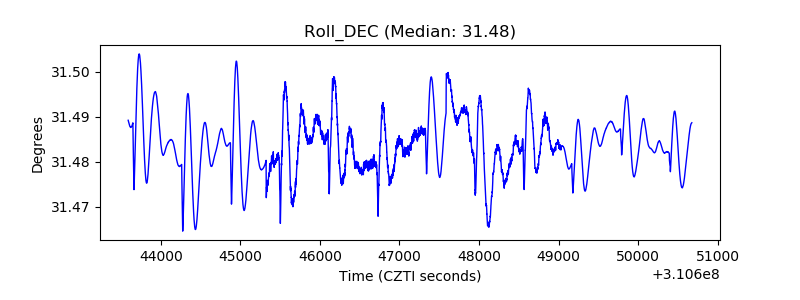 |
| _Roll_RA | 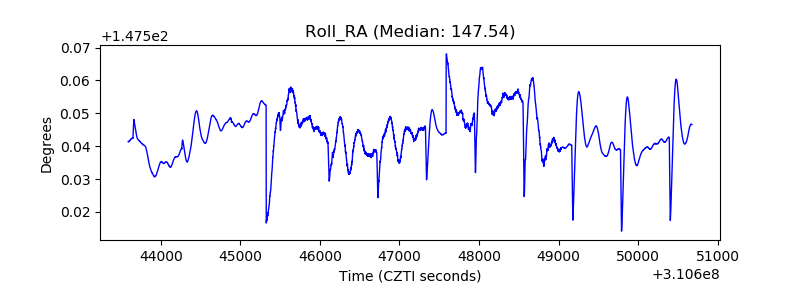 |
| Veto Counter | 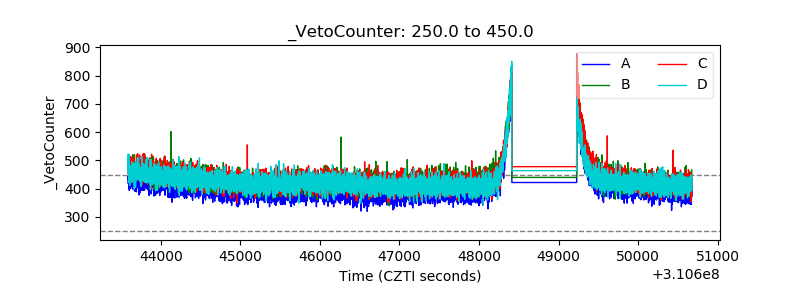 |