| Param | Original file | Final file |
|---|---|---|
| Filename | modeM0/AS1A07_065T01_9000003284_22193cztM0_level2.evt | modeM0/AS1A07_065T01_9000003284_22193cztM0_level2_quad_clean.evt |
| Size (bytes) | 478,520,640 | 81,662,400 |
| Size | 456.4 MB | 77.9 MB |
| Events in quadrant A | 3,246,787 | 513,299 |
| Events in quadrant B | 3,306,210 | 516,106 |
| Events in quadrant C | 3,293,710 | 492,559 |
| Events in quadrant D | 4,182,909 | 476,521 |
| Mode SS | |||
|---|---|---|---|
| Quadrant | BADHDUFLAG | Total packets | Discarded packets |
| A | 0 | 138 | 0 |
| B | 0 | 138 | 0 |
| C | 0 | 138 | 0 |
| D | 0 | 138 | 0 |
| Mode M9 | |||
|---|---|---|---|
| Quadrant | BADHDUFLAG | Total packets | Discarded packets |
| A | 0 | 4 | 0 |
| B | 0 | 4 | 0 |
| C | 0 | 4 | 0 |
| D | 0 | 4 | 0 |
| Mode M0 | |||
|---|---|---|---|
| Quadrant | BADHDUFLAG | Total packets | Discarded packets |
| A | 0 | 13985 | 1 |
| B | 0 | 14057 | 1 |
| C | 0 | 14047 | 1 |
| D | 0 | 16840 | 1 |
| Quadrant | Total seconds | Saturated seconds | Saturation percentage |
|---|---|---|---|
| A | 6802 | 151 | 2.219935% |
| B | 6802 | 163 | 2.396354% |
| C | 6802 | 187 | 2.749191% |
| D | 6803 | 371 | 5.453476% |
Noise dominated data is calculated using 1-second bins in cleaned event files. If a bin has >2000 counts, and if more than 50% of those come from <1% of pixels, then it is considered to be noise-dominated and hence unusable.
| Quadrant | # 1 sec bins | Bins with >0 counts | Bins with >2000 counts | High rate bins dominated by noise | Noise dominated (total time) | Noise dominated (detector-on time) | Marked lightcurve |
|---|---|---|---|---|---|---|---|
| A | 7187 | 6803 | 0 | 0 | 0.00% | 0.00% | 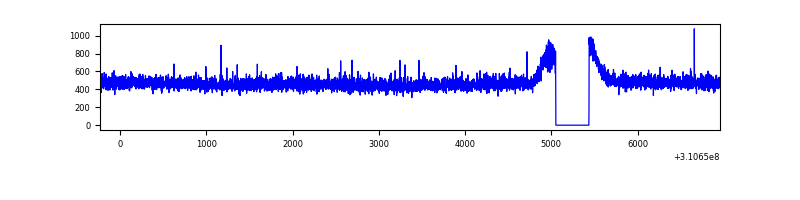 |
| B | 7187 | 6803 | 2 | 2 | 0.03% | 0.03% | 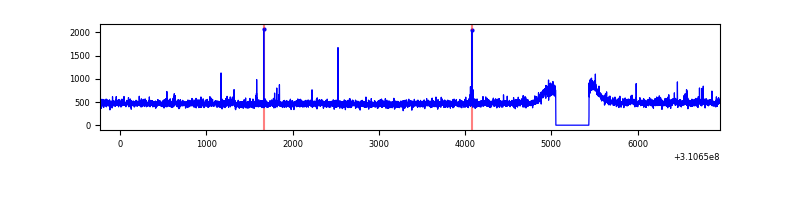 |
| C | 7187 | 6803 | 0 | 0 | 0.00% | 0.00% | 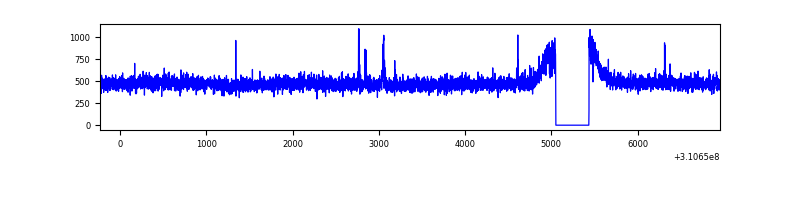 |
| D | 7188 | 6803 | 188 | 188 | 2.62% | 2.76% | 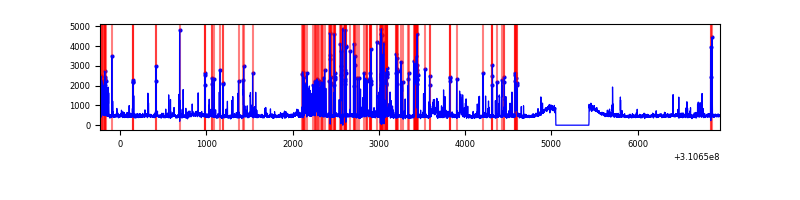 |
Top three noisy pixels from each quadrant. If the there are fewer than three noisy pixels in the level2.evt file, extra rows are filled as -1
| Pixel properties | Quadrant properties | ||||||
|---|---|---|---|---|---|---|---|
| Quadrant | DetID | PixID | Counts | Sigma | Mean | Median | Sigma |
| A | 13 | 254 | 12182 | 66.63 | 842 | 823 | 170.5 |
| A | 0 | 226 | 7335 | 38.2 | 842 | 823 | 170.5 |
| A | 3 | 137 | 7277 | 37.86 | 842 | 823 | 170.5 |
| B | 12 | 111 | 19897 | 118.9 | 832 | 812 | 160.5 |
| B | 11 | 111 | 17637 | 104.82 | 832 | 812 | 160.5 |
| B | 0 | 190 | 16469 | 97.54 | 832 | 812 | 160.5 |
| C | 14 | 238 | 125081 | 655.29 | 802 | 804 | 189.7 |
| C | 10 | 22 | 22595 | 114.9 | 802 | 804 | 189.7 |
| C | 10 | 91 | 12803 | 63.27 | 802 | 804 | 189.7 |
| D | 1 | 52 | 927712 | 4766.02 | 806 | 784 | 194.5 |
| D | 7 | 223 | 66582 | 338.32 | 806 | 784 | 194.5 |
| D | 12 | 233 | 53564 | 271.38 | 806 | 784 | 194.5 |
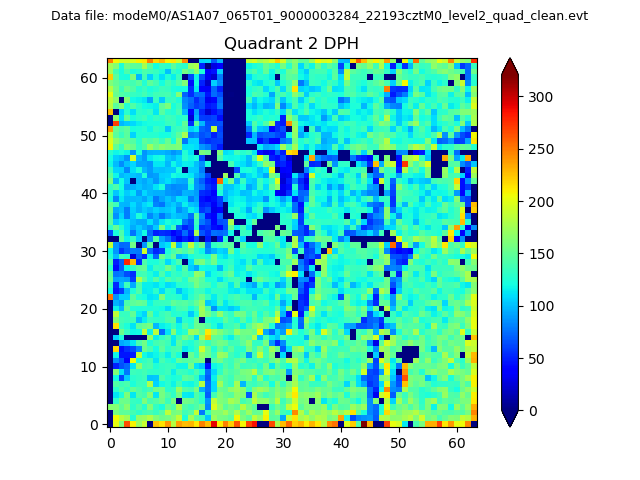
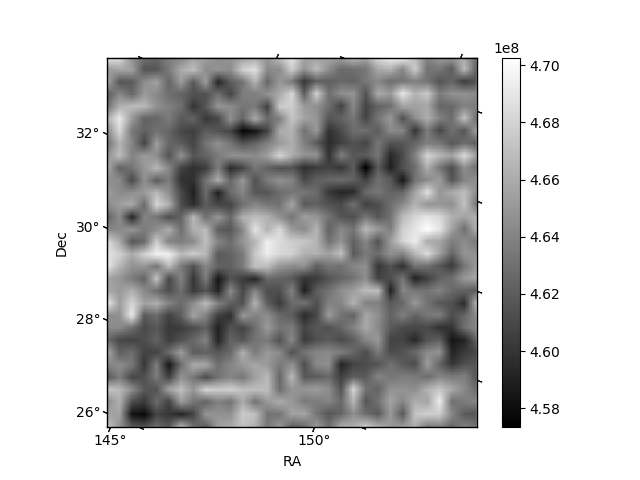
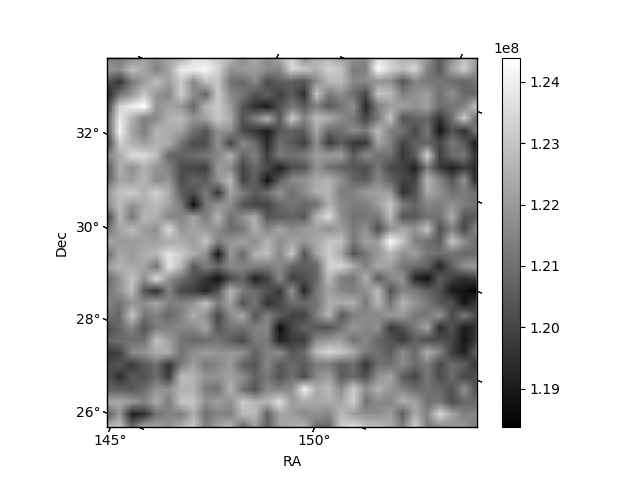
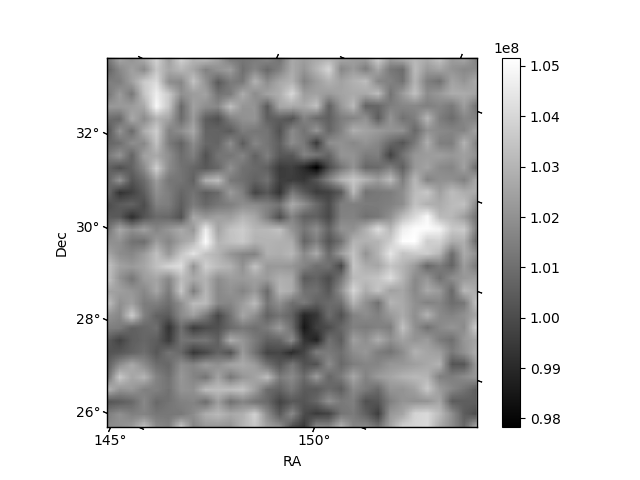
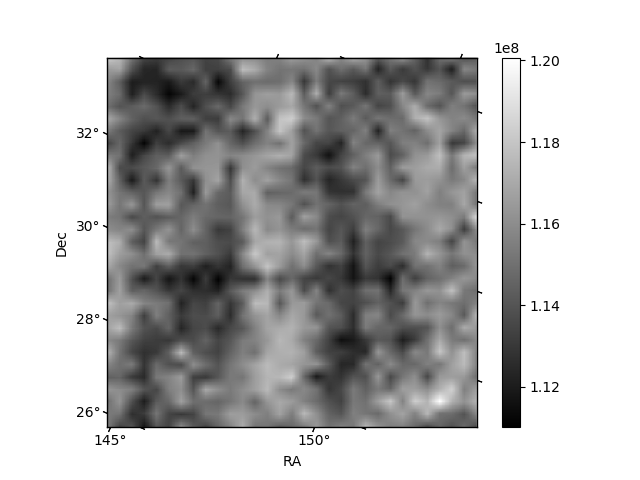
Histogram calculated using DETX and DETY for each event in the final _common_clean file
| Quadrant A | 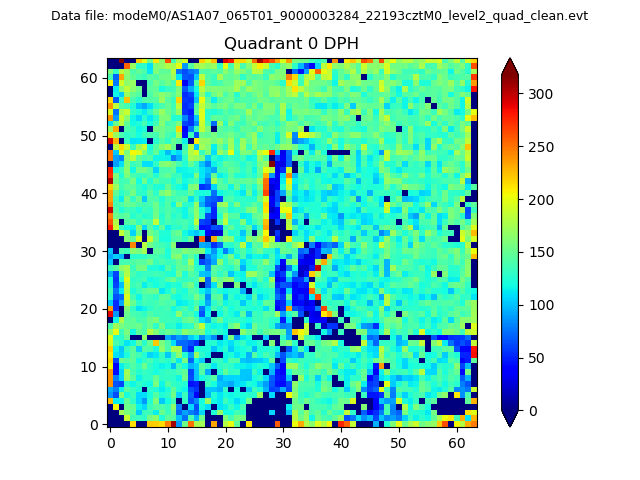 |
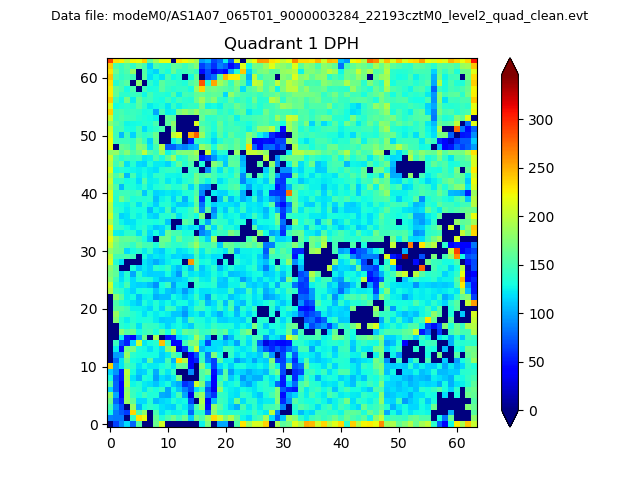 |
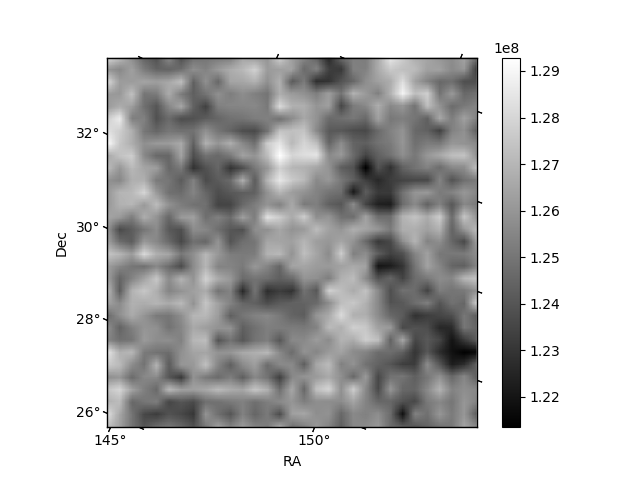
Quadrant B |
|---|---|---|---|
| Quadrant D | 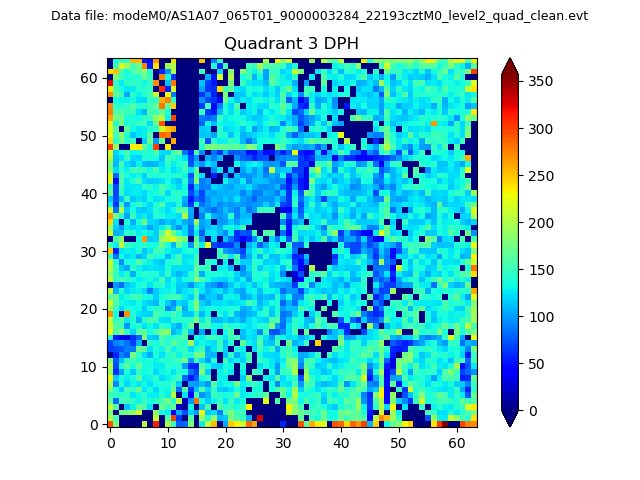 |
 |
Quadrant C |
| Plot type | Count rate plots | Images |
|---|---|---|
| Comparison with Poisson distribution Blue bars denote a histogram of data divided into 1 sec bins. Red curve is a Poisson curve with rate = median count rate of data. |
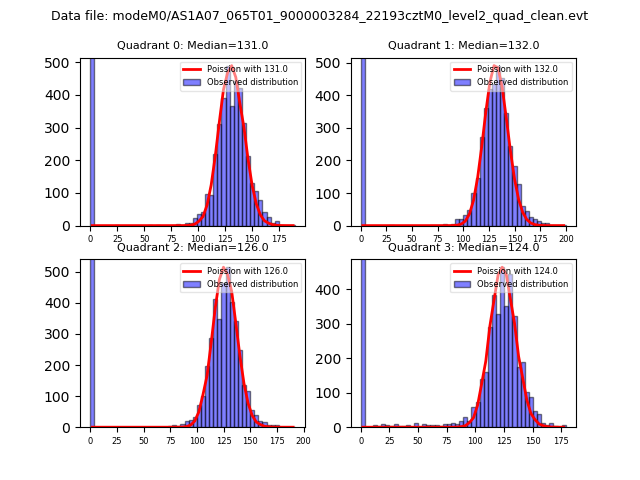 |
 |
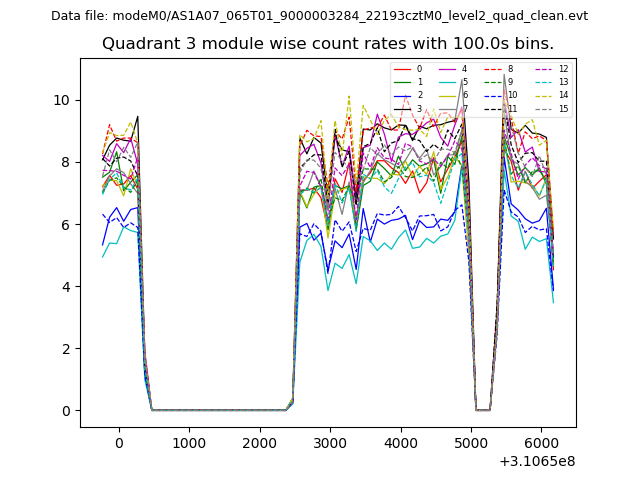
| Quadrant-wise count rates Data is divided into 100 sec bins |
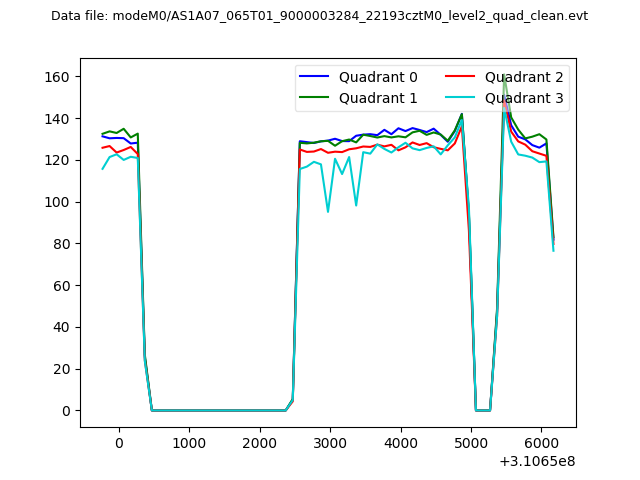 |
|
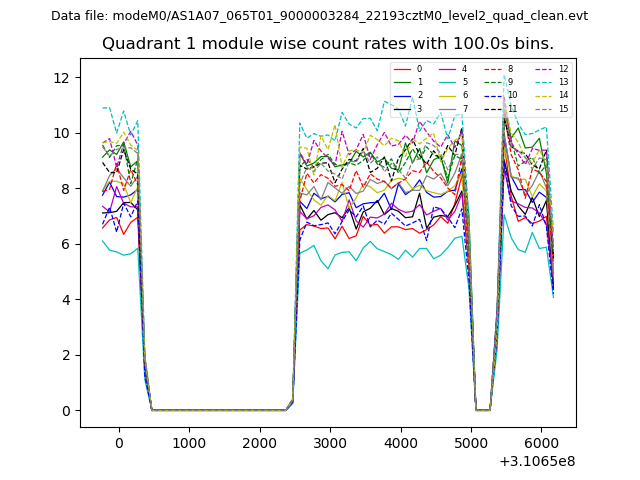
| Module-wise count rates for Quadrant A Data is divided into 100 sec bins |
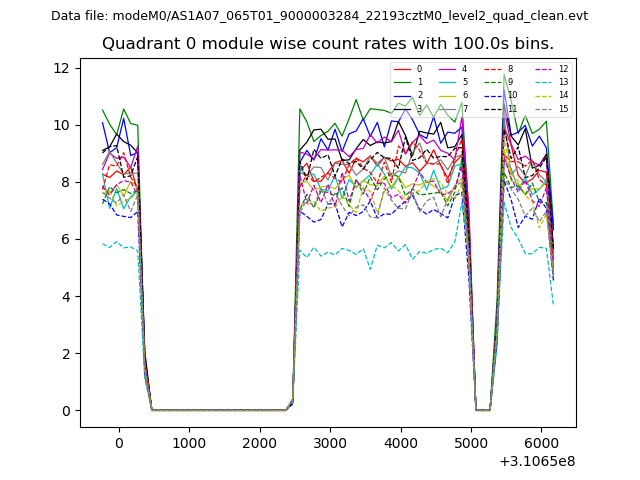 |
 |
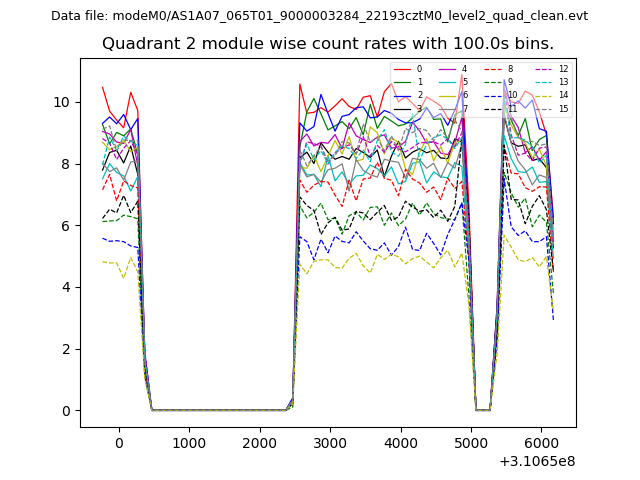
| Module-wise count rates for Quadrant B Data is divided into 100 sec bins |
 |
 |
| Module-wise count rates for Quadrant C Data is divided into 100 sec bins |
 |
 |
| Module-wise count rates for Quadrant D Data is divided into 100 sec bins |
 |
 |
| Parameter | Plot |
|---|---|
| CZT HV Monitor | 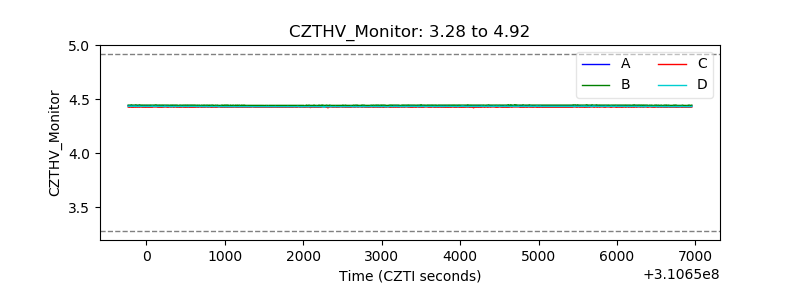 |
| D_VDD | 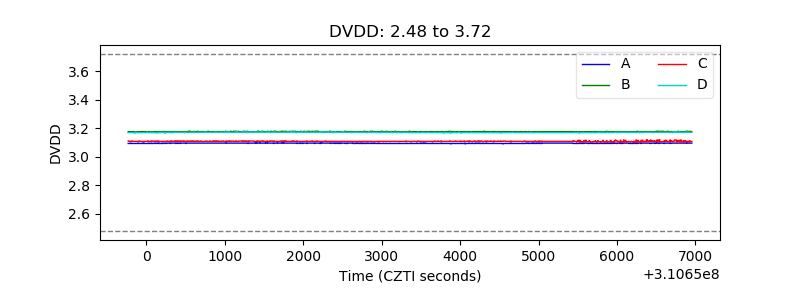 |
| Temperature 1 | 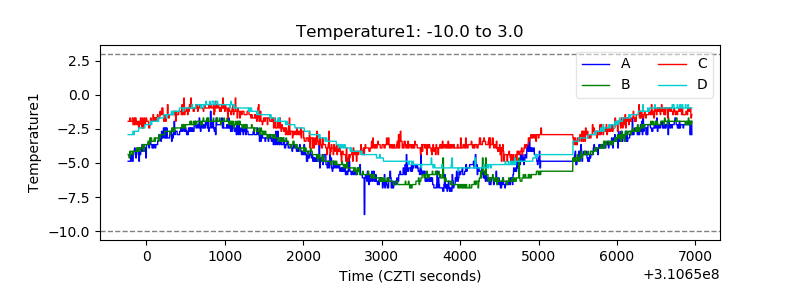 |
| Veto HV Monitor | 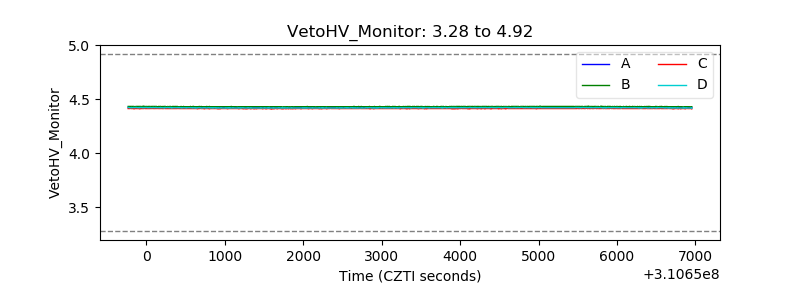 |
| Veto LLD | 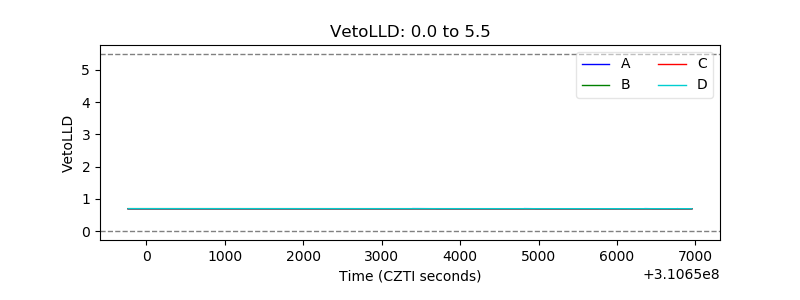 |
| Alpha Counter | 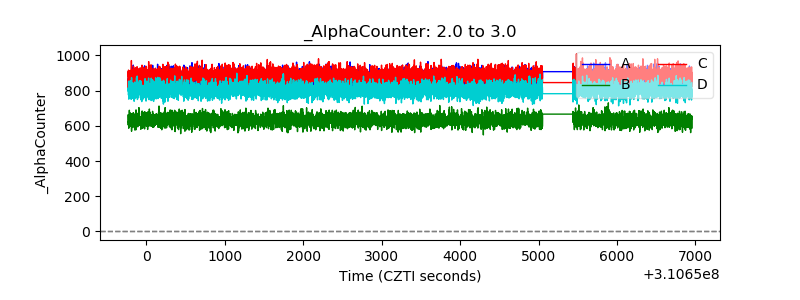 |
| _CPM_Rate | 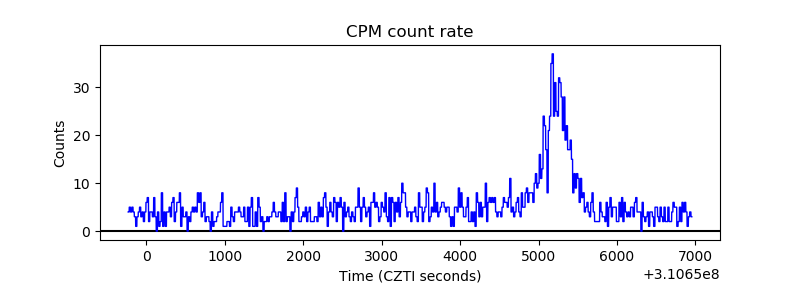 |
| CZT Counter | 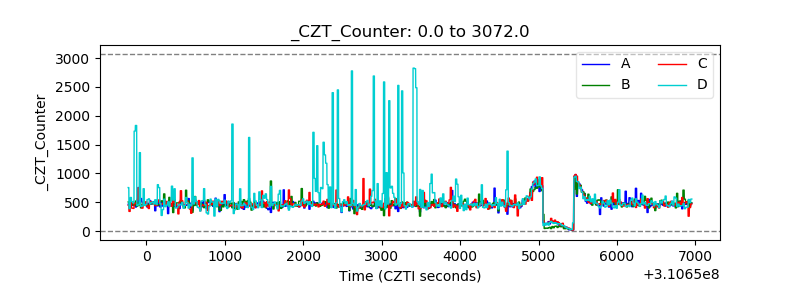 |
| +2.5 Volts monitor |  |
| +5 Volts monitor | 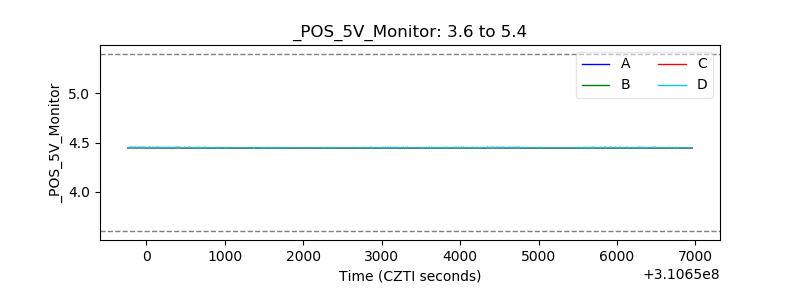 |
| _ROLL_ROT | 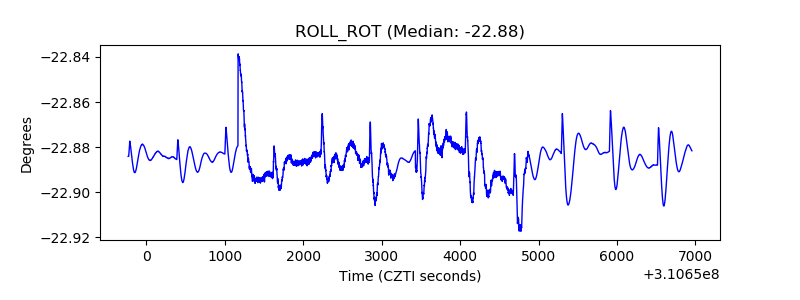 |
| _Roll_DEC | 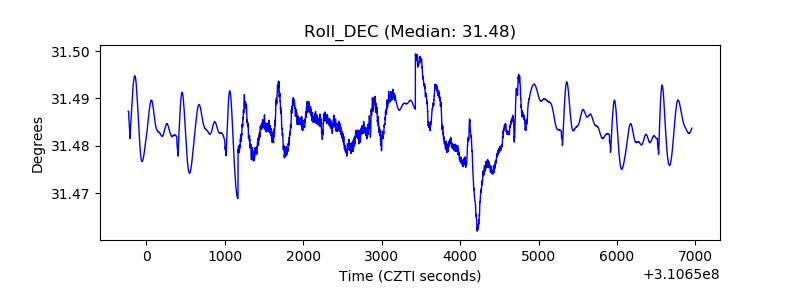 |
| _Roll_RA | 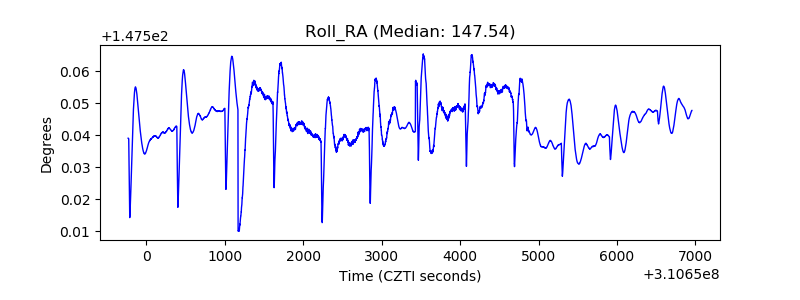 |
| Veto Counter | 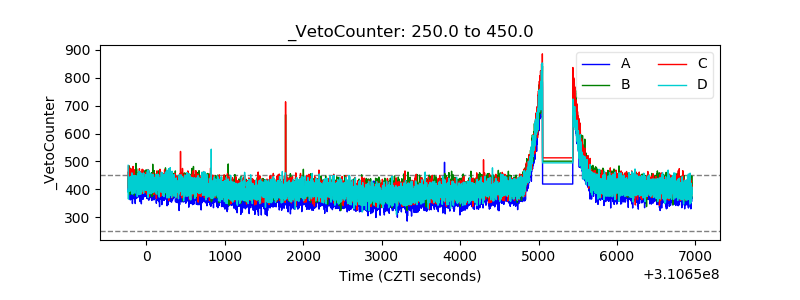 |