| Param | Original file | Final file |
|---|---|---|
| Filename | modeM0/AS1A07_065T01_9000003284_22194cztM0_level2.evt | modeM0/AS1A07_065T01_9000003284_22194cztM0_level2_quad_clean.evt |
| Size (bytes) | 533,730,240 | 87,946,560 |
| Size | 509.0 MB | 83.9 MB |
| Events in quadrant A | 3,629,469 | 547,163 |
| Events in quadrant B | 3,729,626 | 550,358 |
| Events in quadrant C | 3,666,892 | 526,950 |
| Events in quadrant D | 4,625,809 | 513,817 |
| Mode SS | |||
|---|---|---|---|
| Quadrant | BADHDUFLAG | Total packets | Discarded packets |
| A | 0 | 156 | 0 |
| B | 0 | 156 | 0 |
| C | 0 | 156 | 0 |
| D | 0 | 156 | 0 |
| Mode M9 | |||
|---|---|---|---|
| Quadrant | BADHDUFLAG | Total packets | Discarded packets |
| A | 0 | 6 | 0 |
| B | 0 | 7 | 0 |
| C | 0 | 7 | 0 |
| D | 0 | 7 | 0 |
| Mode M0 | |||
|---|---|---|---|
| Quadrant | BADHDUFLAG | Total packets | Discarded packets |
| A | 0 | 15604 | 2 |
| B | 0 | 15744 | 3 |
| C | 0 | 15646 | 2 |
| D | 0 | 18660 | 2 |
| Quadrant | Total seconds | Saturated seconds | Saturation percentage |
|---|---|---|---|
| A | 7545 | 126 | 1.669980% |
| B | 7544 | 153 | 2.028102% |
| C | 7544 | 193 | 2.558324% |
| D | 7544 | 356 | 4.718982% |
Noise dominated data is calculated using 1-second bins in cleaned event files. If a bin has >2000 counts, and if more than 50% of those come from <1% of pixels, then it is considered to be noise-dominated and hence unusable.
| Quadrant | # 1 sec bins | Bins with >0 counts | Bins with >2000 counts | High rate bins dominated by noise | Noise dominated (total time) | Noise dominated (detector-on time) | Marked lightcurve |
|---|---|---|---|---|---|---|---|
| A | 7810 | 7547 | 0 | 0 | 0.00% | 0.00% | 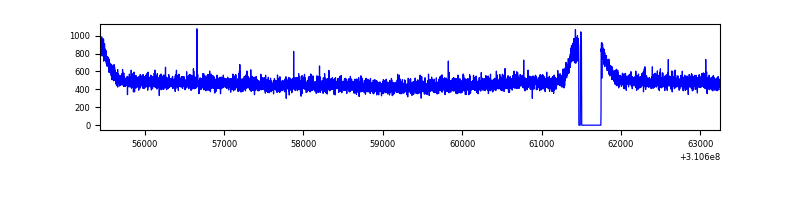 |
| B | 7809 | 7546 | 0 | 0 | 0.00% | 0.00% | 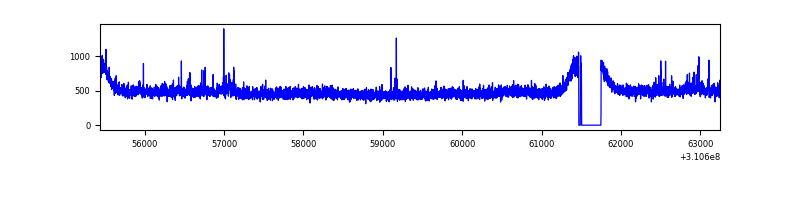 |
| C | 7809 | 7546 | 0 | 0 | 0.00% | 0.00% | 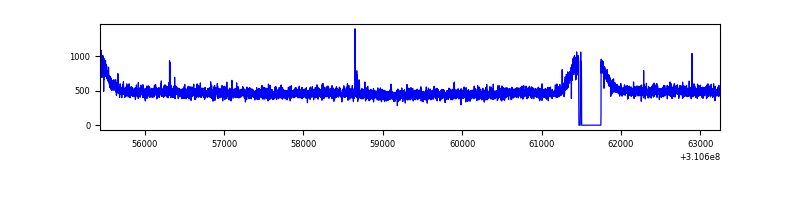 |
| D | 7809 | 7546 | 221 | 221 | 2.83% | 2.93% | 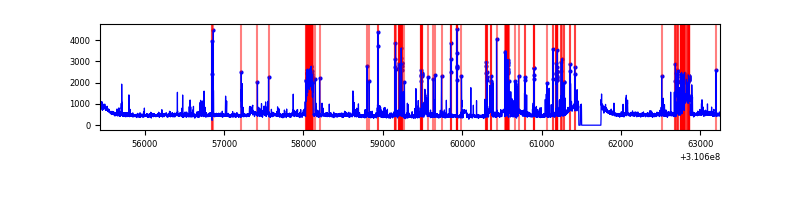 |
Top three noisy pixels from each quadrant. If the there are fewer than three noisy pixels in the level2.evt file, extra rows are filled as -1
| Pixel properties | Quadrant properties | ||||||
|---|---|---|---|---|---|---|---|
| Quadrant | DetID | PixID | Counts | Sigma | Mean | Median | Sigma |
| A | 13 | 254 | 13403 | 65.56 | 941 | 921 | 190.4 |
| A | 3 | 137 | 8252 | 38.51 | 941 | 921 | 190.4 |
| A | 0 | 226 | 7934 | 36.84 | 941 | 921 | 190.4 |
| B | 0 | 190 | 40333 | 218.84 | 931 | 907 | 180.2 |
| B | 12 | 111 | 22221 | 118.31 | 931 | 907 | 180.2 |
| B | 11 | 111 | 19831 | 105.04 | 931 | 907 | 180.2 |
| C | 14 | 238 | 139142 | 648.97 | 895 | 900 | 213.0 |
| C | 10 | 22 | 13897 | 61.01 | 895 | 900 | 213.0 |
| C | 8 | 128 | 13269 | 58.07 | 895 | 900 | 213.0 |
| D | 1 | 52 | 954176 | 4337.43 | 906 | 880 | 219.8 |
| D | 12 | 227 | 89343 | 402.5 | 906 | 880 | 219.8 |
| D | 13 | 104 | 49120 | 219.49 | 906 | 880 | 219.8 |
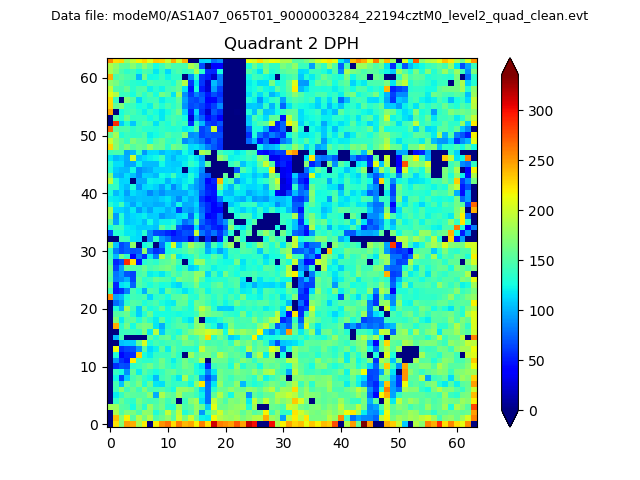
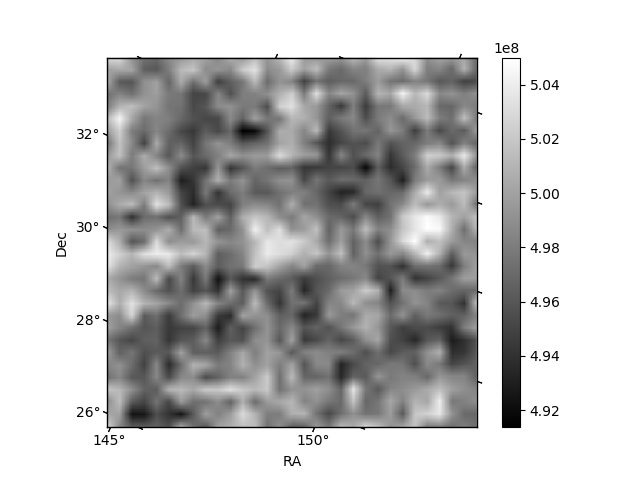
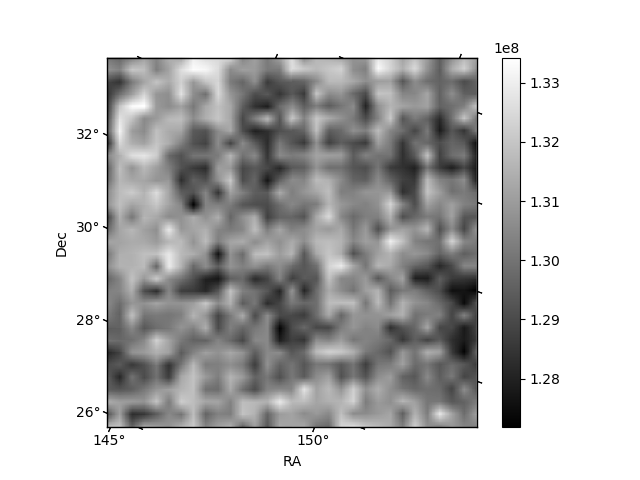
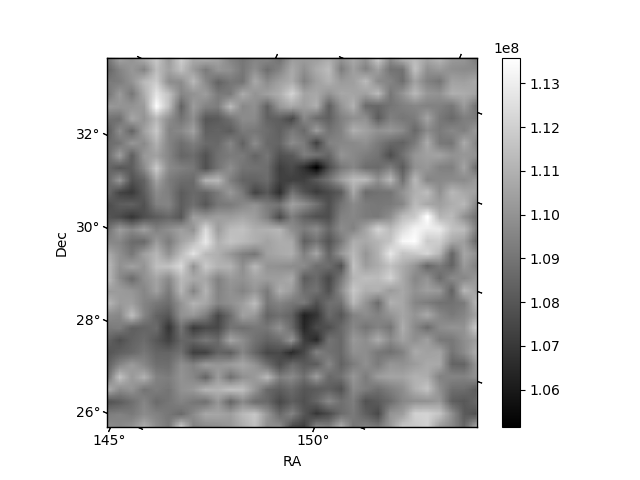
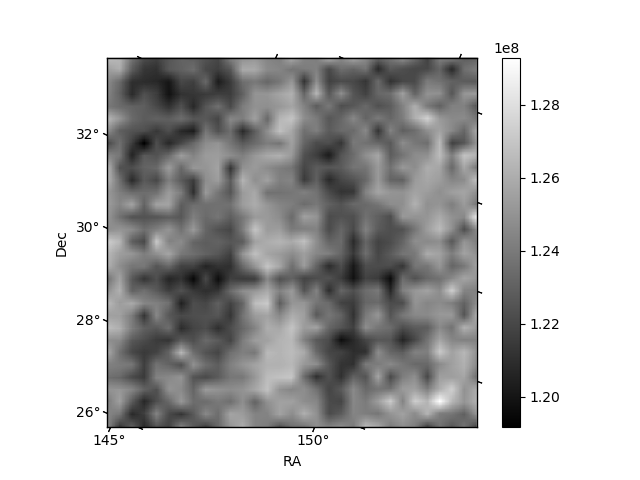
Histogram calculated using DETX and DETY for each event in the final _common_clean file
| Quadrant A | 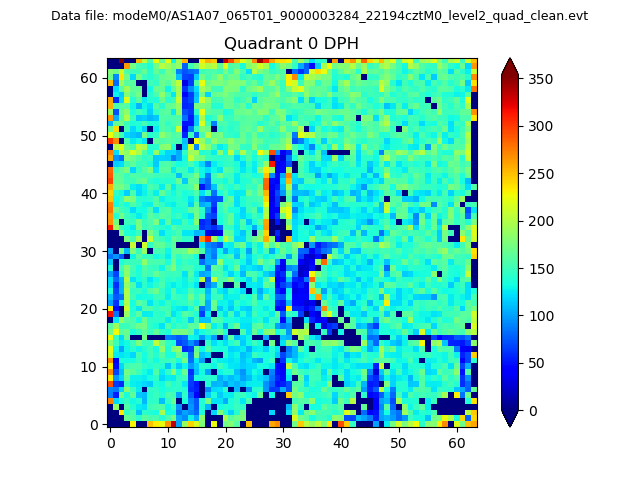 |
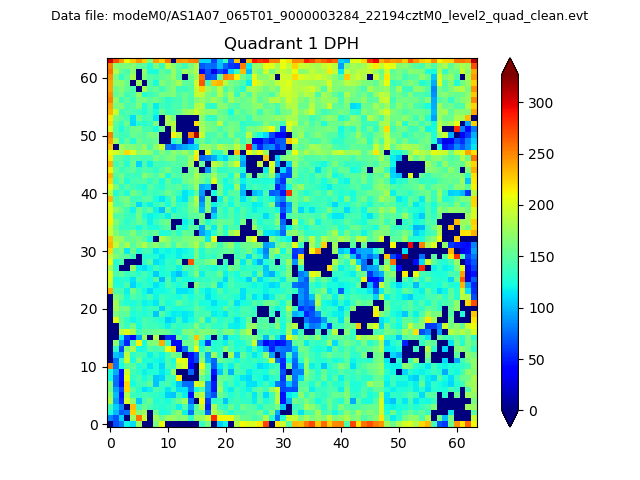 |
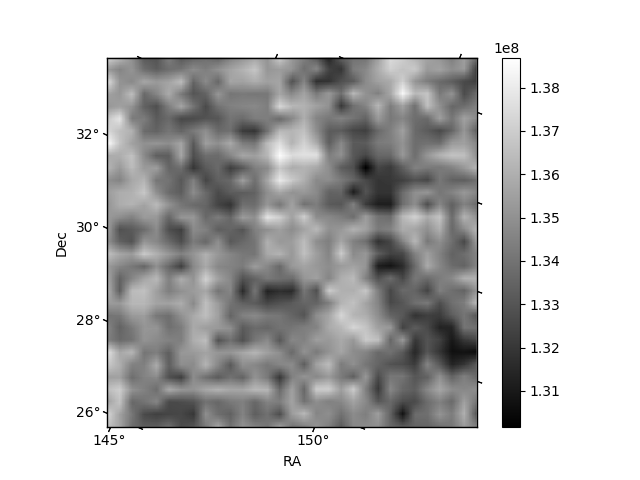
Quadrant B |
|---|---|---|---|
| Quadrant D | 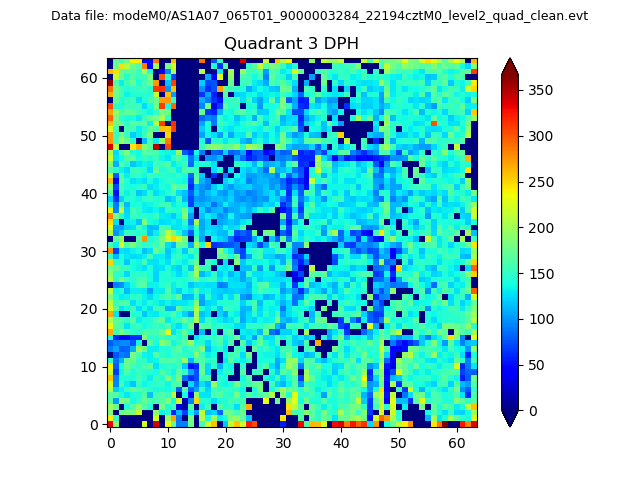 |
 |
Quadrant C |
| Plot type | Count rate plots | Images |
|---|---|---|
| Comparison with Poisson distribution Blue bars denote a histogram of data divided into 1 sec bins. Red curve is a Poisson curve with rate = median count rate of data. |
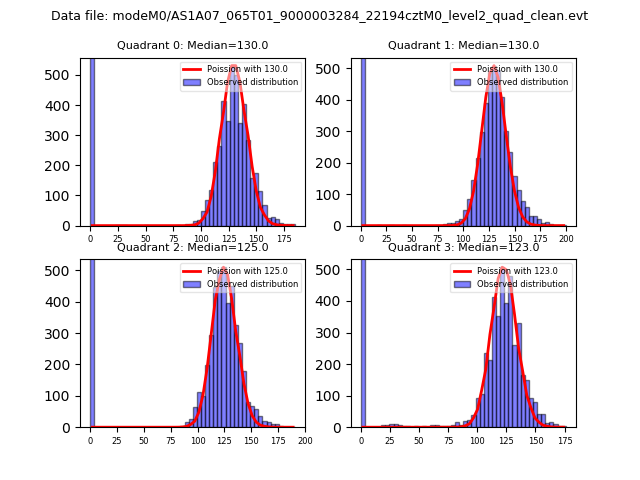 |
 |
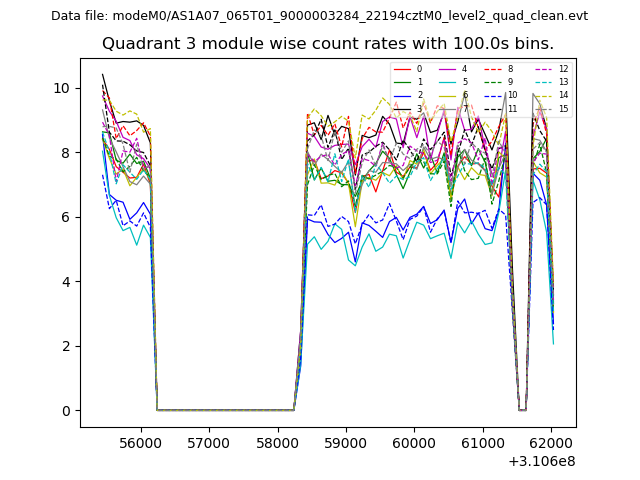
| Quadrant-wise count rates Data is divided into 100 sec bins |
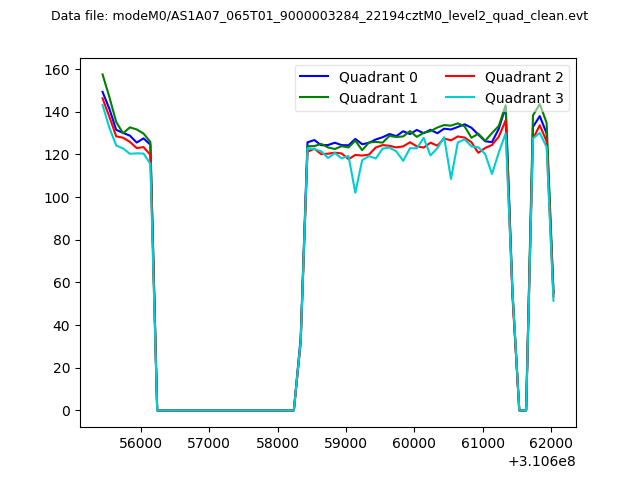 |
|
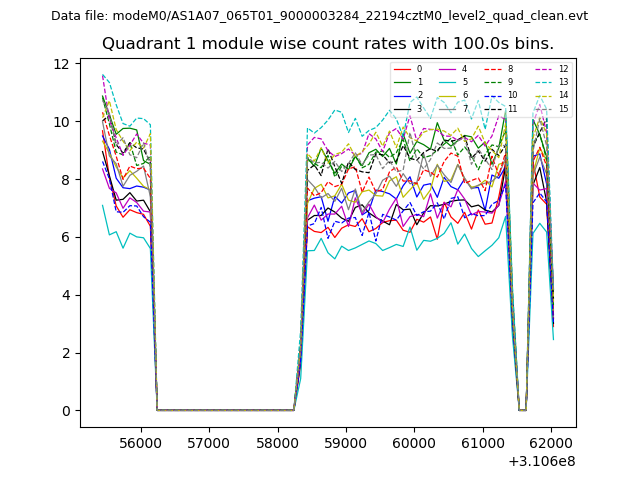
| Module-wise count rates for Quadrant A Data is divided into 100 sec bins |
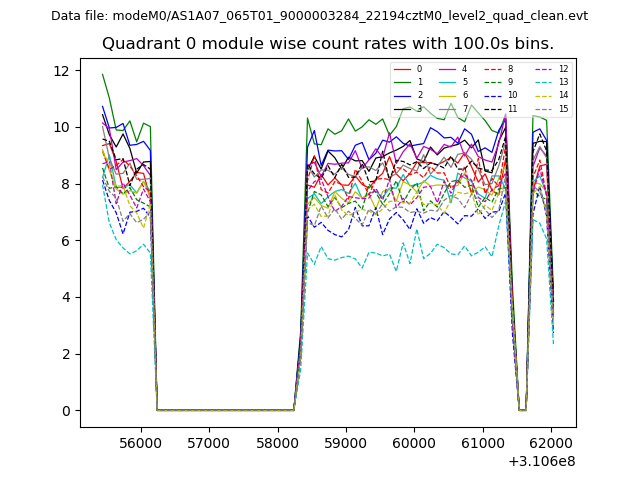 |
 |
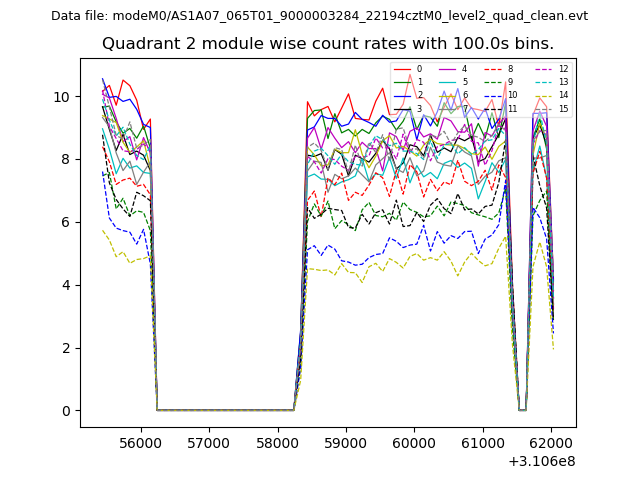
| Module-wise count rates for Quadrant B Data is divided into 100 sec bins |
 |
 |
| Module-wise count rates for Quadrant C Data is divided into 100 sec bins |
 |
 |
| Module-wise count rates for Quadrant D Data is divided into 100 sec bins |
 |
 |
| Parameter | Plot |
|---|---|
| CZT HV Monitor | 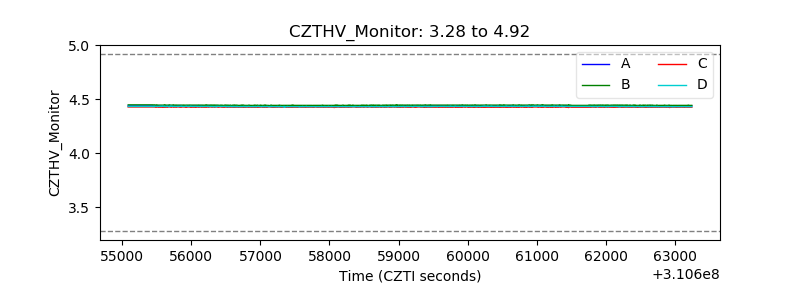 |
| D_VDD | 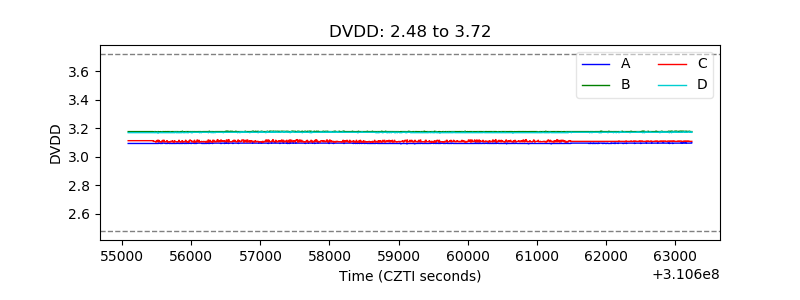 |
| Temperature 1 | 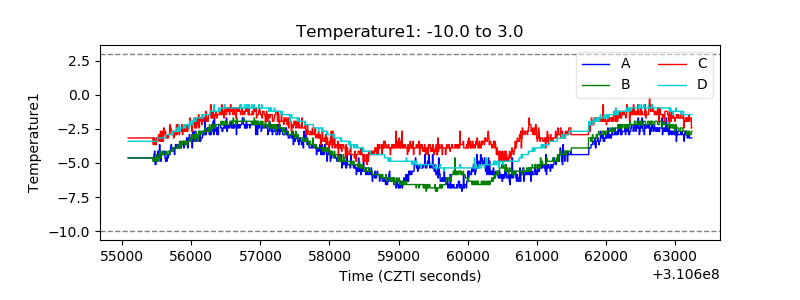 |
| Veto HV Monitor | 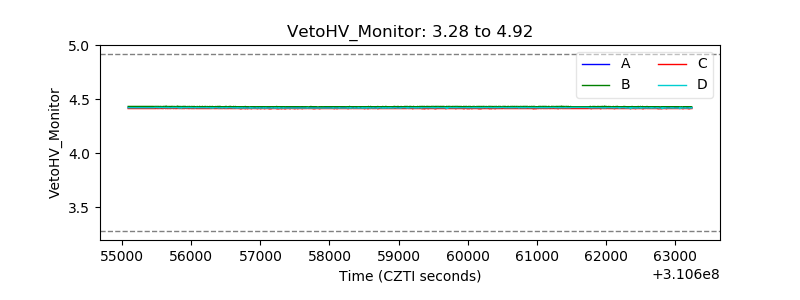 |
| Veto LLD | 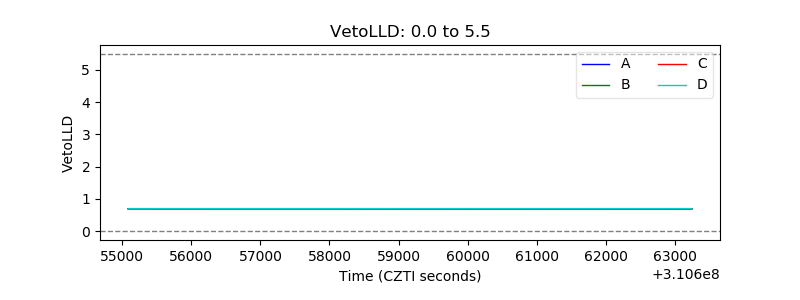 |
| Alpha Counter | 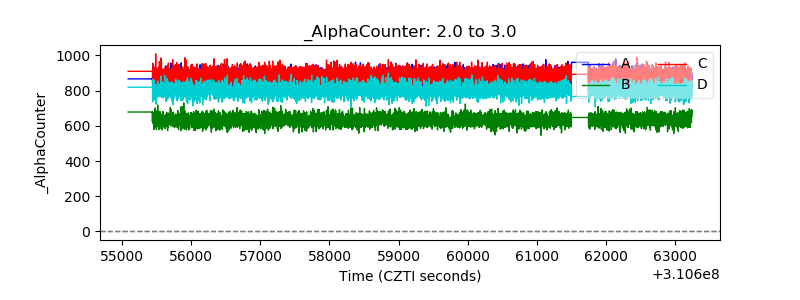 |
| _CPM_Rate | 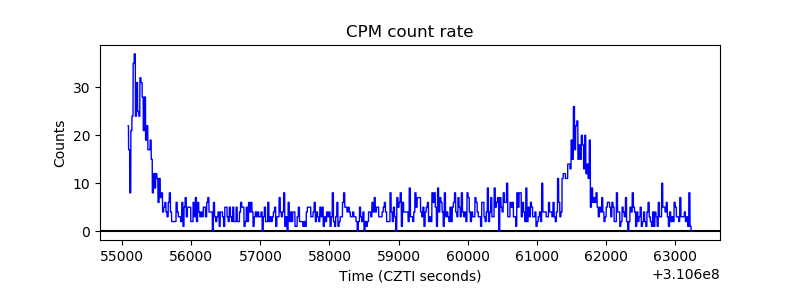 |
| CZT Counter | 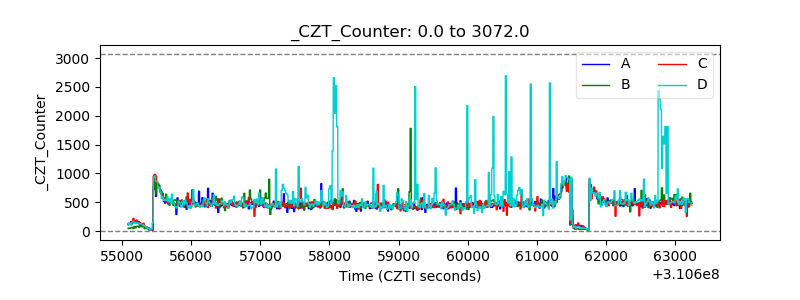 |
| +2.5 Volts monitor |  |
| +5 Volts monitor | 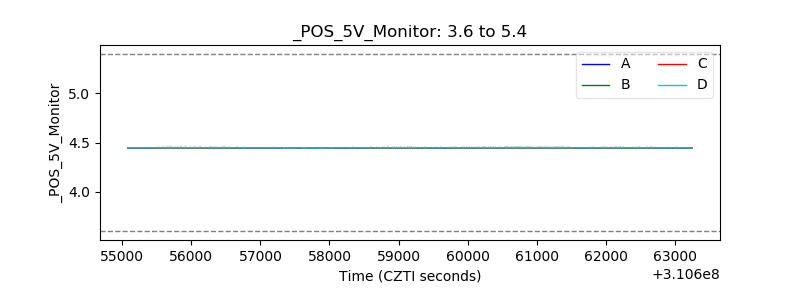 |
| _ROLL_ROT | 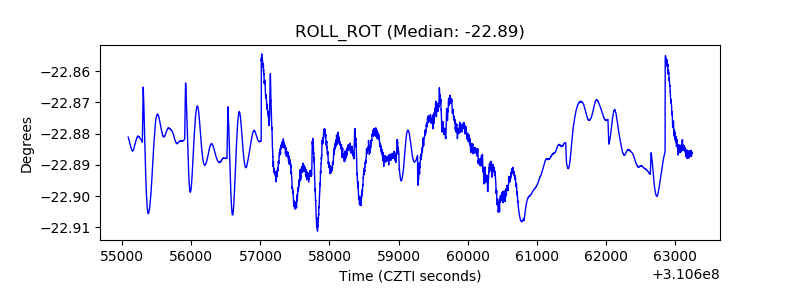 |
| _Roll_DEC | 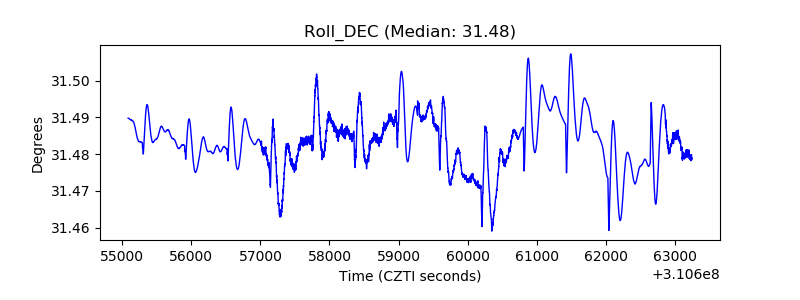 |
| _Roll_RA | 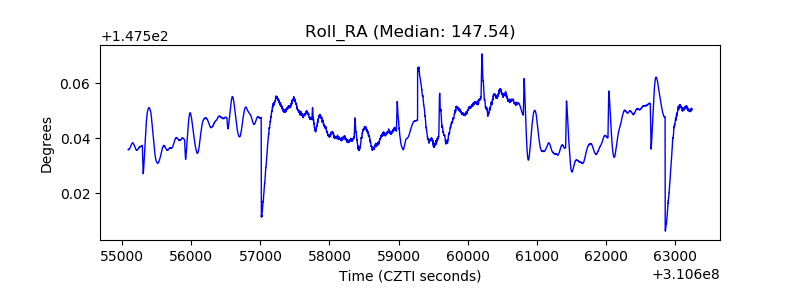 |
| Veto Counter | 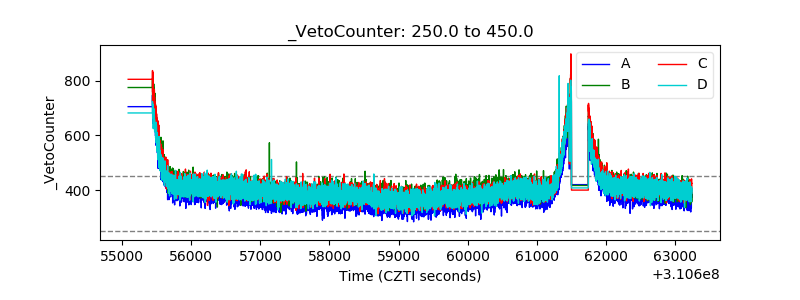 |